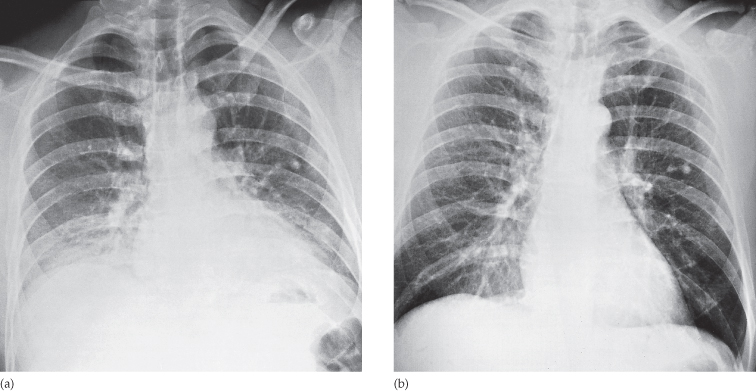
Fig. 2.2 Effect of expiration on chest films showing two films of the same patient taken one after the other. (a) Expiration. (b) Inspiration. On expiration the heart appears larger and the lung bases are hazy.
Even though chest films are the commonest x-ray examinations performed, they are amongst the most difficult to interpret. In developing your interpretation technique, a routine is necessary in order to avoid overlooking valuable radiological signs. The order in which one looks at the structures is unimportant; what matters is to follow a routine, otherwise significant abnormalities will be missed. One approach to examining the frontal and lateral chest films is presented below.
Trace the Diaphragm
The upper surfaces of the diaphragm should be clearly visible from one costophrenic angle to the other, except where the heart and mediastinum are in contact with the diaphragm. On a good inspiratory film, the dome of the right hemidiaphragm is at the level of the anterior end of the sixth rib, the right hemidiaphragm being up to 2.5 cm higher than the left.
Check the Size and Shape of the Heart
See Figures 2.1 and 2.3 and Chapter 3 for details.
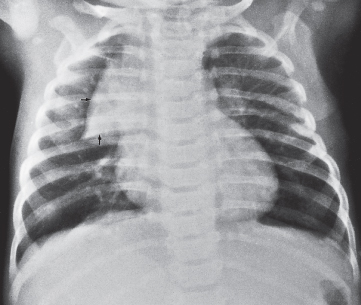
Fig. 2.3 Normal but prominent thymus in a child aged 3 months. The thymus shows the characteristic ‘sail shape’ projecting to the right of the mediastinum (arrows). This appearance should not be confused with right upper lobe consolidation or collapse.
Check the Position of the Heart and Mediastinum
Normally, the trachea lies midway, or slightly to the right of the midpoint, between the medial ends of the clavicles. The position of the heart is variable; on average one-third lies to the right of the midline.
Look at the Mediastinum
The outline of the mediastinum and heart should be clearly seen, except where the heart lies in contact with the diaphragm. The right superior mediastinal border is usually straight or slightly curved as it passes downwards to merge with the right heart border. The left superior mediastinal border is ill-defined above the aortic arch. With increasing age, the aorta elongates. Elongation necessarily involves unfolding, because the aorta is fixed at the aortic valve and at the diaphragm. This unfolding results in the ascending aorta deviating to the right and the descending aorta to the left. In young children, the normal thymus is often clearly visualized. It may be very large and should not be mistaken for disease (Fig. 2.3).
Examine the Hilar Structures
The hila represent the pulmonary arteries and veins. Air within the major bronchi can be recognized, but the walls of the bronchi are not usually visible. The hilar lymph nodes in the normal patient are too small to recognize as discrete opacities. The left hilum is usually slightly higher in position than the right.
Examine the Lungs
The only structures that can be identified within normal lungs are the blood vessels, the interlobar fissures and the walls of certain larger bronchi seen end-on. The fissures can only be seen if they lie along the line of the x-ray beam; they are, after all, composed of just two layers of pleura. Usually, only the horizontal fissure is visible in the frontal projection, running from the right hilum to the sixth rib in the axilla. There is no equivalent to the horizontal fissure on the left. The oblique fissures are only visible on the lateral view. The fissures form the boundaries of the lobes, so knowing their position is essential for an appreciation of lobar anatomy (Fig. 2.4). In about 1% of people there is an extra fissure visible in the frontal view – the so-called azygos lobe fissure (Fig. 2.5).
Fig. 2.4 Position of the lobes and fissures. (a) The oblique (major) fissure is similar on the two sides. The oblique fissures are not visible on the frontal view; their position is indicated by dashed lines. (b) In the left lung the oblique fissure separates the upper lobe (UL) and lower lobe (LL). (c) In the right lung, there is an extra fissure – the horizontal (minor) fissure, which separates the upper lobe (UL) and middle lobe (ML). (The lingular segments of the upper lobe are analogous to the segments of the middle lobe.) T, trachea.
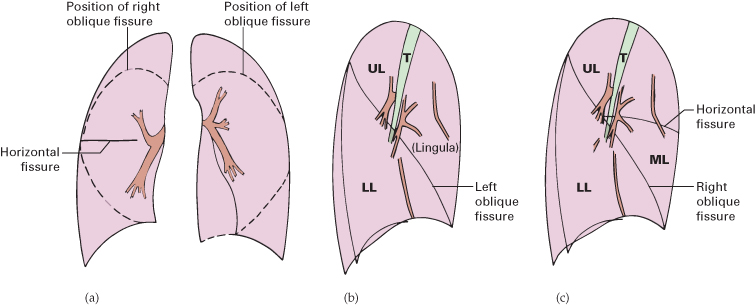
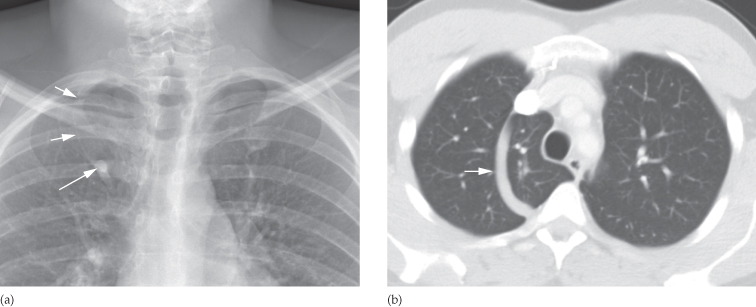
Fig. 2.5 The azygos lobe fissure. During normal intrauterine development the azygos vein migrates through the lung from the chest wall to lie within the mediastinum. (a) CXR in a patient with an azygos ‘lobe’, the vein (large arrow) fails to reach the tracheobronchial angle and, therefore, lies in the lower end of the azygos fissure (small arrows). (b) CT in the same patient. The azygos fissure can be clearly seen (small arrow). This variant is of no clinical significance.
Look for abnormal pulmonary opacities or translucencies. Do not mistake the pectoral muscles, breasts (see Fig. 2.1) or plaits of hair for pulmonary opacities. Skin lumps or the nipples may mimic pulmonary nodules. The nipples are usually in the fifth anterior rib space, but they are, in practice, rarely misdiagnosed because, in general, if one nipple is visible the other should also be seen.
A good method of finding subtle opacities on the frontal film is to compare one lung with the other, zone by zone. Detecting ill-defined opacities on the lateral view can be difficult.
Check the Integrity of the Ribs, Clavicles and Spine and Examine the Soft Tissues
The bones of the chest should be checked for fractures and metastases. Any rib notching should be noted as it may indicate coarctation of the aorta. In females, check that both breasts are present. Following mastectomy the breast opacity cannot be defined. The reduction in the soft tissue bulk leads to an increased transradiancy of that side of the chest, which should not be confused with pulmonary disease.
Assess the Technical Quality of the Film
Technical factors are important as incorrect exposure may hide disease, and faulty centring or projection may mimic pathology. The correctly exposed routine PA chest film is one in which the ribs and spine behind the heart can be identified but the lungs are not overexposed. Unless one can see through the heart, lower lobe lesions may be completely missed. A straight film is one where the medial ends of the clavicles are equidistant from the thoracic vertebrae.
Computed Tomography
Technique
A routine chest computed tomography (CT) examination consists of contiguous sections. Intravenous contrast medium is given in many cases, particularly when the purpose of the examination is to visualize the mediastinum, the hila or the pulmonary blood vessels. The images are usually viewed at both lung and mediastinal and bone window settings (Fig. 2.6) (see Fig. 1.2 for an explanation of CT windows and levels).
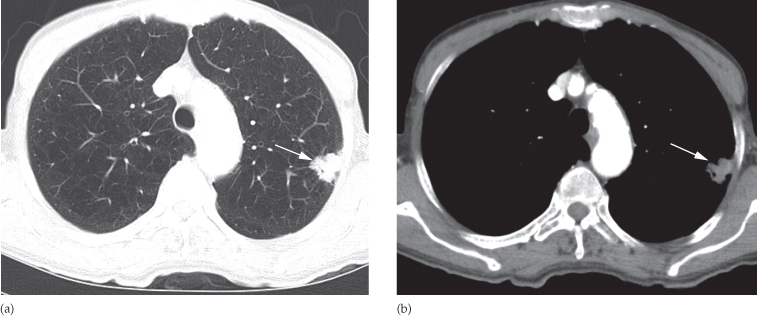
Fig. 2.6 Chest CT illustrating the different window centres (levels) used for the lungs and mediastinum. (a) Lung settings. A negative centre (minus 700 Hounsfield units [HU]) and a wide window width (1000 HU) shows the lungs to advantage, but there is no detail of mediastinal structures, the mediastinum being uniformly white. In this example, the lung vessels are the only identifiable opacities originating from within the lung. Note the peripheral left lung cancer (arrow). (b) Mediastinal settings. A centre close to average soft tissue density (40 HU) and a narrow window width (400 HU) shows the structures within the mediastinum clearly, but the lungs are blacked out. The lung cancer is arrowed.
Thin sections can be used to produce images with higher spatial resolution – so-called high resolution CT (HRCT). HRCT better demonstrates pulmonary parenchymal disease and bronchiectasis.
Indications
There are many indications for CT in chest disease, notably:
- Evaluating abnormalities on a CXR.
- Investigating causes of breathlessness:
- acute, e.g. ?pulmonary embolus
- chronic, e.g. interstitial lung disease.
- acute, e.g. ?pulmonary embolus
- Staging of cancer.
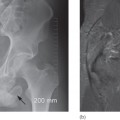
- Evaluation of vascular anatomy, e.g. thoracic aortic aneurysms/dissection (Fig. 2.7).
- Performing CT-guided biopsy of a lung/pleural/mediastinal mass.
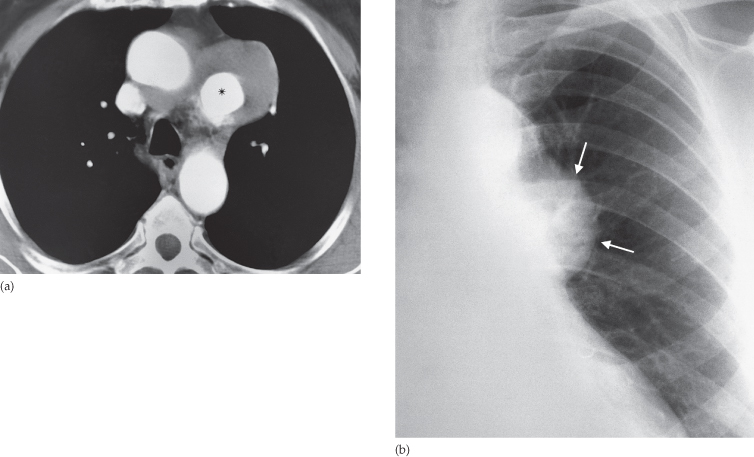
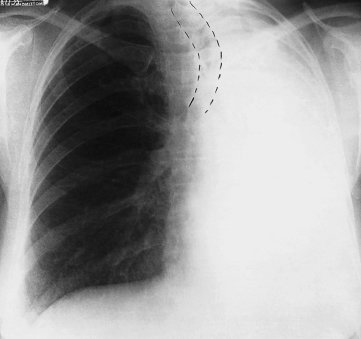
Fig. 2.7 Aortic aneurysm. (a) Example of the use of contrast-enhanced CT to diagnose an aortic aneurysm. The lumen of the aneurysm (*) enhances brightly. Much of the aneurysm is lined by clot. (b) The CXR shows a mass (arrows), but the precise diagnosis of aortic aneurysm cannot be made.
Normal Images
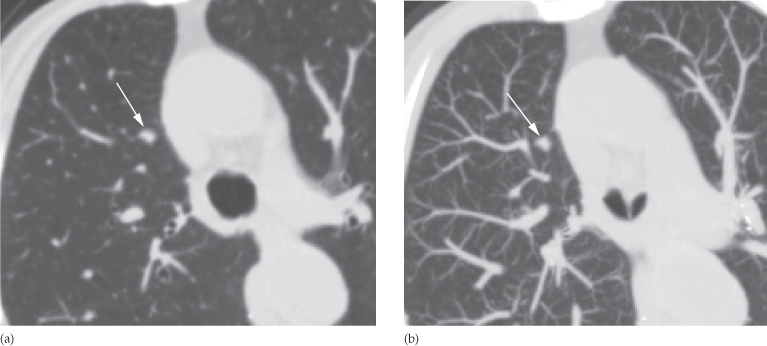
Just as on CXRs, the only structures seen on CT within the normal lungs are blood vessels, pleural fissures and the walls of bronchi. Vessels within the lung are recognized by their shape rather than by contrast opacification (see Fig. 2.6a) and are distinguished from small lung nodules by their branching morphology and continuity observed during scrolling through the images on the workstation. Any uncertainty is usually resolved by review in the sagittal or coronal reformat or with the use of thick maximum intensity projections (MIPs), which enhances the three-dimensional nature of the nodules and helps differentiate them from pulmonary bronchi and vessels (Fig. 2.8).
Fig. 2.8 Lung nodule (arrow) on (a) thin (0.6 mm) and (b) thick (11 mm) maximum intensity projection (MIP) images. On the thick MIP image, the nodule can clearly be identified separate from the adjacent branching vessels.
The fissures may be seen as a line, or their position may be recognizable only as a relatively avascular zone within the lung. The CT appearances of the normal mediastinum and hilar are discussed later in this chapter.
Magnetic Resonance Imaging
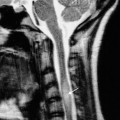
Magnetic resonance imaging (MRI) has only a very small role in the management of pulmonary, pleural or mediastinal disease, although it is playing an increasingly large part in the diagnosis of cardiac and aortic diseases. MRI can be useful in selected patients with lung cancers, particularly apical tumours, when the relevant questions cannot be answered by CT and MRI can show the intraspinal extent of mediastinal neural tumours.
Radionuclide Lung Scanning
There are two major types of radionuclide lung scan: perfusion and ventilation scans.
Perfusion scans use small particles, approximately 30 µm in diameter, labelled with technetium-99m (99mTc), injected intravenously. These particles become trapped in the pulmonary capillaries; the distribution of radioactivity, when imaged by a gamma camera, accurately reflects blood flow (Fig. 2.9a).
Fig. 2.9 (a)Normal radionuclide perfusion scan (posterior view) using 99mTc-labelled macroaggregates of albumin. (b) Normal radionuclide 81mKr ventilation scan (posterior view).
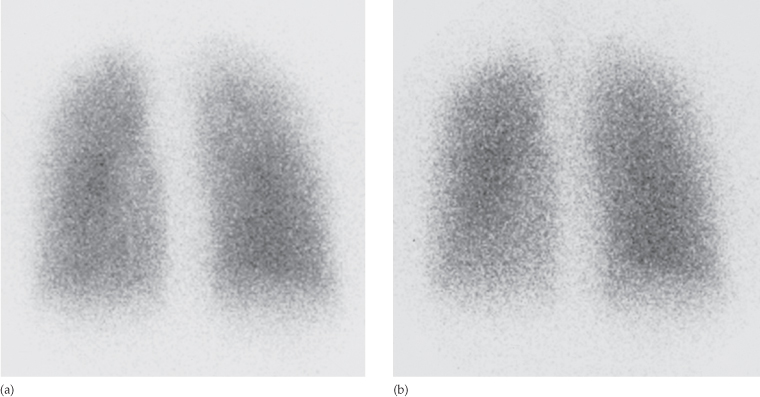
For ventilation scans, the patient inhales a radioactive gas such as xenon-133, xenon-127 or krypton-81m (81mKr) and the distribution of radioactive gas is imaged using a gamma camera (Fig. 2.9b).
The major indication for radionuclide lung scanning is to diagnose or exclude pulmonary embolism, but this indication has been superceded by CT pulmonary angiography.
Positron Emission Tomography
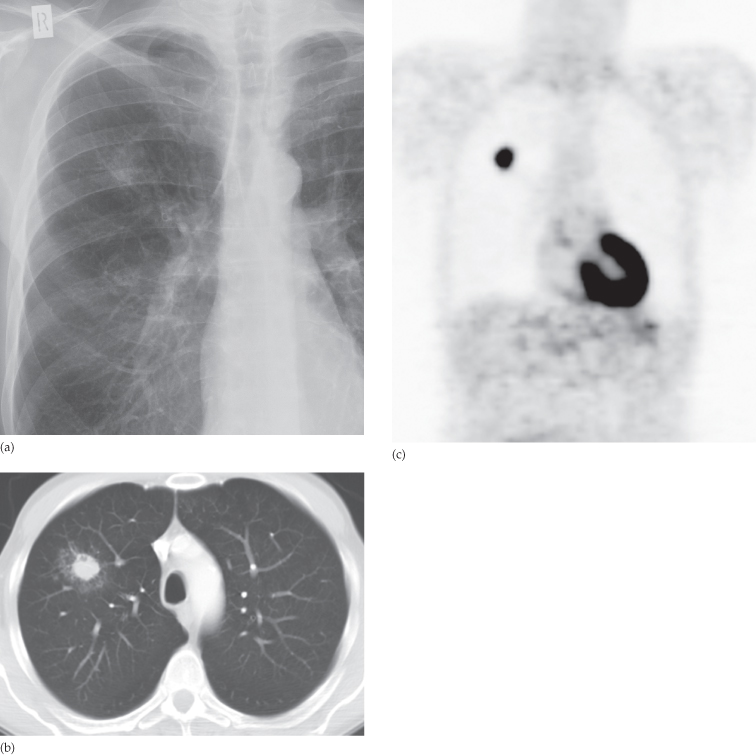
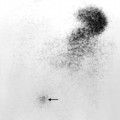
See Chapter 1 for a technical description of fluorodeoxyglucose positron emission tomography (FDG-PET)/CT. FDG is taken up by a number of tumours, notably primary lung cancers, metastases and active lymphomatous tissue. FDG-PET/CT (Fig. 2.10) is used to stage lung cancer or lymphoma and to diagnose recurrent lung cancer. It is also increasingly used to diagnose the malignant nature of a solitary pulmonary nodule as well as pleural disease. Unfortunately, inflammatory conditions also concentrate FDG, so the appearances are not entirely specific for neoplastic tissue.
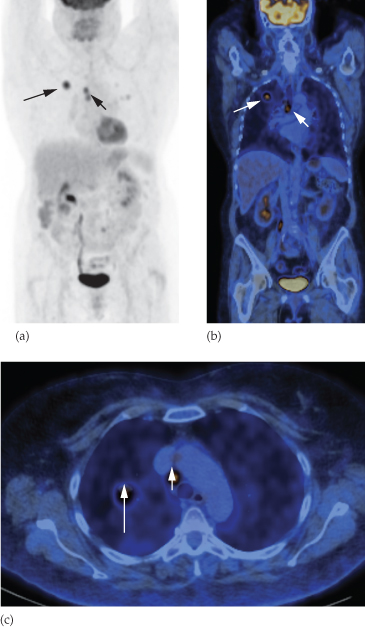
Fig. 2.10 FDG-PET scan of the chest and abdomen showing a focus of high activity in a lung cancer (large arrow) and mediastinal lymph node metastasis (small arrow). (a) Maximum intensity projection (MIP). (b) Coronal fused PET/CT. (c) Axial fused PET/CT. No other abnormality is seen on any of the images. High activity in the myocardium, kidneys and bladder is normal.
Ultrasound
The use of thoracic ultrasound, as opposed to cardiac ultrasound (see Chapter 3), is confined to processes in contact with the chest wall, notably pleural effusions, pleural masses and selected mediastinal masses. It can be very useful for guiding a needle to sample or drain loculated pleural fluid collections and for needle biopsy/aspiration cytology of masses in contact with the chest wall. As ultrasound is absorbed by air in the lung, ultrasound cannot be used to evaluate processes that lie deep to aerated lung tissue.
It is possible to pass a small ultrasound probe through an endoscope in either the oesophagus or bronchus to visualize structures immediately adjacent to the oesophagus, e.g. para-oesophageal nodes and the descending aorta (see Figs 2.70 and 2.71).
Diseases of the Chest with a Normal Chest Radiograph
Serious respiratory disease may exist in patients who have a normal chest radiograph. Sometimes it is only possible to detect abnormality by comparison with previous or later examinations, e.g. subtle pulmonary opacities from infection or pulmonary fibrosis. Chest disease with a normal chest radiograph occurs in the following situations.
Obstructive Airways Disease
Asthma and acute bronchiolitis may produce overinflation of the lungs, but in many cases the chest film is normal. Emphysema, when severe, gives rise to the signs described in the section ‘Diseases of the airways’ later in this chapter, but, when the disease is moderate, the chest radiograph may be normal or very nearly so. Uncomplicated acute or chronic bronchitis does not usually produce any radiological signs, so if a patient with chronic bronchitis has an abnormal film some other disease or a complication has developed, e.g. pneumonia or cor pulmonale. Many patients with productive cough due to bronchiectasis show no plain film abnormality.
Small Lesions
It is usually impossible to see solitary lung masses or consolidations of less than 1 cm in diameter. Even 2–3 cm lung cancers may be very difficult to identify on routine films if they are hidden by ribs or clavicles or if they lie behind the heart or diaphragm.
Endobronchial lesions, such as carcinoma, cannot be diagnosed on routine films unless they cause collapse/consolidation.
Pulmonary Emboli without Infarction
The chest radiograph is often normal even when life-threatening emboli are present.
Infections
Most patients with acute bacterial pneumonia present with recognizable consolidation, but in other infections, notably Pneumocystis carinii pneumonia, obvious pulmonary consolidation may only develop after the onset of symptoms. Patients with miliary tuberculosis may initially have a normal chest film.
Diffuse Pulmonary Fibrosis
Widespread pulmonary fibrosis may be responsible for breathlessness with substantial alteration in lung function tests before any clear-cut abnormalities are evident on chest radiographs.
Pleural Abnormality
Dry pleurisy does not produce any radiological findings and small amounts of pleural fluid may be impossible to recognize on standard chest films.
Mediastinal Masses
Plain chest radiography is very insensitive for the diagnosis of mediastinal masses, lymph node enlargement and mediastinal fluid collections.
Abnormal Chest Signs
When viewing an abnormal examination of the chest, be it a plain film, CT or MRI, the first questions to ask are ‘Where is the abnormality?’ and ‘How extensive is it?’. Only then can the question ‘What is it?’ be answered, because the differential diagnosis for pulmonary lesions is clearly quite different from that for mediastinal, pleural or chest wall disease.
The first step is to examine all available films. Usually, the location of a lesion will be obvious. If the abnormality is surrounded on all sides by aerated lung it must arise within the lung. Similarly, many masses are clearly within the mediastinum. However, when a lesion is in contact with the pleura or mediastinum it may be difficult to decide its origin.
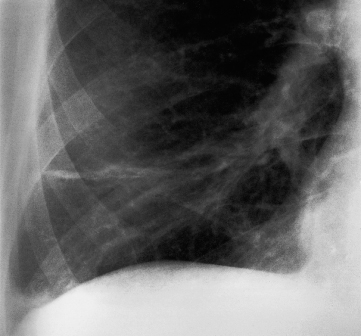
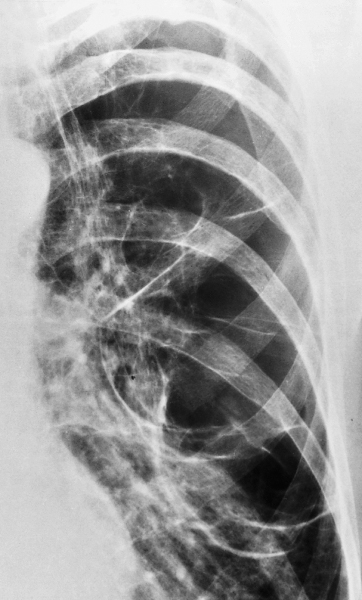
If the opacity has a broad base with smooth convex borders projecting into the lung and a well-defined outline it is likely to be pleural, extrapleural or mediastinal in origin (Fig. 2.11).
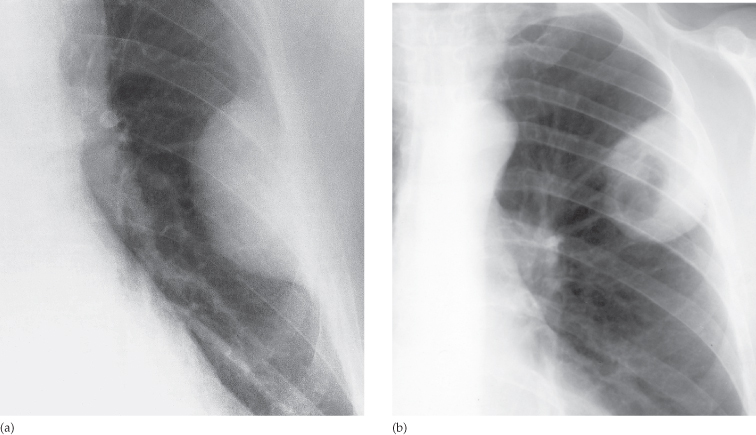
Fig. 2.11 (a) Extrapleural mass. The mass has a smooth convex border with a wide base on the chest wall (a myeloma lesion arising in a rib). This shape is quite different from a peripherally located pulmonary mass such as a primary carcinoma of the lung (b).
Silhouette Sign
The silhouette sign (Fig. 2.12) is an invaluable sign for localizing disease from on the CXR. The information on a CXR is largely dependent on the contrast between air in the lungs compared with the opacity of the heart, blood vessels, mediastinum and diaphragm. An intrathoracic lesion touching the heart, aorta or diaphragm obliterates the border of the structure in question. This sign is known as the silhouette sign and has two important applications:
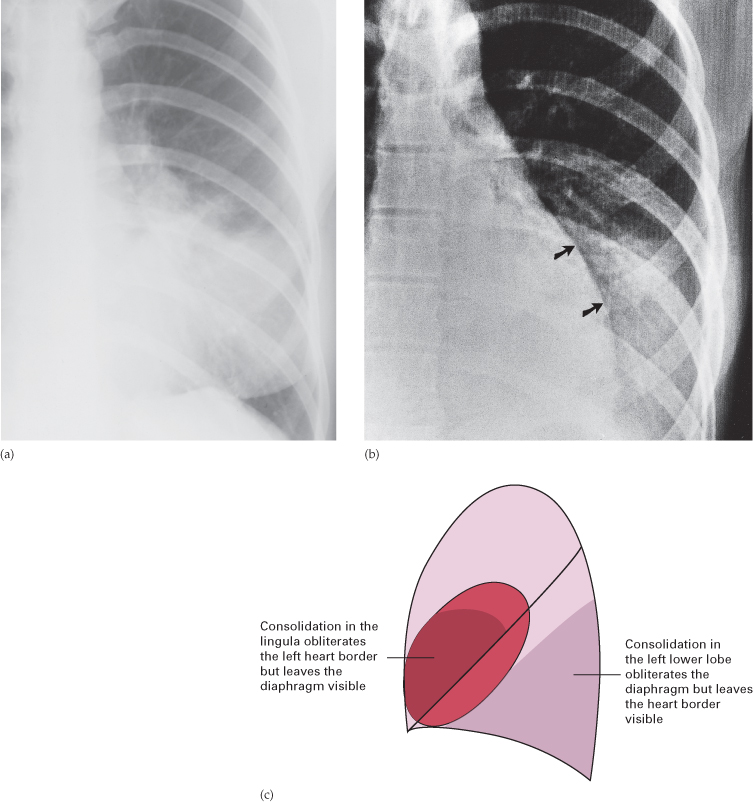
Fig. 2.12 The silhouette sign. (a) The left heart border is invisible because it is in contact with consolidation in the adjacent lingula. (b) The left heart border can be seen because the consolidation is in the left lower lobe and air in the lingula preserves the visibility of the cardiac silhouette (arrows). Note that now it is the diaphragm outline that is invisible. (c) A side view diagram of the lung explaining the relationship of the lingula and lower lobes to the heart and diaphragm.
Radiological Signs of Lung Disease
It is helpful to try and place any abnormal intrapulmonary opacities into one or more of the broad categories shown in Box 2.1.
- Air-space opacification
- Pulmonary collapse (atelectasis)
- Spherical/nodular opacities
- Linear opacities
- Widespread small opacities
Air-Space Opacification
Air-space opacification means the replacement of air in the alveoli by fluid or other materials (e.g. pus or blood). The fluid can be either an exudate (often called ‘consolidation’) or a transudate (pulmonary oedema – a topic discussed later in this chapter). The signs of consolidation are:
- An opacity with ill-defined borders (Fig. 2.13), except where the opacity is in contact with a fissure, in which case the opacity has a well-defined edge.
- An air bronchogram (Fig. 2.14). Normally, it is not possible to identify air in bronchi within normally aerated lung, because the walls of the normal bronchi are too thin and air-filled bronchi are surrounded by air in the alveoli. However, if the alveoli are filled with fluid, the air in the bronchi contrasts with the fluid in the adjacent lung. This sign is seen to great advantage on CT (Fig. 2.15).
- The silhouette sign, namely loss of visualization of the adjacent mediastinal or diaphragm outline (see above for an explanation of this sign).
Fig. 2.13 Air-space filling. In this case, the consolidation in the right upper lobe is due to pneumonia.
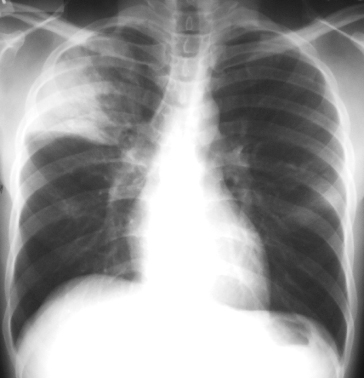
Fig. 2.14 The air bronchogram sign. An extensive air bronchogram is seen in this patient with pneumonia. The arrow points to a bronchus that is particularly well seen.
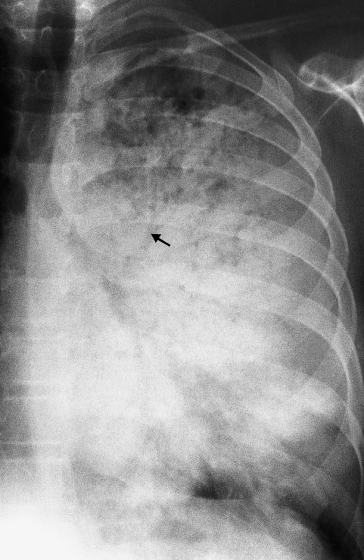
Fig. 2.15 The air bronchogram sign. CT showing an air bronchogram in an area of pulmonary consolidation from pneumonia.
Consolidation of a whole lobe, or the majority of a lobe, is virtually diagnostic of bacterial pneumonia. The diagnosis of lobar consolidation requires an appreciation of the radiological anatomy of the lobes (see Fig. 2.4). Lobar consolidation produces an opaque lobe, except for air bronchograms. Because of the silhouette sign, the boundary between the affected lung and the adjacent heart, mediastinum and diaphragm is invisible. Figure 2.16 shows an example of lobar consolidation.
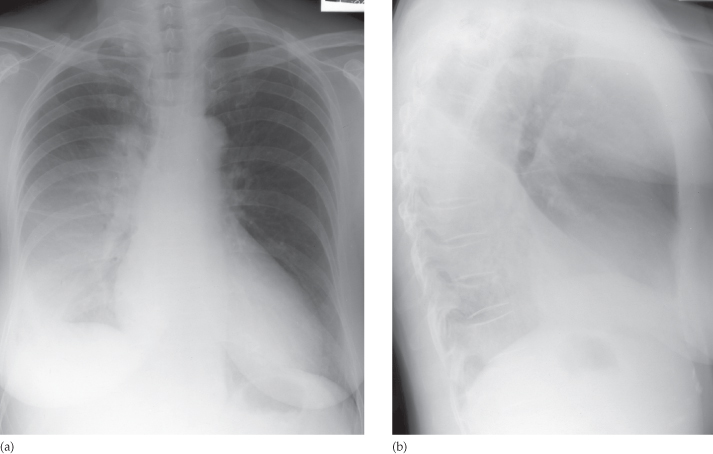
Fig. 2.16 Consolidation of the right lower lobe. Note the application of the silhouette sign here. (a) Posteroanterior view. The heart border and the medial half of the right hemidiaphragm are visible, whereas the lateral half is invisible. (b) On the lateral view, the oblique fissure forms a well-defined anterior boundary and the right hemidiaphragm is ill defined. Only the left hemidiaphragm is seen clearly.
Patchy consolidation, i.e. one or more patches of ill-defined opacitying (Fig. 2.17), is usually due to:
- pneumonia
- infarction
- contusion
- immunological disorders.
There is no reliable way of telling from either CXR or CT which of these possibilities is the cause. In most instances the clinical and laboratory findings point to one or other cause.
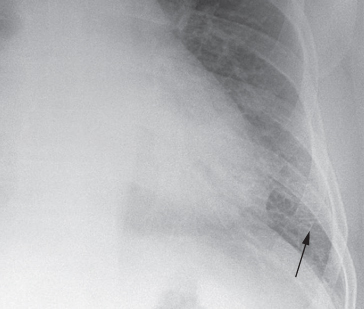
Cavitation (abscess formation) within consolidated areas in the lung may occur with many bacterial and fungal infections (Fig. 2.18). Abscess formation is only recognizable once there is communication with the bronchial tree, allowing the liquid centre of the abscess to be coughed up and replaced by air. The air is then seen as a transradiancy within the consolidation and an air–fluid level may be present (Fig. 2.19). Cavitation is occasionally seen in other forms of pulmonary consolidation, e.g. infarction and Wegener’s granulomatosis. CT is better and more sensitive than CXR for demonstrating cavitation (Fig. 2.20).
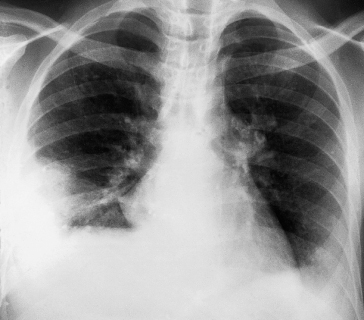
Fig. 2.18 Cavitation in staphylococcal pneumonia. (a) A round area of consolidation which, 7 days later (b) shows central translucency due to the development of cavitation.
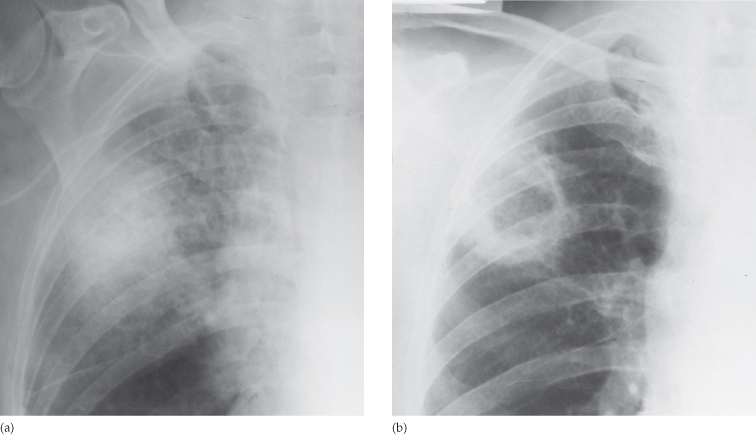
Fig. 2.19 Fluid level (arrowheads) in a lung abscess. Fluid levels are only visible if the chest radiograph is taken with a horizontal x-ray beam.
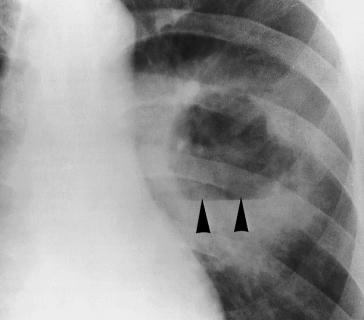
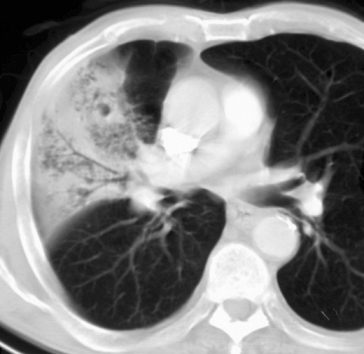
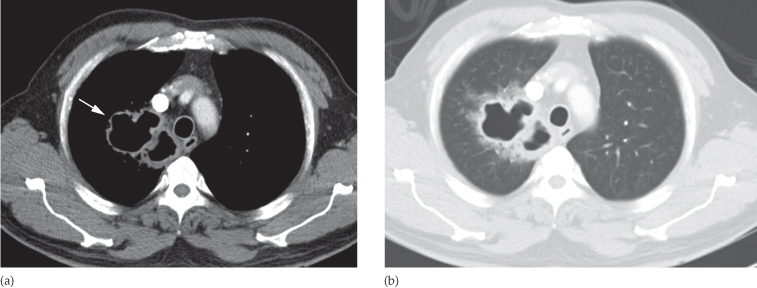
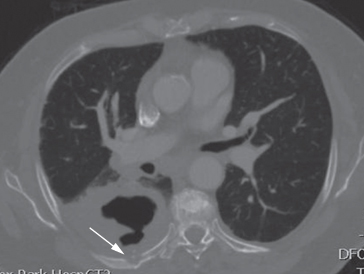
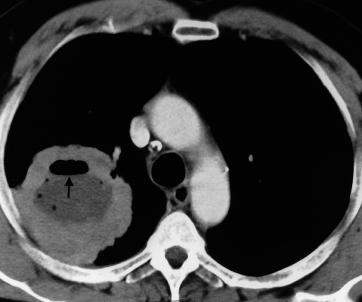
Fig. 2.20 Bacterial lung abscess shown by CT on (a) mediastinal and (b) lung windows. Note the thick-walled, air-filled cavity. The abscess is arrowed in (a).
Pulmonary Collapse (Atelectasis)
The common causes of pulmonary collapse (loss of volume of a lobe or lung) are:
- bronchial obstruction
- pneumothorax or pleural effusion
- linear atelectasis.
Collapse Caused by Bronchial Obstruction
Collapse caused by bronchial obstruction occurs because air cannot get into the lung in sufficient quantities to replace the air absorbed from the alveoli. The signs of lobar collapse are:
- Displacement of mediastinal structures.
- Opacification of the of the collapsed lobe
- The silhouette sign. This not only helps diagnose lobar collapse when the resulting opacity is difficult to appreciate, but also helps to decide which lobe is collapsed. Collapse of the anteriorly located lobes (upper and middle) obliterates portions of the mediastinal and heart outlines, whereas collapse of the lower lobes obscures the outline of the adjacent diaphragm and descending aorta.
The commoner causes of lobar collapse are:
- Bronchial wall lesions, usually primary carcinoma, but occasionally other bronchial tumours such as carcinoid tumours.
- Intraluminal occlusion, usually foreign body or retained mucus plugs, particularly in postoperative, asthmatic or unconscious patients, or in patients on artificial ventilation.
- Invasion or compression by an adjacent malignant tumour or rarely by enlarged lymph nodes.
When a lobe collapses, the unobstructed lobe(s) on the side of the collapse undergoes compensatory expansion. The mediastinum and diaphragm may move towards the collapsed lobe.
As lobar collapse is such an important and often difficult diagnosis to make on CXR, it is worth devoting time to study the appearance of collapse of each of the lobes (Figs 2.21–2.25). CT shows lobar collapse very well (Fig. 2.26), but is rarely necessary simply to diagnose a collapsed lobe.
Fig. 2.21 Collapse of the right lower lobe. (a) Posteroanterior and (b) lateral views. In this example the apical segment is relatively well aerated.
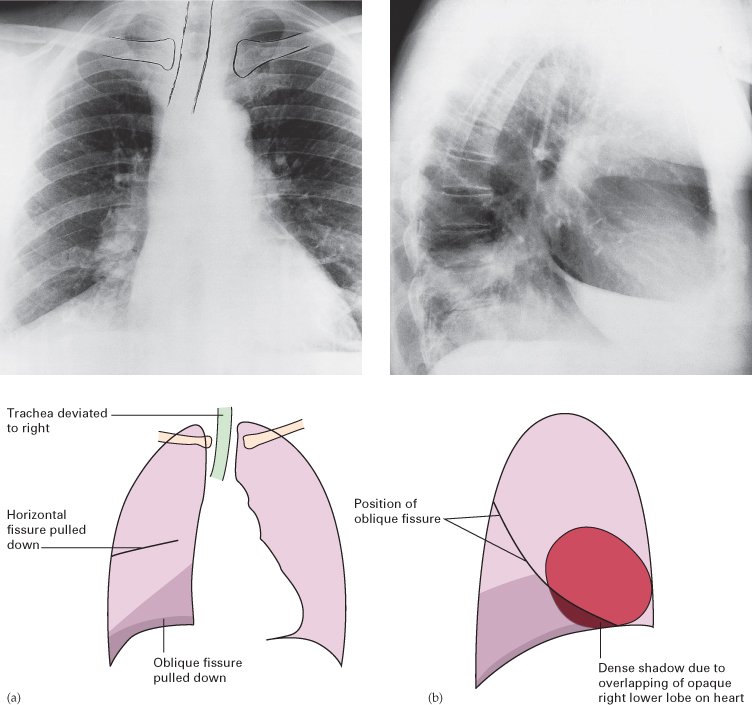
Fig. 2.22 Collapse of the middle lobe. (a) Posteroanterior and (b) lateral views. The collapsed lobe is most obvious on the lateral view (arrows). Note the silhouette sign obliterating the lower right heart border.
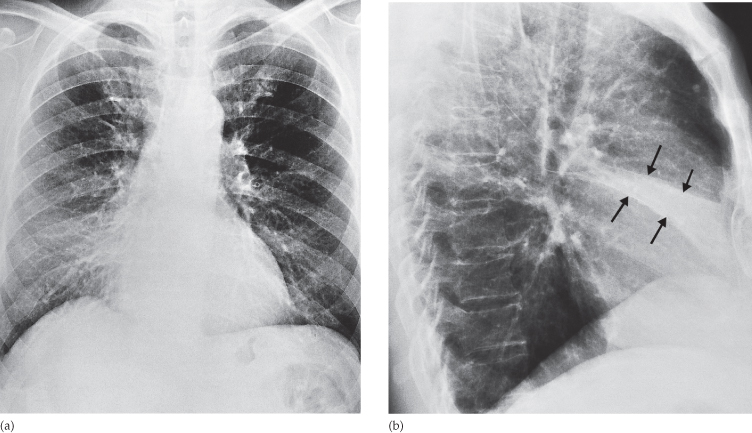
Fig. 2.23 Collapse of the right upper lobe. (a) Posteroanterior and (b) lateral views. Note the opacification in the right apex and elevated horizontal fissure.
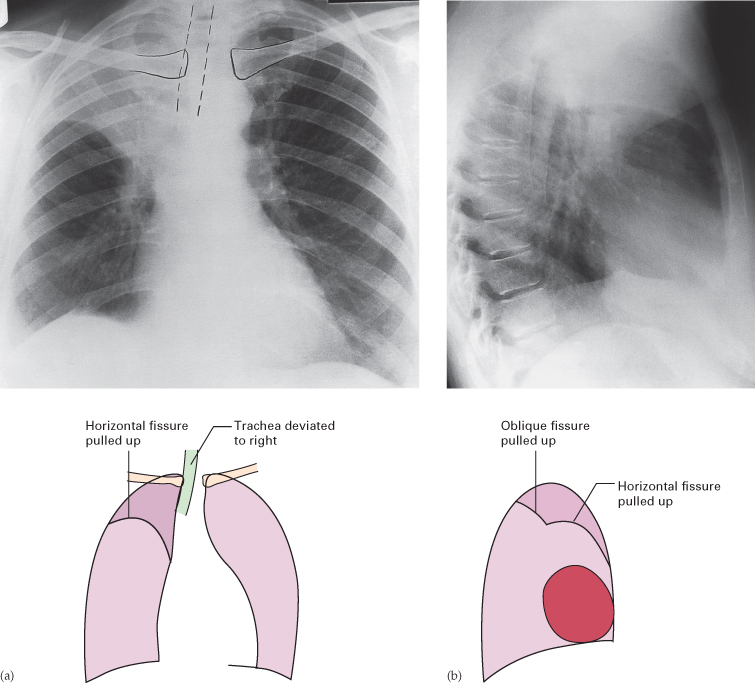
Fig. 2.24 Collapse of the left upper lobe. (a) Posteroanterior and (b) lateral views. Note the veil-like opacity of the left hemithorax on the PA view. The lower border of the collapsed lobe is ill defined. The upper two-thirds of the left mediastinal and heart borders are invisible, but the aortic knuckle and descending aorta are identifiable. The visible portions of the aorta have been drawn in for greater clarity. On the lateral view, the upper lobe can be seen collapsed anteriorly.
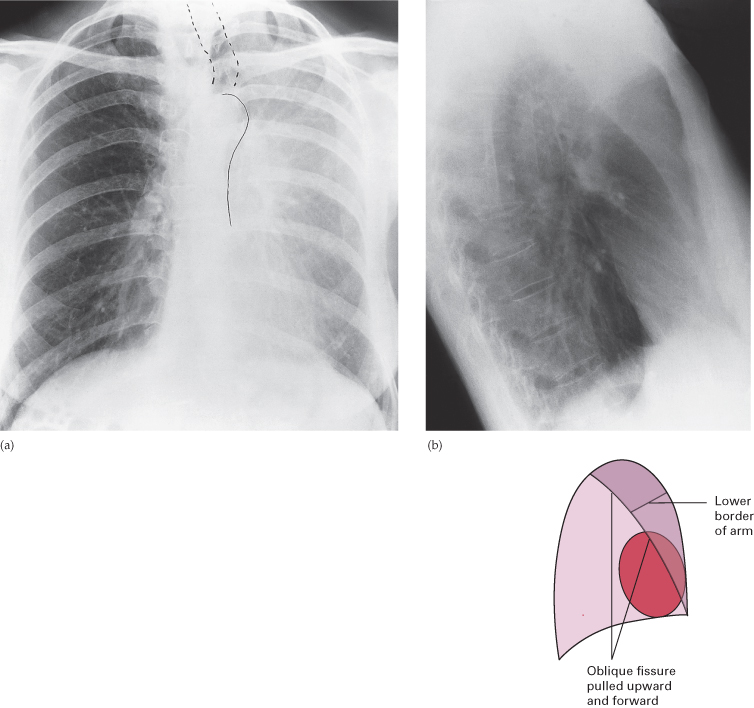
Fig. 2.25 Collapse of the left lower lobe. (a) Chest radiograph. The triangular opacity of the collapsed lobe is seen through the heart. Its lateral border is formed by the displaced oblique fissure (arrows). (b) CT. The collapsed lobe is seen lying posteriorly in the left thorax. The well-defined anterior margin is due to the displaced oblique fissure (arrows).
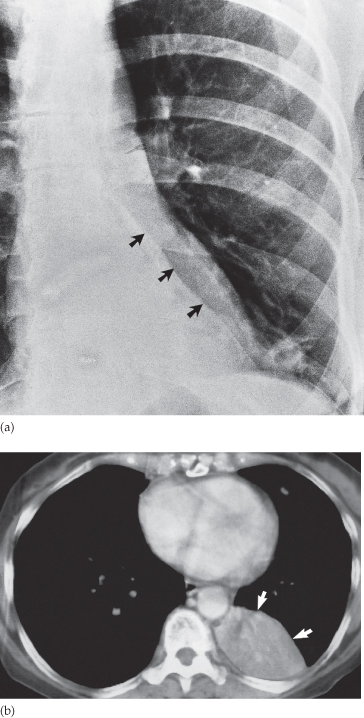
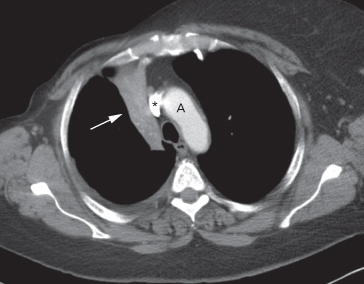
Fig. 2.26 CT of a severely collapsed right upper lobe. Note the smooth lateral border of the collapsed lobe formed by the displaced oblique (major) fissure (arrow). The scan shows compensatory overexpansion of the left upper lobe, which has crossed the midline anterior to the aortic arch (A). The superior vena cava is highlighted with an asterisk.
With collapse of the whole of one lung, the entire hemithorax is opaque and there is substantial mediastinal and tracheal shift (Fig. 2.27).
Collapse in Association with Pneumothorax or Pleural Effusion
The presence of air or fluid in the pleural cavity allows the lung to collapse. In pneumothorax, the diagnosis is obvious but if there is a large pleural effusion with underlying pulmonary collapse it may be difficult to diagnose the presence of the collapse on a CXR. This problem does not arise with CT where it is easy to recognize pulmonary collapse despite the presence of a pleural effusion (Fig. 2.28). If lobar collapse is identified, it can be difficult to tell whether the collapse is due to pleural fluid or whether both the collapse and the effusion are due to the same process, e.g. carcinoma of the bronchus.
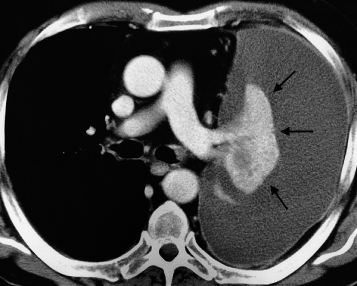
Fig. 2.28 CT showing pleural effusion and pulmonary collapse. The collapsed lobe (arrows) can be clearly seen beneath the large left pleural effusion.
Linear Atelectasis
Linear atelectasis is not secondary to bronchial obstruction, it is due to hypoventilation – the commonest cause of which is postoperative or post-traumatic pain. The result is a horizontally orientated band or disc of collapse (see Fig. 2.37).
Spherical Opacities (Lung Mass, Lung Nodule)
The diagnosis of a solitary spherical opacity in the lung (solitary pulmonary nodule) (Fig. 2.29) is a common problem (Box 2.2).
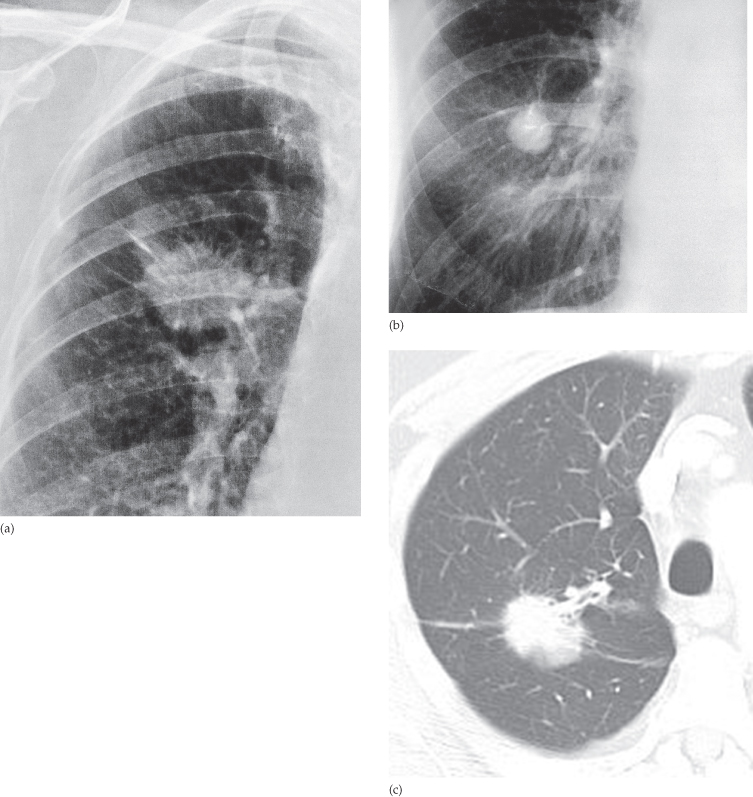
Fig. 2.29 Solitary spherical opacity. (a) The large size and the irregular infiltrating edge are important diagnostic features suggesting primary carcinoma of the lung. (b) The small size and relatively smooth border leads to a wider differential diagnosis. In this case the diagnosis was bronchial carcinoid. (c) Typical bronchial carcinoma on CT showing an infiltrating edge.
- Bronchial carcinoma/bronchial carcinoid (neuroendocrine tumour)
- Benign tumour of the lung, hamartoma being the most common
- Infective granuloma, tuberculoma being the most common in the UK and fungal granuloma the most frequent in the USA
- Metastasis
- Lung abscess
- Rarely, spherical (round) pneumonia
When a nodule is discovered in a patient who is over 50 and a smoker, bronchial carcinoma becomes the major consideration. In a patient less than 35 years old, primary carcinoma is highly unlikely. The patient’s symptoms may be helpful (e.g. obvious symptoms of chest infection in a patient with a lung abscess), but often there are no relevant symptoms even in patients with lung carcinoma. Metastasis is very unlikely in a patient without a known extrathoracic primary malignant tumour, but is an important consideration in those who are known to have such a tumour.
The possible diagnoses for a solitary pulmonary nodule listed in Box 2.2 include lesions that require very different forms of management. Hamartomas and granulomas are best left alone, whereas bronchial carcinoma, active tuberculosis and lung abscess require specific treatment. Further investigation with CT, FDG-PET/CT or biopsy may be necessary for further evaluation. Careful consideration of the following may help in making the diagnosis.
Comparison with Previous Films
Assessing the rate of growth of a spherical lesion in the lung is one of the most important factors in determining the correct management of the patient. Failure to grow over a period of 18 months or more is a strong pointer to either a benign tumour or an inactive granuloma. An enlarging mass is highly likely to be a bronchial carcinoma or a metastasis.
Calcification
The presence of calcification is the other vital observation, because substantial calcification virtually rules out the diagnosis of a malignant lesion. Calcification is a common finding in hamartomas, tuberculomas and fungal granulomas. In hamartomas it is often of the ‘popcorn’ type (Fig. 2.30). Calcification can be difficult to recognize on CXR. CT is of great value in detecting calcification in a solitary pulmonary nodule. If benign patterns of calcification are seen at CT (uniform calcification throughout the nodule, concentric ring calcification or popcorn calcifications) then carcinoma of the lung can be excluded from the differential diagnosis (Fig. 2.31).
Fig. 2.30 Calcification in a pulmonary hamartoma. The central flocculant (‘popcorn’) calcification is typical of that seen in hamartomas.
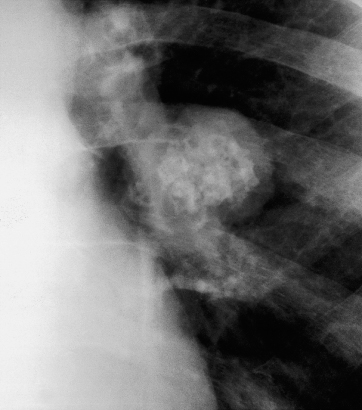
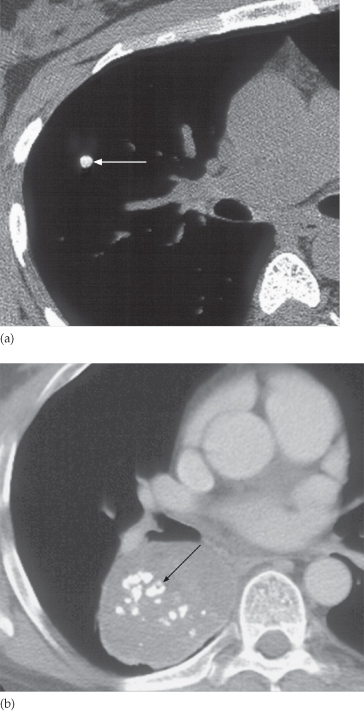
Fig. 2.31 Benign patterns of calcification. (a) A small calcified nodule (arrow). The calcific density of this fungal granuloma is clearly shown by CT. (b) ‘Popcorn’ calcification (arrow) in an unusually large hamartoma. The calcification was difficult to appreciate on CXR.
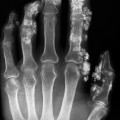
Involvement of the Adjacent Chest Wall
Destruction of the adjacent ribs is virtually diagnostic of invasion by carcinoma. Tumours of the lung apex are particularly liable to invade the chest wall and adjacent bones (Pancoast’s tumour). CT or a bone scan may be indicated to demonstrate this invasion (Fig. 2.32).
Fig. 2.32 CT showing a cavitating lung cancer with local invasion of the chest wall and erosion of the cortex of the adjacent rib (arrow).
Shape of the Opacity
Primary carcinomas are nearly always rounded with a lobulated, notched or infiltrating outline (Figs 2.29 and 2.33). Even if only one small portion of a round lesion has an irregular or lobular edge, the diagnosis of primary carcinoma should be seriously considered.

The shape may be obvious from plain films but CT can be used to confirm the rounded shape. Sometimes a lesion that is round and mass-like on CXR is shown to be linear or band-like on CT, in which case the diagnosis is likely to be a focal pulmonary scar of no significance.
Cavitation
If the centre of the mass undergoes necrosis, air is seen within the mass. An air–fluid level may be visible on an erect CXR. These features, which may be difficult to appreciate on plain films, are seen particularly well at CT.
Cavitation almost always indicates a significant lesion. It is very common in lung abscesses (see Figs 2.18–2.20), relatively common in primary carcinomas (Fig. 2.34) and occasionally seen with metastases (especially squamous cell carcinoma) and pulmonary infarcts. It does not occur in benign tumours or inactive tuberculomas.
Fig. 2.34 CT of cavitating primary carcinoma of the lung. The variable thickness of the cavity wall is a striking feature. The air–fluid level is also well seen (arrow).
The distinction between cavitating neoplasms and lung abscesses can be very difficult and sometimes impossible, particularly if the walls are smooth. If, however, either the inner or outer walls are irregular, the diagnosis of carcinoma is highly likely.
Size
A solitary mass over 4 cm in diameter that does not contain calcium is nearly always either a primary carcinoma, a lung abscess or, rarely, round pneumonia. Lung abscesses of this size, however, virtually always show cavitation and round pneumonias cause obvious clinical features of acute pneumonia.
Other Lesions
The rest of the film should be checked carefully after a single lung mass has been found. Metastases are the common cause of multiple nodules.
Role of Computed Tomography
The role of CT in patients with a solitary pulmonary nodule is primarily to characterize the nodule using the following steps.
Table 2.1 Recommendations for follow-up and management of nodules smaller than 8 mm detected incidentally at non-screening CT: Fleishner guidelines
| Nodule size | Low risk patients* | High risk patients* |
| ≤4 mm | No follow-up needed | Follow-up at 12 months. If no change, no further imaging needed |
| >4 to 6 mm | Follow-up at 12 months. If no change, no further imaging needed | Initial follow-up CT at 6–12 months and then at 18–24 months if no change |
| >6 to 8 mm | Initial follow-up CT at 6–12 months and then at 18–24 months if no change | Initial follow-up CT at 3–6 months and then at 9–12 and 24 months if no change |
| >8 mm | Follow-up CTs at around 3, 9 and 24 months. Dynamic contrast-enhanced CT, PET and/or biopsy | Same as for low risk patients |
* Low risk patients: minimal or absent history of smoking and of other known risk factors. High risk patients: history of smoking or of other known risk factors.
CT, computed tomography; PET, positron emission tomography.
Role of Positron Emission Tomography
Most lung cancers concentrate the PET agent FDG (Fig. 2.35) and all patients will have PET/CT as part of their staging if the CT suggests a curative treatment option. Only a small proportion, notably very small tumours (<1 cm) and slow-growing cancers, do not show increased uptake. A negative PET/CT scan is useful evidence in favour of a benign lesion or a very slow-growing tumour that can be reassessed after an interval. A positive PET scan does not necessarily give a diagnosis of lung cancer, as active inflammatory disease may also demonstrate increased uptake of FDG. The combination of a mass on CT that has characteristics suggestive of lung cancer and a positive FDG uptake provides good evidence of lung cancer.
Fig. 2.35 FDG-PET imaging in a solitary pulmonary nodule. (a) The chest radiograph shows an ill-defined nodule. (b) CT shows a rounded nodule with a spiculated outline. (c) The PET scan shows substantial activity in the nodule (the myocardial activity is normal). The diagnosis was bronchial carcinoma.
Role of Needle Biopsy
Transthoracic needle biopsy, using either fine needle aspiration or cutting needles to obtain samples, is usually performed under CT control. If the sample yields lung cancer cells, then the diagnosis is established. However, failure to find malignant cells does not exclude the diagnosis of a malignant neoplasm, so the technique should only be used when establishing the diagnosis of malignancy will affect the management plan, e.g. ensuring a diagnosis of lung cancer prior to radiotherapy, chemotherapy or in some cases prior to surgery.
Multiple Pulmonary Nodules
Multiple, well-defined spherical opacities in the lungs are virtually diagnostic of metastases (see Fig. 2.115). Occasionally, this pattern is seen with abscesses, other neoplasms or with granulomas caused by fungal infection, tuberculosis or collagen vascular disorders.
Line or Band-Like Opacities
All line opacities within the lungs, except fissures and the walls of the large central bronchi, are abnormal. Septal lines are by far the most important.
Septal Lines
The interlobular septa within the lung are connective tissue planes containing lymph vessels. They are normally invisible. Only greatly thickened septa can be seen on a CXR. Septal lines are much thinner than the pulmonary blood vessels. On CXRs, septal lines are seen as so-called Kerley B lines (Fig. 2.36), namely horizontal lines, never more than 2 cm in length, best seen at the periphery of the lung. Unlike the blood vessels they often reach the edge of the lung. On CT, even mild thickening of interlobular pulmonary septa can be readily identified. There are two important causes of thickened interlobular septa:
- interstitial pulmonary oedema
- lymphangitis carcinomatosa.
Fig. 2.36 Septal (Kerley B) lines in a patient with pulmonary oedema. The septal lines (arrow) are seen in the outer centimetre of lung where blood vessels are invisible or very difficult to identify.
Pleuropulmonary Scars and Linear (Discoid) Atelectasis
These two conditions are common causes of line or band-like opacities and are somewhat similar in appearance. Neither is of clinical significance. Linear scars are due to previous infection or infarction; they usually reach the pleura and are often associated with visible pleural thickening. Linear (discoid) atelectasis results in bands or discs of collapse (Fig. 2.37).
Emphysematous Bullae
Bullae may be bounded and traversed by thin line opacities. Bullae have few, if any, normal vessels within them, which makes the interpretation easy (Fig. 2.38).
Fig. 2.38 Linear opacities caused by walls of bullae (blebs). The bullae are air-spaces devoid of blood vessels.
Pleural Edge in a Pneumothorax
The pleural edge in a pneumothorax is seen as a line approximately parallel with the chest wall. No lung vessels can be seen beyond the pleural line. Once the line is spotted the diagnosis is rarely in doubt (see Fig. 2.53).
Widespread Small Pulmonary Opacities
Chest radiographs with widespread, small (2–3 mm) pulmonary opacities often present a diagnostic problem. With few exceptions it is only possible to give a differential diagnosis when faced with such a film. A final diagnosis can rarely be made without knowledge of the patient’s symptoms, signs and laboratory results.
Many descriptive terms have been applied to these opacities. In this book we will use three basic terms: (i) ‘nodular’, to signify discrete, small, round opacities (Fig. 2.39); (ii) ‘reticular’, to describe a net-like pattern of small lines; and (iii) ‘reticulonodular’, when both patterns are present (Fig. 2.40).
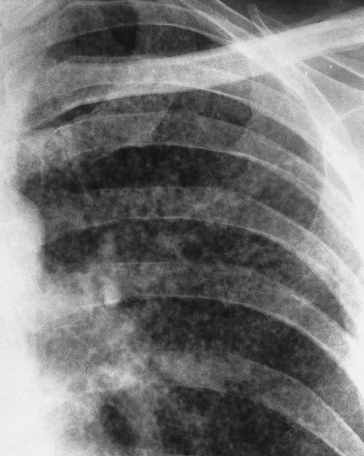
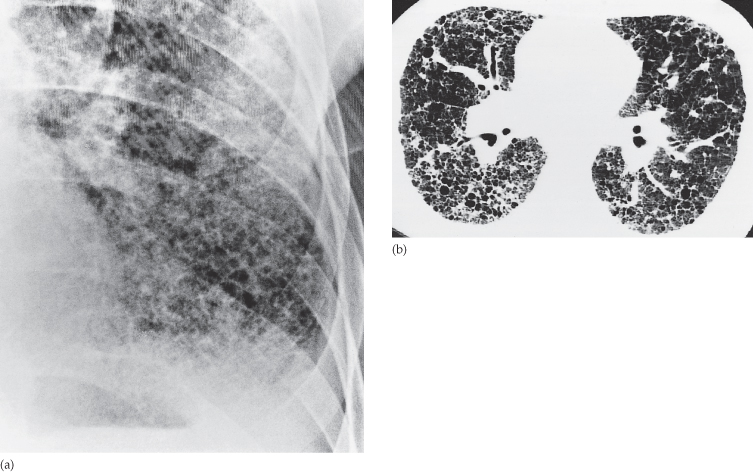
Fig. 2.40 (a) Reticulonodular opacitying in the lung of a patient with fibrosing alveolitis. (b) HRCT of a different patient with cryptogenic (idiopathic) fibrosing alveolitis showing the honeycomb pattern to advantage.
Related posts:
Stay updated, free articles. Join our Telegram channel

Full access? Get Clinical Tree


