Causes of cirrhosis
Hepatitis C (55 %)
Hepatitis B (16 %)
Alcohol (13 %)
Cryptogenic nonalcoholic fatty liver disease and nonalcoholic steatohepatitis (16 %)
Other causes: hereditary hemochromatosis, constrictive pericarditis, cryptogenic, aflatoxin exposure (in tropical countries)
Children: biliary atresia, hepatitis, alpha-1 antitrypsin deficiency
The clinical presentation of cirrhosis depends on the severity of disease, ranging from fatigue to jaundice and encephalopathy [2]. In severe cases of cirrhosis, portal hypertension develops resulting in splenomegaly, varices, and ascites. Gynecomastia and testicular atrophy can also be seen in males. Additional organ systems can be affected in the hepatorenal and hepatopulmonary syndromes [2]. Cirrhosis can be graded by severity, according to the Child-Pugh classification, a point system derived from various clinical factors, which suggests overall prognosis. The different clinical measures and their categories are included in Table 3.2 [3].
Table 3.2
Child-Pugh classification
Ascites | None, mild, moderate |
Encephalopathy | None, grades I–II, grades III–IV |
Albumin | >3.5, 2.8–3.5, <3.5 |
Bilirubin | <34, 34–50, >50 |
Prothrombin time | <1.7, 1.7–2.3, >2.3 |
Mortality in cirrhosis is related to complications, including progressive liver failure, complications related to portal hypertension (variceal hemorrhage or bacterial peritonitis from ascites), or hepatocellular carcinoma [2]. The prognosis of cirrhosis depends on the etiology and severity of disease. For example, the risk for HCC is 2.9 % in 10 years when the etiology of cirrhosis is autoimmune hepatitis versus 19.8 % in 13 years when the etiology is hepatitis B with a high viral burden [4]. Advanced cirrhosis is irreversible and can only be treated with liver transplantation, as discussed below.
Imaging Features of Cirrhosis
The best imaging modalities to evaluate cirrhosis are multiphasic CT or MRI [5]. CT is preferable in acutely ill patients with ascites, while MR is preferable for evaluation of hepatic nodules. Including a delayed post-contrast phase of 180–240 s in both modalities is critical, particularly in the evaluation of cirrhotic nodules [6]. Furthermore, hepatobiliary MR contrast agents aid in the detection of HCC [7]. The most common global imaging features of cirrhosis include nodular liver contour, widened fissures, and enlargement of the caudate lobe [2]. Additionally, secondary features related to portal hypertension are often present, including ascites, splenomegaly, and varices [2].
On a histological level, fibrosis in cirrhosis occurs when collagen and other extracellular matrix are deposited around the portal tracts [2]. Fibrosis results in a diffuse lacelike appearance with the appearance of thick bands or confluent “masses” (Fig. 3.1).
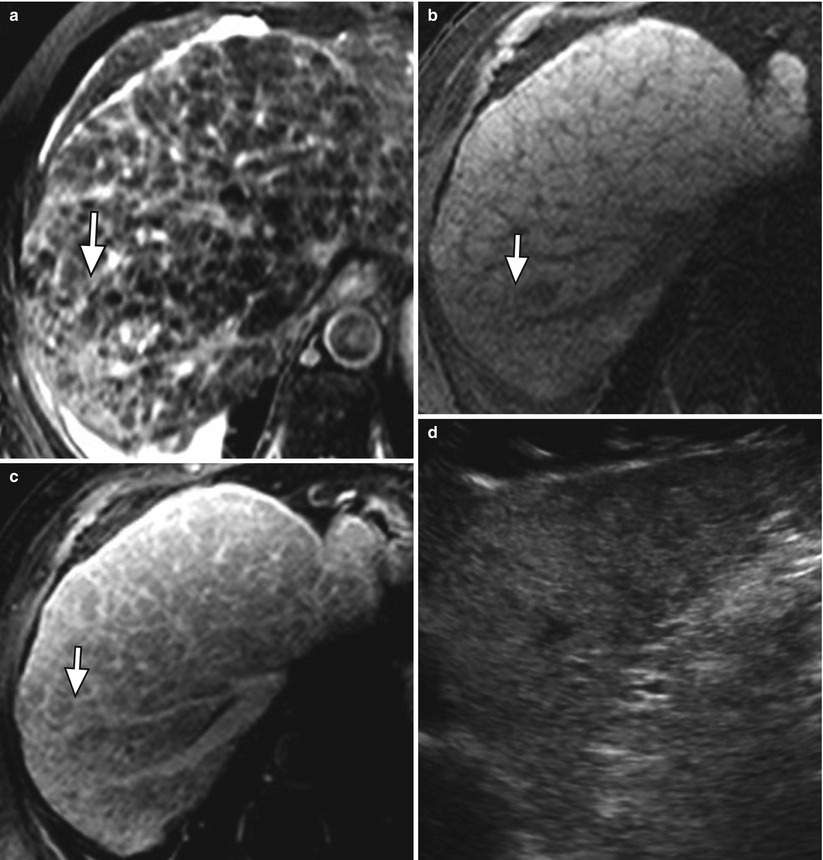
Fig. 3.1
Fibrosis in the cirrhotic liver. (a) Axial T2W fast spin-echo (FSE) image of the liver with fat suppression, (b) axial fat-suppressed T1W gradient-recalled echo (GRE) unenhanced and (c) contrast enhanced, and (d) ultrasound images of the liver showing a diffuse reticular network of fibrosis (arrow) characterized by moderately hyperintense signal on T2-weighted imaging (a), hypointense signal on T1-weighted imaging (b), delayed enhancement (c) and marked heterogeneity on ultrasound (d)
Fibrosis may result in a nodular hepatic contour (Fig. 3.2), which is not seen in all patients, and enhancement on delayed CT or MR images [2, 5].
Fibrosis also demonstrates decreased signal on T1WI and increased signal on T2WI [5]. On ultrasound, cirrhosis demonstrates a nodular liver contour and parenchyma with increased and coarsened liver echogenicity and decreased visualization of the deep liver.
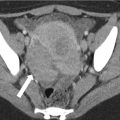
Fig. 3.2
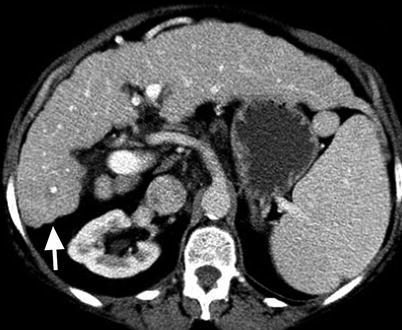
Morphology of the cirrhotic liver. Axial contrast-enhanced CT showing nodularity of the surface of the cirrhotic liver (arrow) due to fibrosis
Cirrhosis results in atrophy of the right hepatic lobe and medial segment (IV) of the left hepatic lobe and enlargement of the caudate lobe (segment I) and lateral segment of the left hepatic lobe (segments II and III) (Figs. 3.3 and 3.4) [5–8].
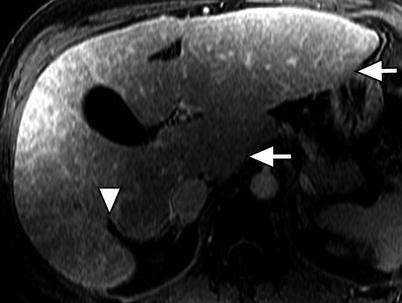
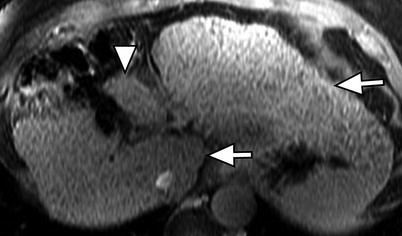
Fig. 3.3
Morphology of the cirrhotic liver. Axial contrast-enhanced fat-suppressed T1W gradient-recalled echo (GRE) image of the liver showing the posterior hepatic notch sign (arrowhead) due to hypertrophy of the caudate lobe (arrow) and atrophy of the posterior segment of the right lobe. Note the hypertrophied lateral segment of the left lobe (arrow)
Fig. 3.4
Morphology of the cirrhotic liver. Axial contrast-enhanced fat-suppressed T1W GRE image of the cirrhotic liver showing marked atrophy of the medial segment of the left lobe (arrowhead). Note the hypertrophied of the caudate lobe and lateral segment of the left lobe (arrows)
These changes, which result in widened fissures between segments and lobes, are related to differences in portal venous circulation [5–8]. Changes in the right hepatic lobe are a result of a long, tortuous intrahepatic course of the right portal vein. Although the left hepatic vein is protected by the falciform ligament, the medial segment of the left hepatic lobe atrophies because of a helical portal venous flow pattern away from this segment (Fig. 3.4) [5–8]. The remaining segments hypertrophy, as their blood supplies remain intact [8]. Cirrhosis may also demonstrate fatty changes, represented by geographic regions of low attention on CT or signal loss on opposed-phase versus in-phase gradient-echo MR imaging (Fig. 3.5) [5–8]. Important differential considerations for cirrhosis are listed in Table 3.3 [5–8].
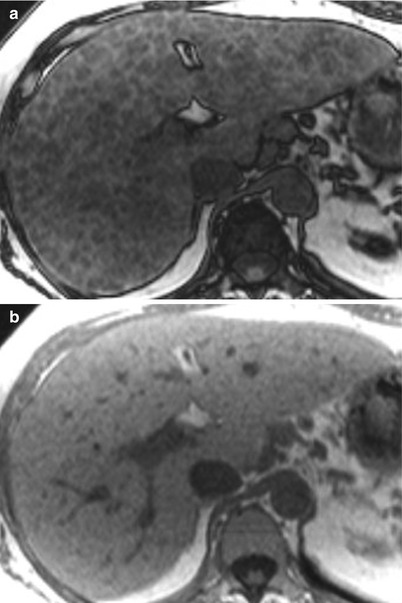
Table 3.3
Differential diagnoses of cirrhosis
1. Treated liver metastases or lymphoma | Simulates nodules, fibrosis, and volume loss of cirrhosis |
2. Budd-Chiari syndrome | Large regenerative nodules which are persistently hypervascular and mimic HCC |
Chronic phase | Central hypertrophy, peripheral atrophy, no bridging fibrosis |
3. Hepatic sarcoidosis | Hypodense nodules and lymphadenopathy |
Look for thoracic findings | |
4. Primary portal vein thrombosis | Look for cavernous transformation of the portal vein; infarction and ischemia in other organs |
5. Nodular regenerative hyperplasia | Lacks fibrosis, can cause portal hypertension |
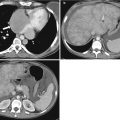
Fig. 3.5
Steatosis in the cirrhotic liver. (a) Axial T1-weighted opposed-phase (OP, echo time (TE): 2.2 msec) and (b) in-phase (IP, TE: 4.5 msec) GRE showing signal loss throughout the liver on OP (a) versus IP (b) due to fatty changes
Portal Hypertension [9–11]
Progressive deposition of extracellular matrix results in vascular derangement, which occurs when fenestrations in sinusoids are occluded, converting sinusoids into capillaries, resulting in arterioportal or portal venous shunts. Sclerosis and thrombosis of portal tracts result in increased resistance to portal venous inflow resulting in portal hypertension. Imaging features of portal hypertension include splenomegaly, gastroesophageal varices, and caput medusae [9–11] (Fig. 3.6).
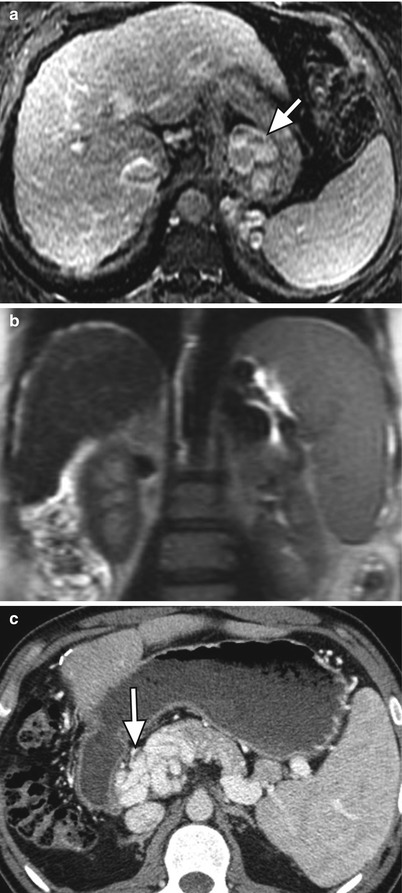
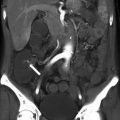
Fig. 3.6
Manifestations of portal hypertension in two patients. (a) Axial contrast-enhanced fat-suppressed T1W GRE, (b) coronal T2-weighted single shot fast spin-echo (SSFSE), and (c) contrast-enhanced CT images of the abdomen showing large gastroesophageal portosystemic collateral vessels (arrow) in (a), splenomegaly in (b), and cavernous transformation of the portal vein (arrows) in (c)
Several imaging features of portal hypertension are better demonstrated on ultrasound including increased pulsatility of portal venous Doppler tracings and dilated hepatic and splenic arteries with increased flow [2, 10, 11]. Additionally, color Doppler images can be used to determine portal venous patency and direction of flow. Normal portal venous flow is hepatopetal (towards the liver), while severe portal hypertension can result in hepatofugal (away from the liver) flow [2, 10, 11].
Development of HCC
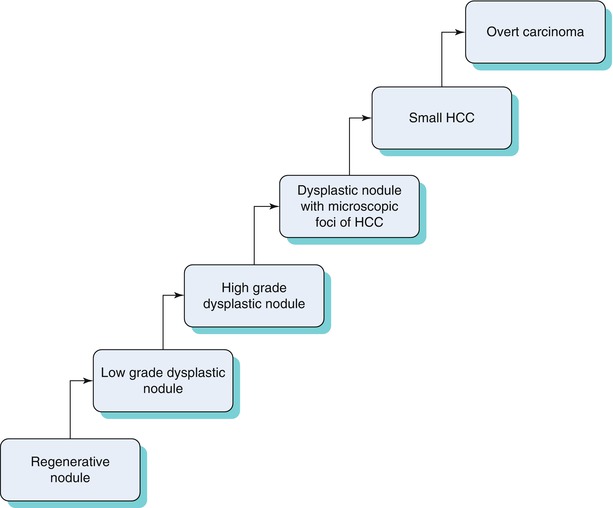
In the cirrhotic liver, HCC can occur de novo or as a multistep progression related to changes in blood supply [12], as seen in the Algorithm 3.1 [12, 13] below.
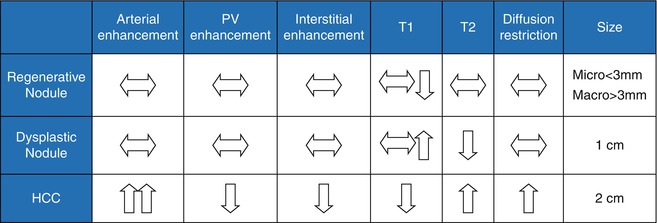
Because patients with high-grade dysplastic nodules are at a high risk for HCC, it is important to distinguish between different stages of this progression from an imaging standpoint. An algorithmic approach can be used to distinguish between these entities (Table 3.4) with common MRI findings.
Algorithm 3.1 Progression from regenerative nodule to HCC
Table 3.4
Typical imaging features of regenerating nodules, dysplastic nodules, and HCC
Regenerative Nodules
Regenerative nodules, or cirrhotic nodules, are present in all cirrhotic livers and are defined as a hepatocellular nodules containing one or more portal tracts located in a cirrhotic liver [14]. These nodules are surrounded by fibrous septa and classified on the basis of size: micronodular (<3 mm), macronodular (>3 mm), and mixed type [14, 15]. Micronodules are often related to alcoholism, while macronodules are often related to viral hepatitis, though these are not definite associations [15]. However, the margin of the liver configuration usually corresponds to the size of the underlying nodules: margins that are smooth or deformed by multiple small nodules result in micronodular cirrhosis versus a coarsely nodular margin in macronodular cirrhosis. A lobulated margin resulting from both subsegmental atrophy and hypertrophy is seen more frequently in biliary cirrhosis [15, 16].
The blood supply to regenerative nodules remains from the portal vein with minimal contribution from the hepatic artery [17], usually resulting in no arterial enhancement; rarely, minimal arterial-phase enhancement has been described and can be mistaken for HCC [18, 19].
Regenerative nodules are distinct on MRI because they consist of normal hepatocytes (usually isointense on T1WI and T2WI) surrounded by fibrous stroma, which is usually represented by a bridging band of increased T2 signal [20]. Less commonly, regenerative nodules are hyperintense on T1WI, possibly because of lipid, protein, or copper deposition [20, 21]. Some regenerative nodules contain iron and are called siderotic nodules. Siderotic regenerative nodules are hyperdense on noncontrast CT, related to the paramagnetic effect of iron within nodules, and isodense on contrast-enhanced CT. On MRI, these nodules are hypointense on both T1WI and T2WI (Fig. 3.7), related to susceptibility effects [22–24]. They are also markedly hypointense on T2GRE and FLASH images.
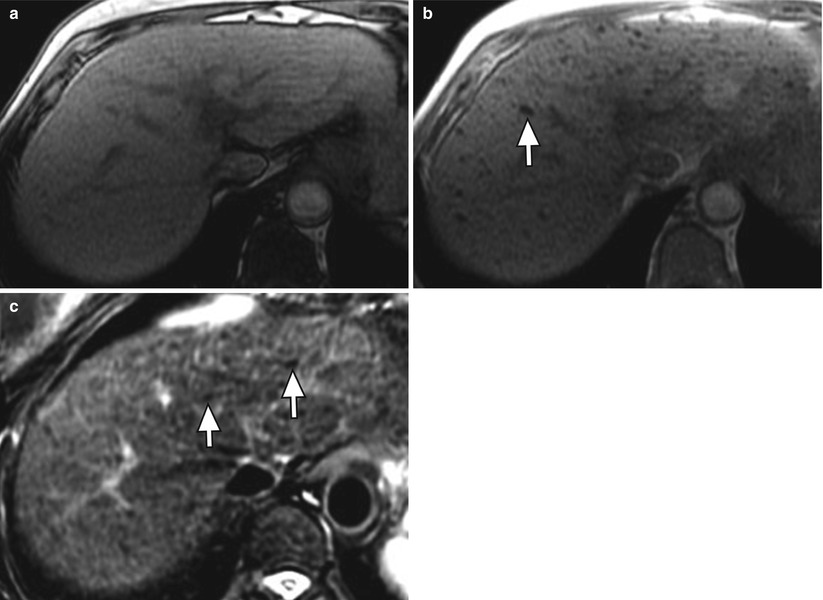
Fig. 3.7
Siderotic nodules (arrows) in the cirrhotic liver on axial (a) T1W opposed-phase GRE (OP, echo time: 2.3 msec), (b) T1W in-phase GRE (IP, echo time 4.5 msec), and (c) T2W FSE with fat suppression. Note the signal loss on in the nodules (arrow) the longer TE IP image relative to OP, and the low signal of the nodules on T2-weighted imaging due to susceptibility
Dysplastic Nodules
Dysplastic nodules, which occur in approximately 20 % of cirrhotic livers [25], are defined as clusters of histologically atypical hepatocytes (low or high grade) measuring at least 1 cm without meeting criteria for malignancy [14, 26]. Ninety-five percent of dysplastic nodules are less than 2 cm. Low-grade dysplastic nodules demonstrate minimal atypia and are not premalignant. High-grade dysplastic nodules demonstrate moderate atypia and are premalignant with development of HCC in as little as 4 months [27, 28].
Dysplastic nodules demonstrate a more variable appearance than regenerative nodules. Classically, dysplastic nodules can be hyperintense on T1WI and hypointense on T2WI (Fig. 3.8), compared to HCC which is usually isointense or hyperintense on T2WI [29]. Dysplastic nodules may demonstrate a similar appearance to regenerative nodules, demonstrating hypointense signal on T1WI and T2WI. Some dysplastic nodules demonstrate increased signal on T1WI when they retain copper. Siderotic dysplastic nodules, which have not been associated with HCC, are again hypointense on T1WI and T2WI and cannot be distinguished from siderotic regenerative nodules [20, 21]. Melanotic and hemorrhagic metastases may overlap in appearance with dysplastic nodules given hyperintensity on T1WI; however, metastases rarely invade a cirrhotic liver [29].
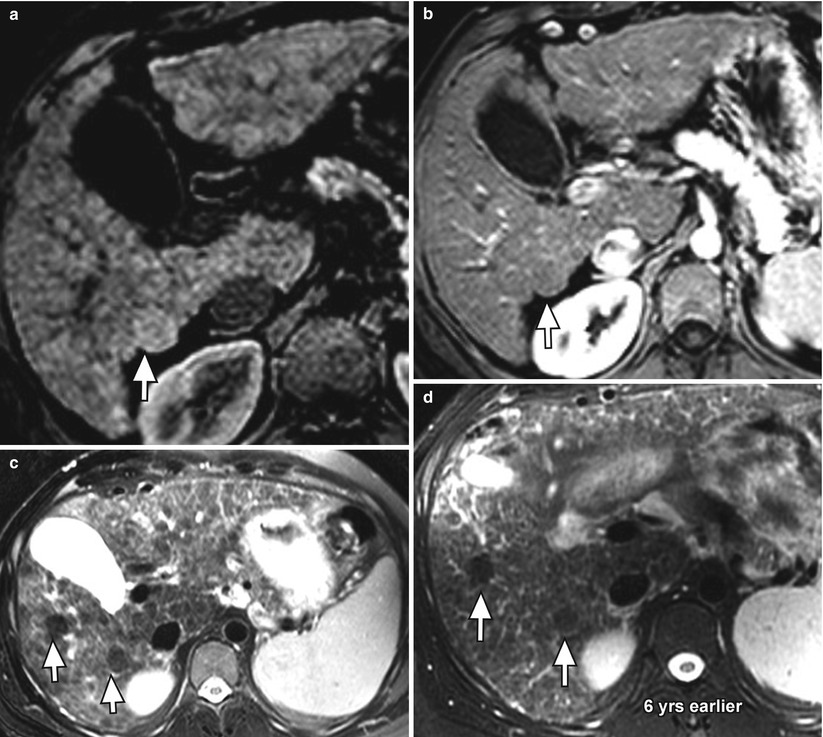
Fig. 3.8
Presumed macroregenerative or dysplastic nodules (arrows) in the cirrhotic liver on axial fat-suppressed T1W gradient-recalled echo (GRE) (a) unenhanced and (b) arterial-phase contrast-enhanced, and (c) fat-suppressed T2W FSE images. Note the slightly higher signal intensity of the nodule relative to the liver parenchyma on T1-weighted imaging, low signal intensity on T2W imaging, and lack of arterial enhancement. There is a second similar nodule on (c) the T2W image (arrow). Both nodules have been stable for 6 years (d)
Low-grade dysplastic nodules maintain their normal portal venous blood supply resulting in an isointense appearance on arterial-phase images [30–33]. However, high-grade dysplastic nodules receive increasing blood supply from the hepatic artery, sometimes resulting in arterial enhancement and overlapping imaging characteristics with HCC [30–33]. Furthermore, both regenerative and dysplastic nodules can infarct, resulting in increased T2WI signal and confusion with HCC. It should be noted that both low- and high-grade dysplastic nodules may resolve on follow-up and only a very small percentage progress to HCC [34].
Dysplastic Nodules with a Focus of HCC
Distinguishing between dysplastic nodules and small HCCs is critically important because early detection may result in a more effective treatment when the tumor is small [35]. A dysplastic nodule with a central focus of HCC is often described as a “nodule within nodule” appearance with a central focus of increased signal within a T2 hypointense nodule [36]. The central focus of HCC may also enhance on arterial-phase images. Though the HCC nodule can have a varied appearance on T1WI (iso-, hypo-, or hyperintense), it will demonstrate increased signal on T2WI and will enhance on post-contrast images [37].
Hepatocellular Carcinoma
HCC is the fifth most common tumor and third most common cause of cancer-related death worldwide [38]. Incidence and mortality rates are increasing in the United States largely attributed to hepatitis C [39, 40]. Eighty percent of cases of HCC develop in the cirrhotic liver [41], though 30 % of patients with chronic hepatitis B develop HCC without cirrhosis [42, 43]. Hepatitis C is associated with the highest incidence of HCC as compared to hereditary hemochromatosis, hepatitis B, and alcoholic and biliary cirrhosis (in decreasing order) [44]. It has been suggested that cryptogenic cirrhosis represents a more severe form of nonalcoholic fatty liver disease, which can then lead to fibrosis, cirrhosis, and, ultimately, HCC [45].
Curative therapies for HCC include liver transplantation, resection, and percutaneous ablation with a 5-year survival range of 40–75 % [46]. Approximately 30 % of patients are eligible for such intervention, thereby establishing the importance of detecting disease early in its course by screening exams in patients with cirrhosis. Though alpha-fetoprotein (AFP) and ultrasound have a sensitivity of only 50–60 %, screening for them has been proven to reduce mortality [47, 48]. When abnormal results are obtained at surveillance, contrast-enhanced MRI and CT are the best imaging techniques currently available with sensitivities of 81 % and 68 %, respectively [49]. A major challenge in imaging diagnosis is the detection of small tumors and the management of small hypervascular nodules (Table 3.5) [50].
Table 3.5
Common hypervascular lesions mimicking HCC
Common hypervascular lesions mimicking HCC |
|---|
1. Enhancing dysplastic nodule |
2. Hemangioma |
3. Arterioportal shunt |
4. Aberrant vessels |
5. Confluent fibrosis |
General Imaging Features of HCC
HCC is most often hypointense on T1WI [51]. Occasional hyperintense foci may be related to fat, copper, protein, or blood secondary to intralesional hemorrhage. On T2WI, HCC is usually hyperintense, though well-differentiated lesions may be isointense. Small HCC may be only mildly hyperintense on T2WI. Most HCC, despite its size, will show intense arterial contrast enhancement [52].
Large HCC may demonstrate a mosaic pattern created by confluent small nodules separated by thin septa and intratumoral necrosis [51–53]. This mosaic pattern is most apparent on T2WI and arterial-phase images, which demonstrate variable, heterogeneous signal intensity [53]. Additional characteristics of large HCC include extracapsular extension, vascular invasion, and extrahepatic dissemination to lymph nodes or distantly [54].
Given the significant morbidity and mortality related to HCC, early detection and screening is of critical importance. Advancements in imaging technology have played an important role in this service, such that pretreatment biopsy is no longer required when appropriate imaging demonstrates the typical features of HCC [55]. Therefore, incorrect diagnosis can significantly change management in that early disease may not be detected until advanced stages, or false-positive diagnoses may lead to unnecessary surgery or treatment.
In an effort to increase clarity and detail in reports and consequently improve patient care, structured reporting is recommended under the LI-RADS (Liver Imaging-Reporting and Data System), a consensus ACR-supported initiative analogous to the BI-RADS in breast imaging [56]. LI-RADS was created to reduce variability in lesion interpretation, improve communication, facilitate clinical therapeutic decisions, reduce omission of pertinent information, and facilitate the monitoring of outcomes [56]. It should be noted that LI-RADS is constantly updated, and the most recent version is v2013.1.
LI-RADS: Overview
The goal of LI-RADS is to assign imaging characteristics to one of five categories according to imaging concern for HCC which then drives management recommendations (Table 3.6) [56].
Category | Description | Management |
|---|---|---|
LR-1 | Definitely benign | Routine surveillance |
LR-2 | Probably benign | Routine surveillance |
LR-3 | Intermediate probability of HCC | Variable (see text) |
LR-4 | Probably HCC, but not 100 % certain | Close follow-up, additional imaging, biopsy, or treatment |
LR-4A | <20 mm | |
LR-4B | >20 mm | |
LR-5 (equivalent to OPTN-5) | Definitely HCC (must be >10 mm) | Treatment without biopsy. |
LR-5A | 10–19 mm | Radiologic T-staging |
LR-5B | >20 mm | |
LR-5V | Venous invasion | Radiologic T-stage 4b |
LR-5 treated | Locoregional tx only | Close follow-up to assess treatment response. Mayrequire retreatment for persistent/recurrent tumor |
OM | Other malignancies which may occur in cirrhosis:metastases, lymphoma, cholangiocarcinoma, PTLD | Close follow-up, additional imaging, biopsy,or treatment |
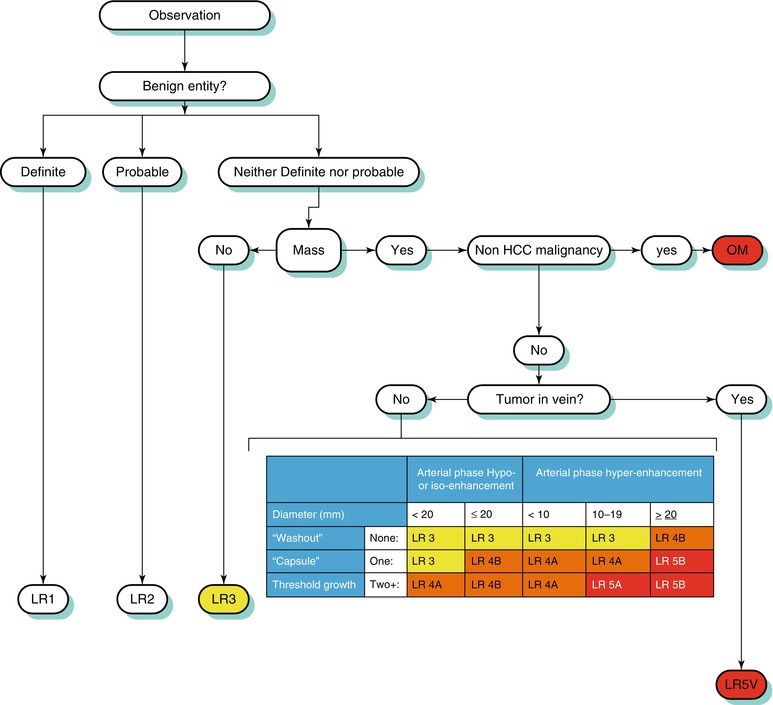
Classification within this system is dependent on various imaging features which increase or decrease suspicion to various degrees. An algorithmic approach can be used to distinguish between various hepatic lesions [56]. The process by which liver lesions are classified is demonstrated in Algorithm 3.2 [56].
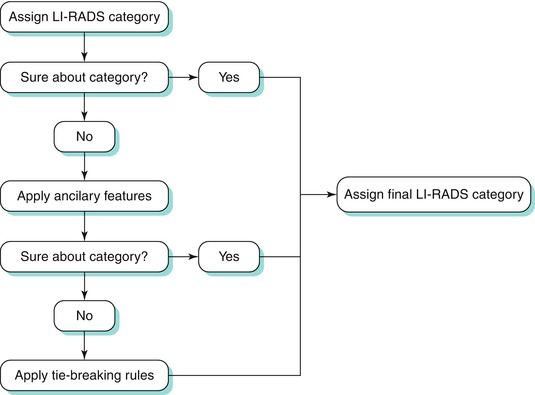
Algorithm 3.2 Process by which liver lesions are assigned to a final LI-RADS category
Note should be made that the current version of LI-RADS applies only to patients who are untreated and at risk for HCC. Furthermore, imaging criteria only applies to CT or MR with extracellular contrast agents. Updates to the prior version include [56]:
Unification of LI-RADS and UNOS OPTN categorization:
Capsule appearance has been incorporated as a major feature of HCC, whereas previously it was considered an ancillary feature of HCC.
Definition of growth has been updated.
As a result of the above changes, LR-5 and OPTN-5 categories are now congruent, and UNOS defers OPTN-1–4 categories to LR-1–4.
Change from list format to algorithmic format for assignment of LI-RADS category codes.
Expansion of the LI-RADS lexicon of terms.
Incorporation of a comprehensive atlas that illustrates major and ancillary imaging features, as well as key lexicon terms.
Incorporation of management implications for each LR category.
Incorporation of CT and MRI technical requirements.
Technical Requirements [56]
The most updated version of LI-RADS now includes technical requirements both for CT and MRI. For CT, requirements include arterial-phase, preferably in the late arterial-phase, and portal venous imaging. Suggested features include pre-contrast and delayed-phase imaging, as well as multiplanar reformatting.
For MRI, requirements include pre-contrast, arterial-phase (late arterial phase strongly preferred), portal venous, and delayed-phase imaging. Required sequences include T1W in/out phase and T2WFSE (or T2WSSFSE). Suggestions include DWI, multiplanar reformats, and subtraction images, if necessary.
Major Imaging Features [56]
Mass-like configuration, previously a major feature on the prior version of LI-RADS, refers to a space-occupying process that includes capsular or pseudocapsular ring enhancement on portal venous and later phases; visibility on pre-contrast, DWI, T2, or T2* images; discrete margins; rounded shape; focal deformity of the liver contour; and displacement of parenchymal structures [56].
Currently, five major imaging features are used by this system to favor the diagnosis of HCC (Table 3.7) [56]. Algorithm 3.3 below summarizes the LI-RADS scheme.
Table 3.7
Major imaging features which favor HCC
Major imaging features which favor HCC |
|---|
Arterial hyperenhancement |
Washout features |
Threshold growth (see text) |
Tumor in the vein |
Capsular enhancement |
Mass-like configuration* (not included on current LI-RADS) |
Arterial-Phase Enhancement
Arterial-phase hyperenhancement is considered the most determinant feature in HCC diagnosis [15, 57, 59]. All or part of the lesion in question must demonstrate greater enhancement than the surrounding liver during the arterial phase, reflecting the anomalous arterial vascularization associated with HCC (Fig. 3.9) [12, 59]. It should be noted that factors such as portal hypertension can delay vascular enhancement with potential for more evident enhancement during the portal venous phase [56].
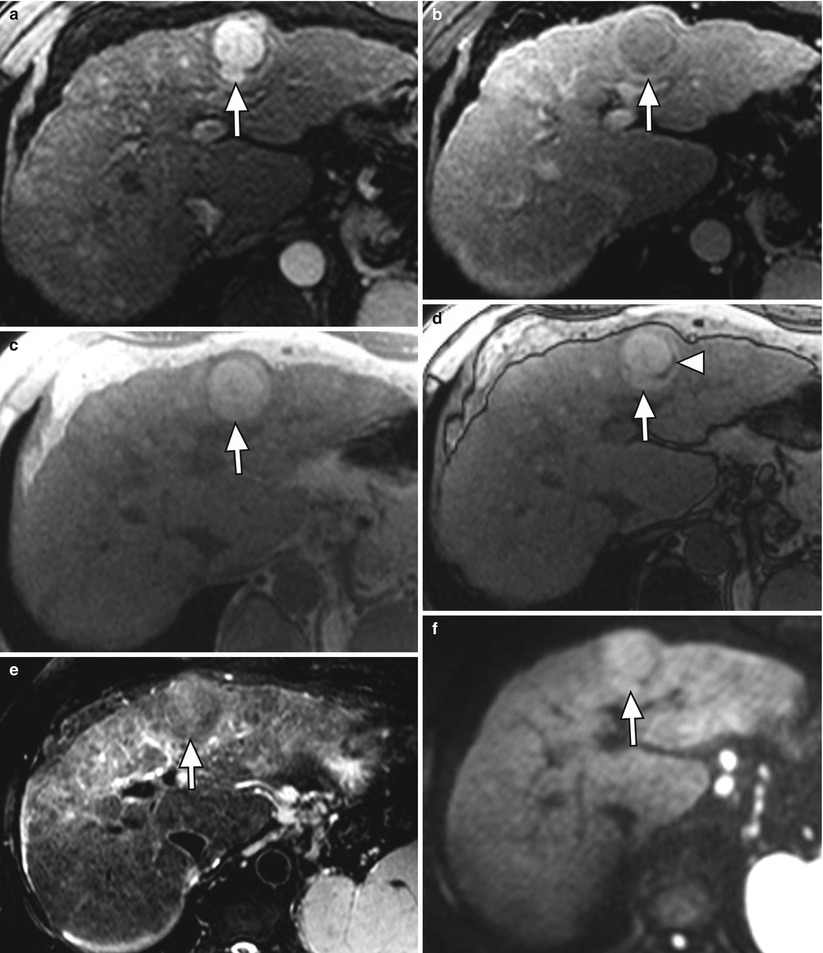
Fig. 3.9
A 3.8 cm HCC in segment II of a cirrhotic liver on axial (a) late arterial-phase T1W GRE with extracellular gadolinium contrast, (b) portal venous-phase T1W GRE with extracellular gadolinium contrast, (c) T1W IP, (d) T1W OP, (e) T2W FSE with fat suppression, and (f) diffusion-weighted imaging (DWI). HCC (arrows) shows hyperenhancement in the arterial phase, washout feature and capsular enhancement in the venous phase, hyperintensity on T1W IP, lipid content on OP (arrowhead), and hyperintensity on T2W and DWI
Arterial-phase hypo- or isoenhancement refers to enhancement less or equal to that of the liver during the arterial phase [56]. Masses are placed into this category if they are not definitely demonstrating arterial hyperenhancement. Since these masses are not definitively HCC, additional major features, as well as size criteria, are used to delineate their LI-RADS classification [56].
Washout Features (Previously Portal Venous- or Later-Phase Hypoenhancement)
The most updated version of LI-RADS has renamed “portal venous or later-phase hypoenhancement” to “washout appearance,” in keeping with OPTN terminology [56]. Washout appearance is considered a strong predictor of HCC in arterially enhancing hepatic lesions (Fig. 3.9) [60]. This phenomenon results from decreased portal venous supply to HCC accompanying neoangiogenesis, in addition to early venous drainage, and delayed enhancement of fibrosis resulting in greater enhancement of the surrounding liver parenchyma during these phases [53, 61]. Special care should be made to ensure that signal intensity during these phases is unequivocally less than during earlier phases, as well as making certain that the same lesions are compared in different phases [62]. Rimola et al. evaluated washout features with dynamic MRI in 5–20 mm lesions detected by screening ultrasound of cirrhotic patients [63]. Though sensitivity was only 58.3 %, diagnosis of HCC in masses demonstrating arterial hyperenhancement with washout yielded specificity and positive predictive values of 96.4 and 96.8 %, respectively [63].
Related posts:
Stay updated, free articles. Join our Telegram channel

Full access? Get Clinical Tree


