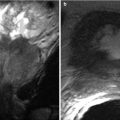
Fig. 2.1
Liver segments in anterior view (a), posterior view (b), and 3D Illustration (c). Segment I: the caudate lobe seen in the posterior view. Segment II: lateral segment of the left hepatic lobe superior to the left portal vein. Segment III: lateral segment of the left hepatic lobe inferior to the left portal vein. Segment IV: medial segment of the left hepatic lobe which is further subdivided by the left portal vein into IVa superiorly and IVb inferiorly. The right portal vein divides the right lobe into segments V/VI inferiorly and segments VII/VIII superiorly. Segments V and VIII are located anteriorly and are demarcated from segments VI and VII posteriorly by the right hepatic vein
There are three fissures that help define hepatic lobes and the major hepatic segments. The interlobar fissure (separating the right and left hepatic lobes) is located along the inferior liver margin, oriented along a line passing through the gallbladder fossa inferiorly and the middle hepatic vein superiorly. The interlobar fissure is usually difficult to identify, but it is well defined in some patients. The left intersegmental fissure (fissure for the ligamentum teres) forms a well-defined cleft which is sagittally oriented in the lower left hepatic lobe and divides the left lobe into lateral and medial segments (between segments II/III peripherally and IV centrally). The ligamentum teres, which represents obliterated left umbilical vein, normally contains small amount of fat, runs through this fissure after entering it via the free margin of the falciform ligament. The third fissure – fissure for ligamentum venosum – is oriented in a coronal or oblique plane between the posterior aspect of the left lateral hepatic segment and the anterior aspect of the caudate lobe. This fissure forms a continuum with the intersegmental fissure. The fissure for the ligamentum venosum cuts deeply anterior to the caudate lobe and contains the two layers of the lesser omentum (Fig. 2.2).
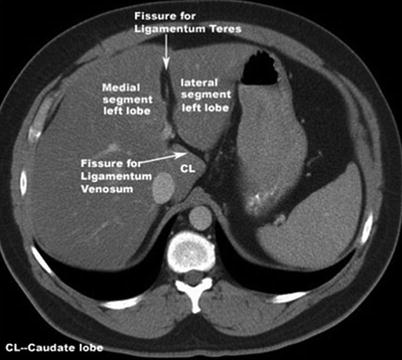
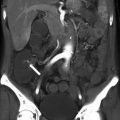
Fig. 2.2
Fissures of the liver; the interlobar fissure (separating right and left hepatic lobes); the left intersegmental fissure (fissure for the ligamentum teres) divides the left lobe into medial and lateral segments. The third fissure is the fissure for ligamentum venosum and is oriented in a coronal or oblique plane between the posterior aspect of the left lateral hepatic segment and the anterior aspect of the caudate lobe. Note that there is a generalized hypodensity of the liver parenchyma in this image secondary to diffuse hepatic steatosis (fatty infiltration)
This omental reflection forms the porta hepatis where the hepatic artery, portal vein, and hepatic nerve plexus enter the liver and the right and left biliary ducts and lymphatic drainage emerge from it. The caudate lobe is located in the watershed area between the right and left vascular and biliary territory. The caudate lobe drains directly into the IVC and is usually spared in cases of hepatic venous occlusion such as in the Budd–Chiari syndrome [2].
Hepatic disease can be pathologically classified into various categories as illustrated in Table 2.1.
Table 2.1
Pathological classification of liver diseases
Congenital | Inflammatory |
Congenital absence of hepatic segments | Sarcoidosis |
Anomalies in position | Primary biliary cirrhosis |
Accessory fissures | Diffuse liver disease |
Congenital hepatic fibrosis | Fatty liver (steatosis) |
Congenital vascular anomaly | Cirrhosis |
Congenital focal lesions: | Hemochromatosis |
Liver cysts | Wilson disease |
Autosomal dominant polycystic kidney disease | Benign focal lesions |
Biliary hamartoma | Hemangiomas |
Infection | Focal nodular hyperplasia FNH |
Hepatitis (viral) | Hepatocellular adenoma |
Pyogenic abscess (bacterial) | Adenomas |
Amebic abscess | Angiomyolipoma |
Hydatid cyst (parasitic) | Malignant focal lesions |
Hepatic candidiasis (fungal) | Hepatocellular carcinoma (HCC) |
Vascular disorders | Fibrolamellar HCC |
Arteriovenous malformation | Cholangiocarcinoma |
Budd–Chiari syndrome | Epithelioid hemangioendothelioma |
Hepatic infarction | Biliary cystadenoma/cystadenocarcinoma |
HELLP syndrome | Angiosarcoma |
Peliosis hepatis | Metastasis and hepatic lymphoma |
Hepatic artery and portal vein aneurysm | Traumatic, such as: |
Portal vein thrombosis | Posttraumatic sequelae |
THID/THAD | Posttreatment changes |
Portal hypertension | |
Hereditary hemorrhagic telangiectasia |
Normal Variants
A spectrum of liver size and shape variations have been reported, including lateral elongation of the lateral segment of the left hepatic lobe (Fig. 2.3), extending to wrap around the spleen, left lobe hypoplasia, and vertical elongation of the right hepatic lobe (Riedel lobe). Familiarity of these normal variants is important, to avoid misdiagnosis of these variants as exophytic mass lesions such as hepatic HCC or adenoma. These variants are more common in females than males [2].
Fig. 2.3
Normal variant of the liver. Axial contrast-enhanced CT image, showing elongated left lobe (arrows)
Diaphragmatic insertions can be seen as small wedge-shaped areas, associated with the capsule surface of the liver. These exhibit low attenuation on CT and demonstrate low signal intensity on T1- and T2-weighted images.
Part One: Algorithmic Diagnostic Approach of Focal Hepatic Lesions
A diagnostic approach should be used to help differentiate various liver lesions based on the spectrum of certain enhancement patterns, imaging features, and attenuation/signal intensity characteristics. Morphologic patterns include solid versus cystic, the presence of calcification, macroscopic fat, and intracellular lipid. Enhancement patterns are seen during specific phases of imaging and include hypoenhancing, arterial enhancing, delayed enhancing, delayed washout and peripheral washout, as well as the presence of a central scar enhancement patterns (Algorithm 2.1). Attenuation characteristics include simple cystic lesions, complex cystic lesions, and calcified lesions as well as lesions containing intracellular lipid, hemorrhagic lesions, and lesions containing macroscopic fat (Algorithm 2.1).
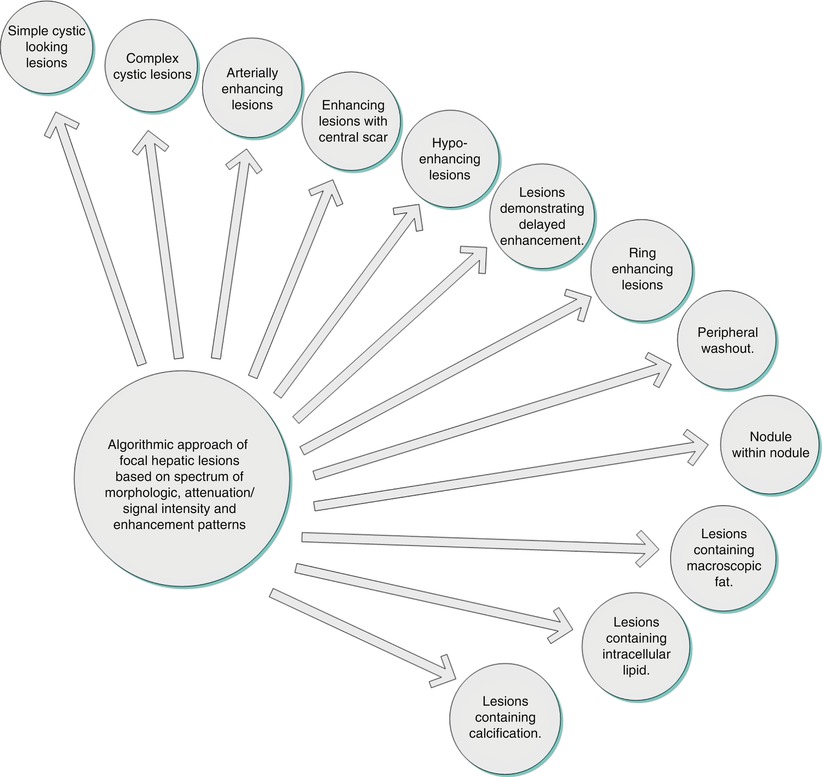
Algorithm 2.1
Algorithmic classification of different patterns of enhancement
Algorithmic Approach of Focal Hepatic Lesions Based on Spectrum of Morphologic, Attenuation/Signal Intensity and Enhancement Patterns
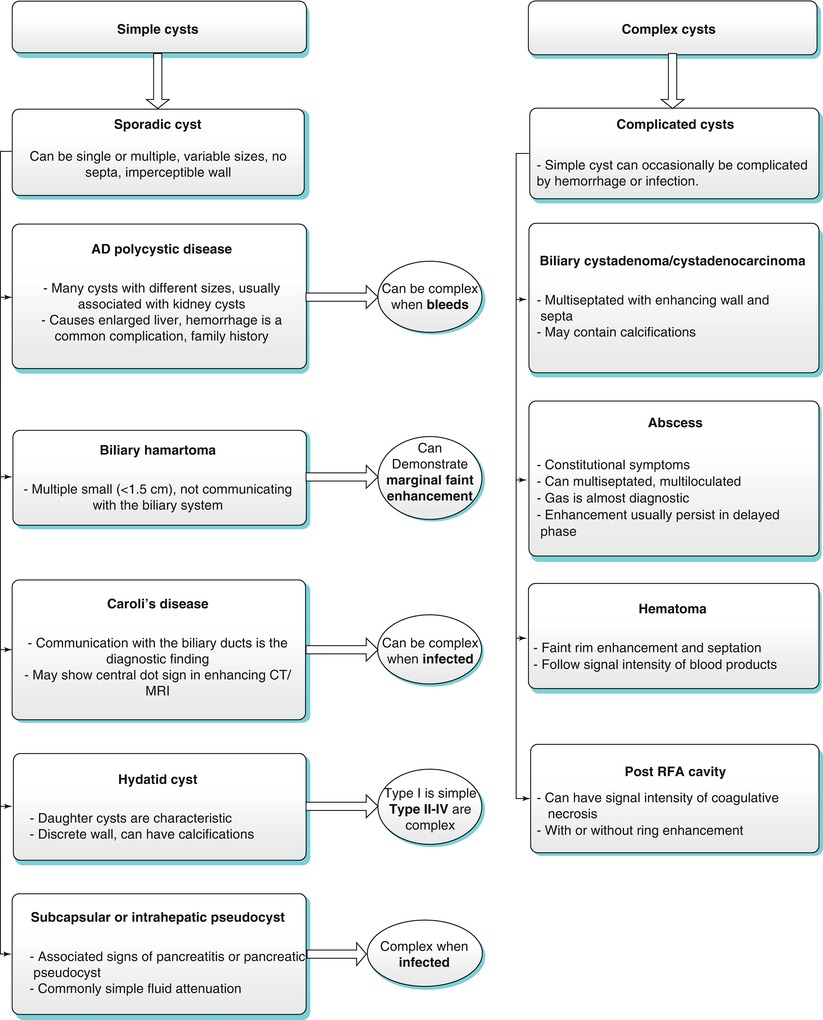
Algorithm 2.2
Algorithmic approach of cystic lesions
Key Teaching Points of Cystic Liver Lesions (Algorithm 2.2)
Definition of simple cystic pattern: a well-circumscribed lesion with a fluid attenuation/signal intensity demonstrating thin wall, with no complex features such as altered content (proteinaceous secondary to infection or hemorrhagic), peripheral enhancement, solid component, calcifications, or septations.
Sporadic simple cyst represents the most common lesion with simple cystic features. Simple cysts can be multiple. Multiple cysts/cyst-like lesions can be seen in ADPKD (commonly associated with renal cysts which can frequently bleed) and biliary hamartomas where subcentimeter simple cystic-looking lesions are noted which are noncommunicating with the biliary tree. On cross-sectional imaging, Caroli disease is characterized by larger cystic-looking lesions communicating with the biliary tree. Very rarely, pancreatic pseudocysts can occur in the liver mimicking simple cysts.
Complex cystic lesions include biliary cystadenoma/cystadenocarcinoma, abscess (clinical and laboratory findings), hematoma (CT attenuation and MR signal intensity of blood degradation products), post RF ablation cavity (can mimic cystic lesion, history of treatment, occasional rim enhancement), and hydatid cysts [occur in endemic areas and could have daughter cysts, calcification, and floating membranes]. Metastases can rarely appear cystic (simple or complex), especially the ones secondary to mucinous tumors and GIST as well as hypervascular metastases which can undergo cystic changes with chemotherapy such as neuroendocrine tumors.
Simple Hepatic Cysts
Hepatic cysts are common liver lesions. Pathogenesis of these cysts is not clear, and acquired cysts are thought to represent retention cysts of bile ductule derivation [3]. The cyst is typically lined with a single layer of cuboidal to columnar epithelial cells. On imaging, cysts are homogeneous and well circumscribed and possess a sharp margin with the liver, with no visible wall. Although slight variations are common, cysts are usually rounded or oval shaped [4].
Simple cysts are fluid attenuation on CT (demonstrating an attenuation <20 HU) with a thin wall and no significant postcontrast enhancement. On MRI, these demonstrate low signal intensity on T1-weighted images and high signal intensity on T2-weighted images, with retention of the high signal intensity on the longer echo time (e.g., TE ≥120 ms) T2-weighted images. Simple cysts should not enhance following intravenous contrast administration (Fig. 2.4). The presence of thick walls or enhancing internal components suggests the diagnosis of hepatic abscess or neoplasm rather than a simple cyst. In addition, simple cyst can be differentiated from cystic metastases using the delayed phase of contrast enhancement where metastases can show enhancement, while cysts do not [5]. Rarely, hemorrhage or infection can complicate cysts, and these account for difficulty in differentiation from other complex cystic lesions including abscesses and neoplasms.
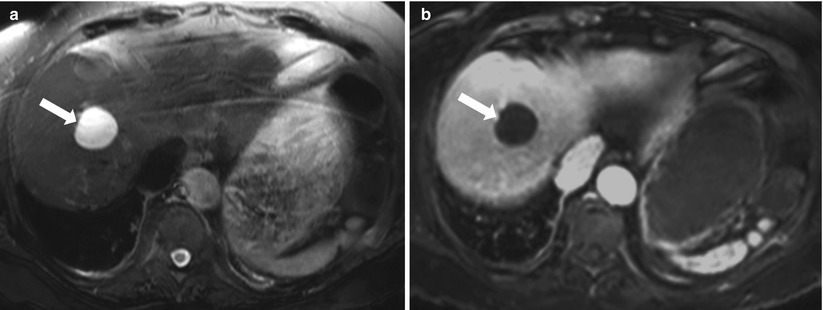
Fig. 2.4
Simple cyst. Axial T2-weighted FSE (a), and axial fat suppressed postgadolinium SGE T1-weighted image (b). A well-defined lesion that is homogeneously high signal intensity on T2-weighted image (arrow) with no enhancement after administration of gadolinium (arrow), consistent with simple liver cyst
Autosomal Dominant Polycystic Kidney Disease (ADPKD)
Liver involvement is the most frequent extrarenal manifestation in autosomal dominant polycystic kidney disease [6]. Liver cysts are the most frequently encountered manifestation, but other pathologies can occasionally be encountered, including congenital hepatic fibrosis and segmental dilation of the biliary tract. Cysts are usually multiple, with variable sizes (Fig. 2.5), and associated cysts in the kidneys or pancreas and positive family history are helpful in reaching the diagnosis.
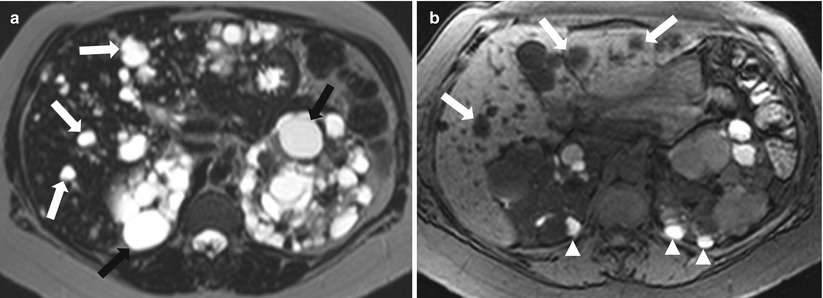
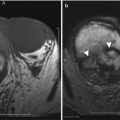
Fig. 2.5
Autosomal dominant polycystic kidney disease. Axial T2-weighted image (a), and axial T1-weighted fat-saturated image without intravenous contrast (b) demonstrate numerous cysts of varying sizes scattered throughout the liver and kidneys exhibiting high signal intensity on T2-weighted image (arrows), with increased signal intensity of some of renal cysts on T1-weighted image (arrowheads) indicating hemorrhage. Note that the liver cystic lesions do not communicate with the biliary tree
Patients with autosomal dominant polycystic liver disease are usually asymptomatic, and severe symptoms can occur in 20 % of patients who develop massive hepatomegaly with compression of the surrounding organs. Rarely, acute complications can be caused by torsion, intracystic hemorrhage, and infections, with liver dysfunction occurring only sporadically [7]. However, advanced disease can result in liver failure, or Budd–Chiari syndrome.
Cysts demonstrate typical features of fluid-containing well-circumscribed lesions with fluid attenuation on CT (manifested by attenuation <20 HU) and MRI (manifested by low signal intensity of T1-weighted and high signal intensity on T2-weighted images) with no significant enhancement on postcontrast series. Because of the larger number of cysts, intracystic hemorrhage is more frequently encountered than in cases of simple hepatic cysts [8]. Intracystic hemorrhage is usually seen as areas of higher attenuation on CT and areas of altered MRI signal intensities due to blood degradation products [9].
Biliary Hamartoma
Biliary hamartoma (also known as von Meyenburg complexes) are benign biliary malformations which are categorized under the spectrum of fibro-polycystic diseases of the liver. They arise from bile duct embryological remnant due to anomalous development of the ductal plate [10]. Biliary hamartomas is not uncommon and occurs in approximately 3 % of patients. These can be solitary or more commonly multiple, and multiple lesions can be extensive.
On CT and MR images, lesions are uniformly small (usually <1.5 cm) and well defined. On CT, the lesions may not be well characterized due to the too small size which may preclude accurate characterization [11]. The fluid content renders these lesions high signal intensity on T2-weighted images and low signal intensity on T1- weighted images. On heavily T2-weighted images, the signal intensity increases further, similar to that of fluid on T2-weighted images.
On MR cholangiography, bile duct hamartomas appear as multiple tiny cystic lesions that do not communicate with the biliary tree [10].
Although this appearance resembles simple cysts, biliary hamartomas may demonstrate a subtle thin rim of enhancement on postcontrast images (Fig. 2.6) due to enhancing fibrous capsule and/or compressed surrounding parenchyma. This rim of subtle enhancement should not be mistaken for other diagnoses such as abscesses and metastases. Capsule can also demonstrate low signal intensity on T2-weighted images.
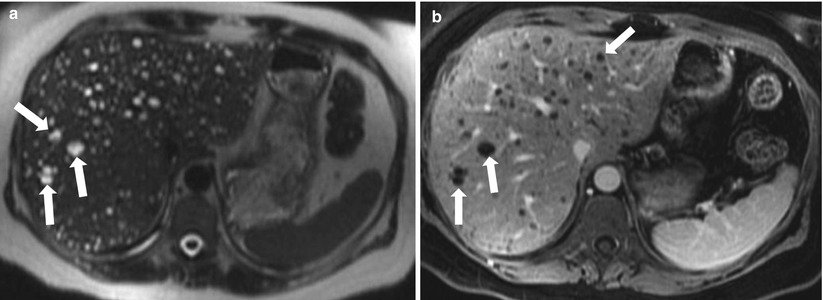
Fig. 2.6
Biliary hamartomas. Axial T2-weighted HASTE (a) and axial contrast-enhanced 3D GRE T1-weighted image (b) show multiple small lesions representing demonstrating high signal intensity on T2-weighted image (A) and low signal intensity onT1-weighted with a thin rim of enhancement (arrows). On MRCP (not shown), these do not communicate with biliary tree
Caroli Disease
Caroli disease is a rare autosomal recessive condition characterized by congenital cystic dilation of the intrahepatic bile ducts [12]. Although Caroli disease generally involves the entire liver, it may be segmental or lobar. Two forms of Caroli disease have been described: (a) a less common “pure” form (type 1) and (b) a more complex form (type 2) that is associated with other ductal plate abnormalities such as hepatic fibrosis [13].
Often, patients clinically present with bouts of recurrent fever and right upper quadrant pain. Jaundice may occur if the calculi obstruct the common bile duct. On cross-sectional CT and MRI, Caroli disease appears as multiple variable-sized, non-enhancing cystic lesions. MR cholangiopancreatography is a noninvasive imaging technique that has become the first-choice modality for diagnosing Caroli disease [14]. MRCP demonstrates the connection of these cysts to the biliary ducts (Fig. 2.7), which is the key feature for the diagnosis.
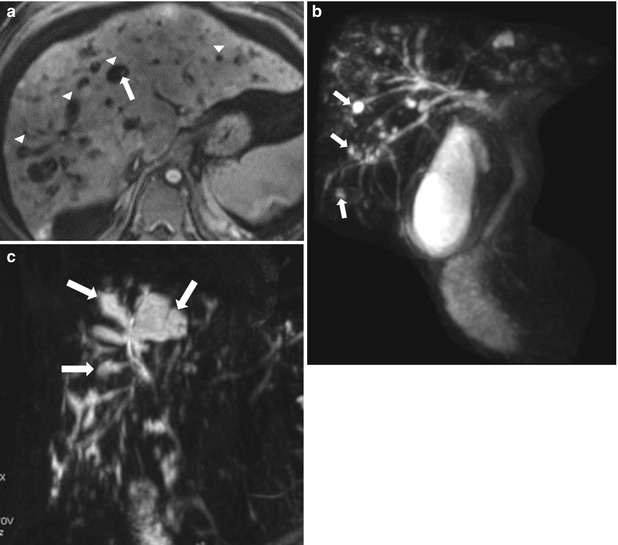
Fig. 2.7
Caroli disease in three different patients, Axial contrast enhanced T1-weighted image (a) demonstrating numerous cyst-like lesions (arrowheads) with a central tiny enhancing focus (arrow), consistent with central dot sign classic for Caroli disease. Coronal MR cholangiogram (b) in a 54-year-old male patient, shows saccular dilatation of the biliary tree (arrows). Coronal projection MR cholangiogram (c) in a 21-year-old female shows a connection between the saccular dilated segmental bile ducts (arrows) and the central biliary tree
The central dot sign is described on contrast-enhanced CT and MRI as well as color Doppler ultrasound as a tiny enhancing focus in the center of cystic-appearing morphology and is due to the contrast-enhanced small portal venous branch protruding into the dilated intrahepatic bile ducts. This sign has been used to make a diagnosis of Caroli disease [15].
Complications may occur secondary to bile stagnation which leads to cholangitis and formation of calculi which may result in biliary obstruction and jaundice. Cholangiocarcinoma has been reported to complicate Caroli disease in 7 % of cases [16].
Biliary Cystadenoma/Cystadenocarcinoma
Biliary cystadenoma/cystadenocarcinoma is a group of rare biliary neoplasms occurring most commonly in middle-aged women. Biliary cystadenomas are considered premalignant neoplasms with the majority located in the liver with a significantly less incidence in the extrahepatic biliary tree. These are often incidental, but symptoms can arise due to mass effect of large lesions.
Typically, these tumors appear as multiloculated lobulated cystic lesions with several septations and occasional solid nodules. On CT and MR imaging, these appear as cystic (typical fluid characteristics on CT and MRI), with enhancing septations and solid components [17]. Wall or septal calcifications can be also seen. Altered characteristics of the fluid can be seen due to mucin/protein contents or hemorrhage. These can be demonstrated as higher CT attenuation and higher signal intensity on T1-weighted images (Fig. 2.8) [18].
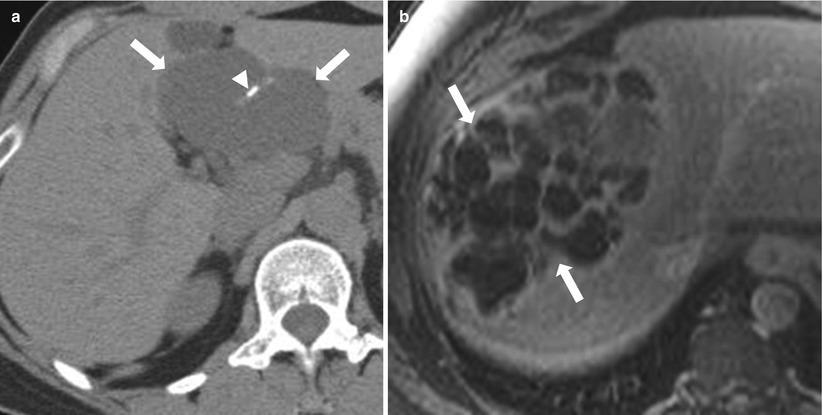
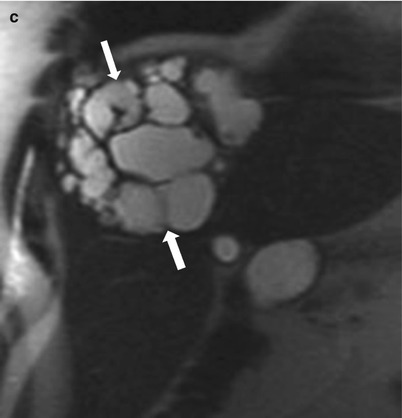
Fig. 2.8
Biliary cystadenoma; Axial nonenhanced CT (a) showing multiloculated fluid attenuation lesion (arrows) in the left lobe with septal calcifications (arrowhead). Axial postcontrast T1-weighted image (b) and coronal T2-weighted image HASTE (c) in a different patient demonstrate multiloculated cystic lesion in the right lobe (arrows), with multiple enhancing septations, consistent with biliary cystadenoma
Although malignant tumors tend to have thicker nodular septations, there is no definite reliable criterion for differentiating cystadenoma from cystadenocarcinoma as nodular soft tissue projections can be seen in both tumors [19].
Liver Abscess
Bacterial infection is the most common cause of liver infectious processes leading to the formation of pyogenic abscesses. These can be caused by hematogenous spread particularly if multiple (of either gastrointestinal infection via the portal vein or disseminated sepsis via the hepatic artery), ascending cholangitis, or superinfection of necrotic tissue [20–22]. A solitary hepatic abscess is usually cryptogenic and may not have a known etiology [22].
In a more recent report, biliary infection is the most common sources of infection. Clinical presentation includes signs of right upper quadrant pain, tenderness, and hepatomegaly with occasional occurrence of jaundice and pulmonary changes. Symptoms include generalized malaise, fever, and weight loss as well as chills. Liver function tests and total leukocyte count (>10.000) are elevated in most patients [23].
Treatment options include percutaneous drainage, surgical resection, and intravenous antibiotics with a mortality rate of 9.4 % in the surgically treated group and 16.6 % in the nonsurgically treated group [24].
Pyogenic abscess is the most common focal parenchymal lesion due to bacterial infection. Hepatic abscess can be solitary or multiple which may vary from small (few millimeters) to massive lesions. Infectious process usually starts by diffuse inflammatory process but later matures to a well-defined abscess cavity surrounded with fibrous capsule, which gives the abscess the characteristic pattern of early, persistent moderate to intense ring enhancement, without progressive enhancement of the stroma, which – beside the constitutional symptoms – helps to differentiate multiple abscesses from metastases which usually shows progressive stromal enhancement. The central necrotic cavity exhibits low attenuation on CT, low signal intensity on T1-weighted images, high signal on T2-weighted images, and with no significant postgadolinium enhancement. Transient segmental wedge-shaped hepatic enhancement associated with hepatic abscesses are usually seen in the early postcontrast images due to surrounding inflammatory response in the adjacent liver [25, 26], and this perilesional enhancement resolves on delayed images (Fig. 2.9). In the absence of history of intervention, the presence of intralesional gas bubbles, which appears as gas-attenuating regions on CT or signal void foci on MR, is virtually diagnostic for pyogenic abscesses [25, 26].
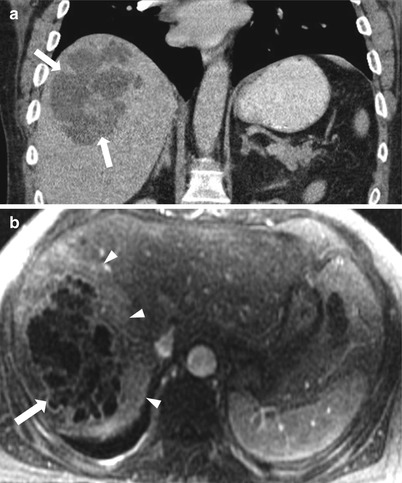
Fig. 2.9
Pyogenic liver abscess; coronal reformatted contrast-enhanced CT (a), axial postcontrast-enhanced T1-weighted (b) showing large complex multiloculated cystic lesion (arrows) with thick enhancing rim and central septations seen within the hepatic dome with perilesional enhancement (arrowheads)
Amebic abscesses are caused by Entamoeba histolytica which is endemic in developing countries such as India, Middle East, Far East, Africa, and South America but can also occur in as immigrants and travelers from these endemic regions, and the condition is typically characterized by diarrhea which is one of the initial symptoms of the disease.
Increased serum antibodies to Entamoeba are characteristic in the majority of cases [27]. A single abscess predominantly located in the right lobe with a thick enhancing capsule is characteristic for amebic abscess. Perilesional edema can be also visualized. Chest wall and pleural involvement are also noted in some cases of amebic abscesses.
Hydatid Cyst (Echinococcal Cyst)
Echinococcus granulosus represents the most common organism causing echinococcal disease which is endemic to the Mediterranean basin, Middle East, and other sheep-raising areas [24]. Pathologically, the typical hydatid cyst is well circumscribed spherical with a fibrous rim. Surrounding liver reaction to the abscess is minimal, with a small amount of granulation tissue. The typical imaging feature is multicystic lesion with daughter cysts arranged peripherally within the larger cyst. Occasionally, some cysts are seen outside the fibrous capsule of the main hepatic cyst. Typically, cysts have low signal intensity on T1-weighted and high signal intensity on T2-weighted images. Lesions are frequently complex, with mixed high and low signal intensity on T2- and T1-weighted images, respectively, due to the presence of proteinaceous content and cellular debris (Fig. 2.10). The fibrous capsule and internal septations can be well shown on T2-weighted images and gadolinium-enhanced T1-weighted images [28]. Calcification of the cyst wall or content is frequently identified on CT images but difficult to distinguish from the fibrous capsule in MRI due to the low signal intensity of both on T2-weighted images [28]. Interruption of wall calcification represent a sign of impending rupture.
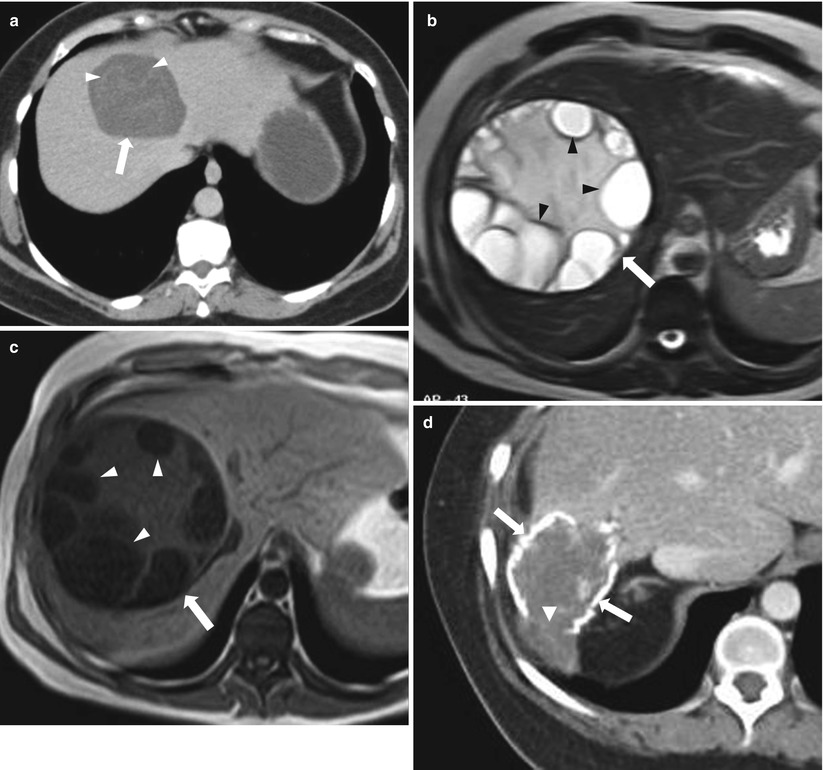
Fig. 2.10
Three different cases of echinococcal cysts; axial contrast-enhanced CT (a) demonstrating a well-circumscribed cystic lesion (arrow) with water lily sign (irregular thin internal linear floating membranes) (arrowheads). Axial T2-weighted image and T1-weighted image, respectively (b, c), demonstrating multiple peripheral internal cystic lesions (daughter cysts) (arrowheads) within the larger mother cyst (arrows). Axial contrast-enhanced CT (d) demonstrating a hydatid cyst with wall calcification (arrows) which demonstrates focal interruption (arrowhead); a sign associated with impending rupture
Intrahepatic Hematoma
Hematoma occurs as a result of blunt trauma such as motor vehicle accident, or surgical/interventional procedures including biopsy, and appears as a fluid collection with varying density/signal intensity depending on the age of the blood products.
On CT, acute hematoma demonstrates high attenuation on precontrast CT with no significant postcontrast enhancement. Attenuation decreases with aging of the blood products. MR imaging is the most sensitive and specific modality for diagnosing hematomas. MR imaging features vary according to the age of the hematoma. In hyperacute stage (<24 h), oxyhemoglobin represents the main component which is demonstrated as simple fluid with low signal intensity on T1-weighted and high signal intensity on T2-weighted images. In the acute stage (1–3 days old), deoxyhemoglobin results in increased paramagnetic susceptibility with low signal intensity on T2-weighted images. Early subacute stage (from day 3 to 7) is characterized by the presence of intracellular methemoglobin which still leads to low signal intensity on T2-weighted and high signal intensity on T1-weighted images. Late subacute stage (day 7–14) is characterized by the presence of extracellular methemoglobin which results in a high signal intensity on T1-weighted and high signal on T2-weighted images (Fig. 2.11). Chronic hematoma (older than 14 days) is characterized by the presence of hemosiderin which results in low signal intensity on T1-weighted and low signal intensity on T2-weighted images [29, 30]. Some hematomas show rim enhancement after contrast material administration [31].
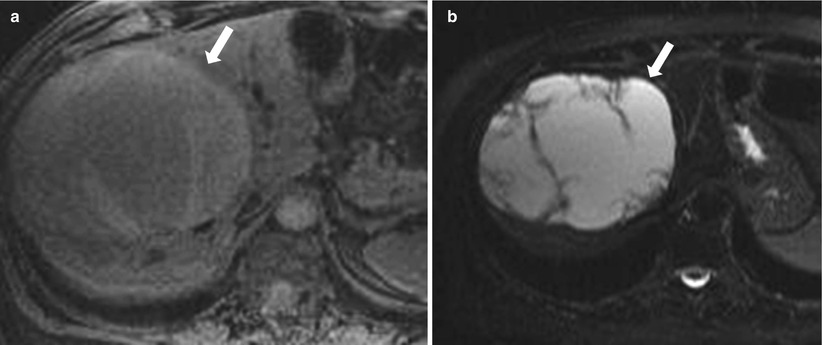
Fig. 2.11
Axial T1-weighted image (a) and axial T2-weighted image (b) demonstrate ovoid shaped weel-circumscribed lesion (arrows) exhibiting intermediate to high signal intensity on T1-weighted and high signal intensity on T2-weighted images, consistent with subacute hematoma. Note thick fibrous capsule, intralesional septations, and underlying liver parenchymal displacement.
Post Radiofrequency Ablation (RFA) Cavity
In addition to surgical resection, other nonsurgical interventional procedures have been established to treat liver malignancies. These include radiofrequency (RF) ablation, cryoablation, ethanol ablation, microwave ablation, and laser ablation: they all play an important role particularly in the treatment of solitary lesions [32]. Effective treatment is indicated by the decrease in size or at least no change of size of the ablation cavity.
Expected normal findings after ablation include ill-defined perilesional enhancement secondary to inflammatory reaction (up to 6 months after ablation), with a higher than simple fluid attenuation on CT, high signal intensity on T1-weighted images secondary to coagulative necrosis which persists for several months post ablation.
A well-defined marginal enhancement, nodular enhancement, and washout are all concerning for neoplastic residual/recurrence.
The ablated area must exceed the tumor margins by approximately 1.0 cm [33]. Over time, the ablated zone might either shrink or retain similar size to the original lesion [34]. Enlargement of the ablated area on follow-up examinations is suggestive of unsuccessful intervention [35]. In early post-treatment weeks, the signal intensity on T2-weighted and T1-weighted images corresponds to the hemorrhage and either liquefactive or coagulative necrosis [34]. Signs of successful treatment include lack of contrast enhancement. Early after intervention, an ill-defined perilesional rim is often observed that appears mildly high signal intensity on T2-weighted images and exhibits moderate to intense enhancement on arterial dominant-phase images [34, 35]. Over time, thickness of the perilesional rim regresses in successfully treated lesions and gradually disappears several months after ablation (Fig. 2.12) [33]. The perilesional rim corresponds to intense inflammatory reaction and hemorrhage, which are gradually replaced by granulation tissue [33].
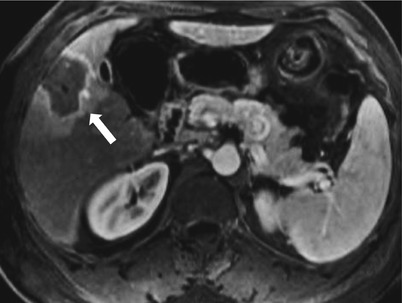
Fig. 2.12
Axial contrast enhanced T1-weighted image one month following radio-frequency ablation demonstrates a low signal intensity cavity with a peripheral smooth uniform enhancement (aroows), this pattern is normally seen in early few months after radiofrequency ablation
The presence of a nodular focus of high intensity in T2-weighted images and nodular enhancement mainly in the arterial phase is indicative of residual or recurrent tumor (Fig. 2.13) [33, 34], which may washout on late-phase images.
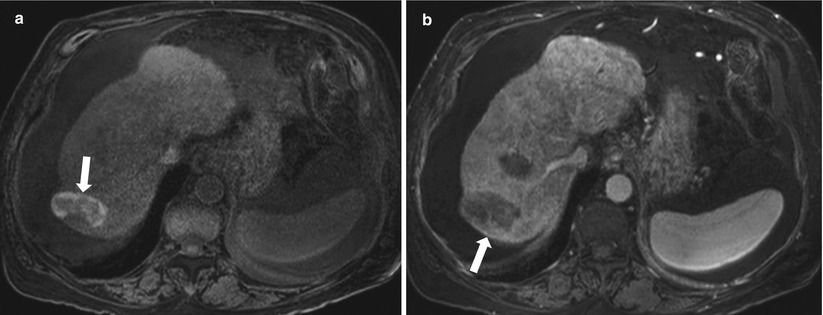
Fig. 2.13
Axial precontrast T1 weighted (a) and contrast enhanced T1 weighted (b) images demonstrating a post ablation cavity showing high signal intensity(coagulative necrosis) on T1-weighted image (arrow in a), with a nodular peripheral enhancement (arrow in b) in the arterial phase denoting residual/recurrent tumor
Cystic Metastases
A minority of liver metastases can be cystic which can lead to diagnostic dilemma as these can be confused with the more common benign cystic lesions. Occasionally, gastrointestinal stromal tumor (GIST) and mucinous adenocarcinoma of the colon or ovary can result in cystic liver metastases. Rapidly growing metastases secondary to hypervascular tumors can overgrow their blood supply leading to cystic degeneration and necrosis. Examples of these tumors include neuroendocrine tumors, melanoma, and breast carcinoma. These lesions often demonstrate fluid attenuation on CT (Fig. 2.14). On MRI, low signal intensity on T1-weighted images and high signal intensity on T2-weighted images are noted. On postcontrast series, peripheral rim-like enhancement can be seen on early phases with occasional gradual filling on delayed phase. Knowledge of the clinical history can help in the differential diagnosis. Cystic metastases can be active or inactive (particularly in those which develop cystic changes secondary to treatment). PET scan can be also utilized and often demonstrate increased FDG uptake with active cystic metastases which differentiates them from the more common benign cystic lesions [18, 36–39].
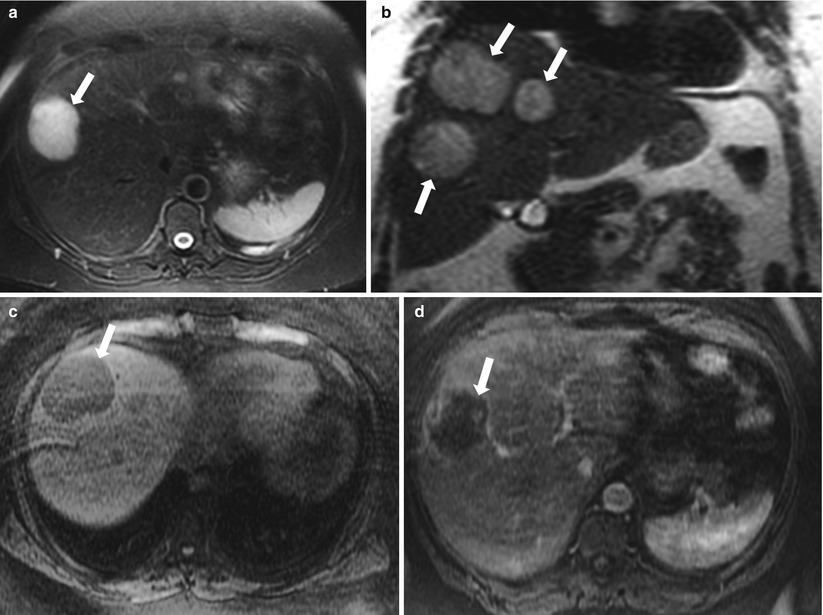
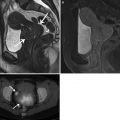
Fig. 2.14
Cystic metastasis secondary to neuroendocrine tumor. Axial T2-weighted with fat suppression (a), coronal T2-weighted (b), axial nonenhanced T1-weighted (c) and axial contrast enhanced T1-weighted (d) images demonstrate well circumscribed cystic lesions (arrows) demonstrating low signal intensity on T1-weighted image, markedly increased signal intensity on T2-weighted images with a slight peripheral enhancement on postcontrast images. These represented cystic metastatic lesions in a 60 year old female with metastatic neuroendocrine tumor 60 year old female with metastatic neuroendocrine tumor
Intrahepatic Pseudocyst
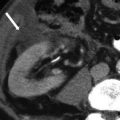
Intrahepatic or subcapsular pseudocysts are rare cystic lesions that can develop in the setting of pancreatitis which may dissect into the liver along portal triads (Fig. 2.15), leading to subjacent collection which further results in the formation of pseudocyst. The clue for the intrahepatic pseudocyst is the clinical presentation in addition to other imaging features of pancreatitis.
Fig. 2.15
Pseudocyst. Axial contrast-enhanced CT demonstrates a well-defined fluid attenuation lesion (arrow, representing pseudocyst in the liver hilum (arrow) in a 76-year-old man with recurrent pancreatitis
Other less common cystic lesions include:
Intrahepatic Biloma (related to biliary tree, secondary to trauma, or after an interventional or surgical procedure): Excretion of contrast into the biloma is demonstrated on 20 min after MR hepatobiliary contrast administration, proving that it communicates with the bile ducts.
Undifferentiated Embryonal Sarcoma: Rare malignant tumor occurring in older children (mean age 12 years) may contain calcifications and solid component.
Hypoenhancing Lesions (Algorithm 2.3)
Hypoenhancing lesions show mild enhancement after intravenous contrast injection. This enhancement is, however, less than the background liver. For this reason, these lesions appear hypodense on contrast-enhanced CT and hypointense on contrast-enhanced T1-weighted images. Other lesions such as focal fatty infiltration may appear similarly hypodense on CT and hypointense on contrast-enhanced T1-weighted mimicking hypoenhancing mass lesions (this can be differentiated by drop of signal intensity on out of phase compared to in phase and will be discussed under lesions containing intracellular lipid).

Algorithm 2.3
Algorithm for the hypoenhancing lesions
Regenerative Nodules (Benign Cirrhotic Nodules)
Regenerative nodules are best seen and evaluated by MRI, the majority of the regenerative nodules are hypodense/isodense on CT and hypo-/isointense on T1-weighted images, and in some occasions, regenerative nodules appear low signal in T2-weighted images compared to the background high signal [40]. In 16 % of cases, regenerative nodules appear hyperintense on T1-weighted images which is related to high-protein content. Some of these nodules contain iron, hence the name siderotic nodules; these appear of high density on precontrast CT with low signal intensity of T1-weighted images and low signal intensity and blooming on T2-weighted images (Fig. 2.16). As regenerative nodules maintain portal venous blood supply with minimal if any hepatic artery supply, they enhance minimally (Fig. 2.17) on the hepatic arterial dominant-phase images and thus appear relatively hypointense/isointense to the liver on MRI or hypodense/isodense on CT compared to the enhancing surrounding liver parenchyma [41].
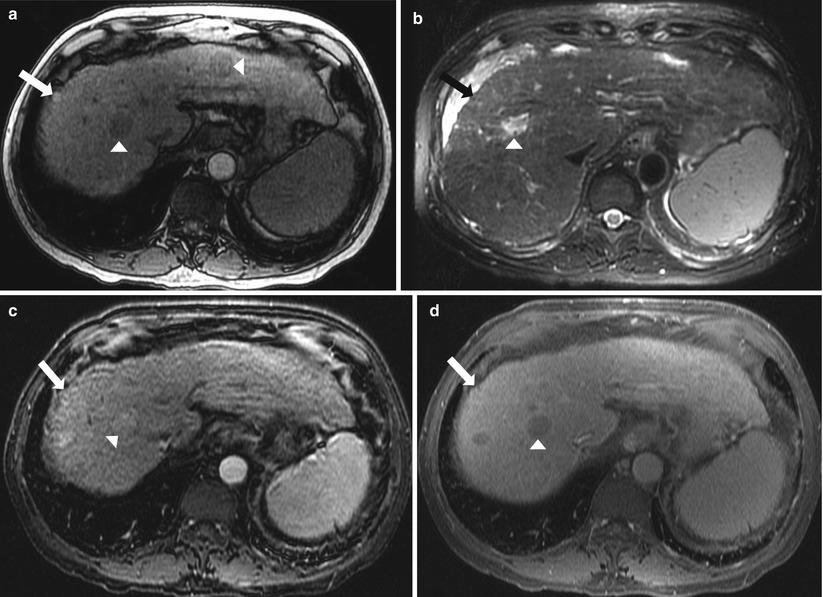
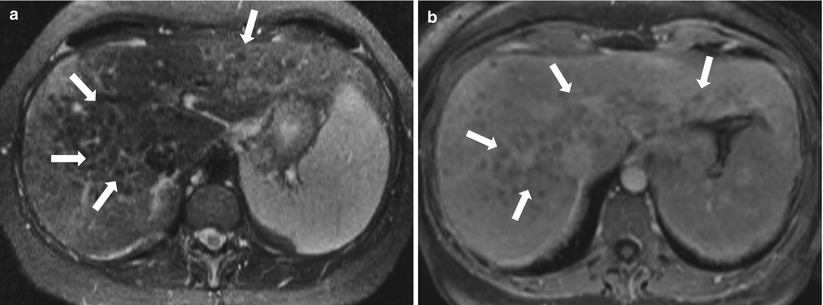
Fig. 2.16
Regenerative cirrhotic nodule. Axial nonenhanced T1-weighted (a), axial T2-weighted (b), axial contrast enhanced T1-weighted in arterial (c), and delayed phase (d) demonstrate high signal intensity on nonenhanced T1-weighted image (arrow in a) which becomes isointense to the liver on T2-weighted image and after intravenous contrast (arrow in b, c and d), representing regenerating nodule. Foci of hepatocellular carcinoma are also noted (arrowheads) demonstrating low signal intensity on nonenhanced T1-weighted image, high signal intensity on T2-weighted images, with homogeneous enhancement on arterial phase and washout on delayed postcontrast phase.
Fig. 2.17
Regenerative siderotic nodules. Axial fat-saturated T2-weighted image (a) and contrast enhanced T1-weighted image (b) demonstrating coarse nodular contour of the liver with numerous nodules (arrows) appearing hypointense relative to the liver parenchyma on T2-weighted and contrast enhanced T1-weighted images, consistent with regenerative nodules
Hepatic Infarction
Liver infarction is rare, and this rare incidence is due to dual blood supply to the liver. Infarction can however occur in settings of shock, trauma, HELLP (hemolysis, elevated liver enzymes, low platelets), and post-transplantation (Fig. 2.18). The classic appearance is a peripheral wedge-shaped areas of low attenuation on CT, low signal intensity on T1-weighted, and high signal intensity on T2-weighted images with less enhancement compared with the surrounding liver parenchyma on postcontrast series.
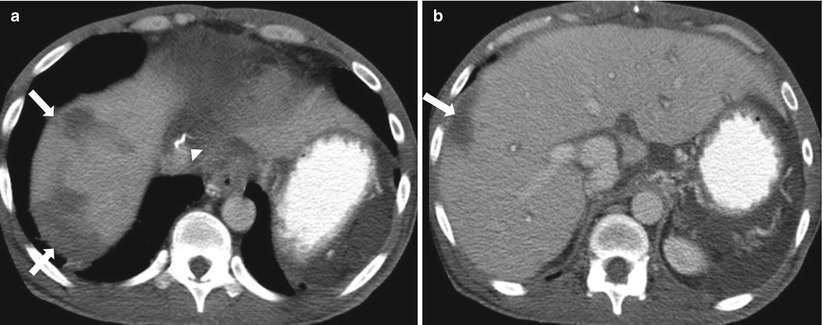
Fig. 2.18
Post-transplant liver infarcts. Axial contrast-enhanced CT for evaluation of post-liver transplant, demonstrating peripheral wedge-shaped low-attenuation areas (arrows) in the periphery of right hepatic lobe of the liver consistent with posttransplantation infarcts. Surgical sutures (arrowhead in a) are noted related to IVC.
Sarcoidosis
Sarcoidosis is an idiopathic systemic inflammatory granulomatous disease. It affects the lymph nodes, lung, and liver in descending order of frequency. Histologically, the liver is affected in majority of patients, but clinical or radiological manifestations are less evident [42]. Liver involvement can be diffuse or focal with associated enlarged retroperitoneal lymph nodes. On CT, sarcoidosis can be visualized as innumerable small hypoattenuating lesions (Swiss cheese pattern), which enhance less than the liver parenchyma on postcontrast CT. On MR, the diffuse pattern appears as an enlarged heterogeneous liver, while the focal pattern appears as a multiple, small nodules exhibiting low signal intensity on T1- and T2-weighted images. After IV contrast administration, these demonstrate enhancement less than the surrounding parenchyma and could demonstrate some enhancement on the delayed phase (Fig. 2.19) [43].
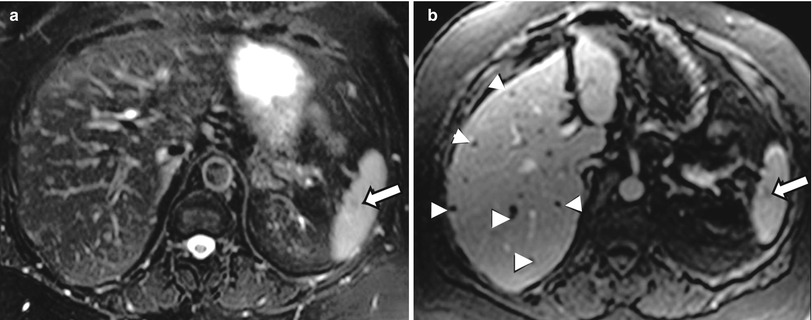
Fig. 2.19
Sarcoidosis. Axial T2-weighted image (a) and axial contrast enhanced T1-weighted image (b), demonstrating several small hepatic lesions (arrowheads) with low signal intensity on both T2-weighted and contrast enhanced T1-weighted images. similar nodule is noted in the spleen (arrow).
[Swiss cheese pattern (innumerable small holes) is characteristic for sarcoidosis but can be also seen with candidiasis, TB, and metastases. The spleen is typically involved in sarcoidosis and candidiasis.]
Lymphoma
Secondary hepatic lymphoma is considerably more common than primary involvement, and the majority are non-Hodgkin lymphomas. Most tumors usually present as a large solitary mass, but they may vary in appearance from multiple nodules to diffuse involvement. Secondary involvement of the liver by lymphoma is common in stage IV disease [44]. On imaging, lesions vary in signal intensity from low to moderately high on T2-weighted images and are typically low in signal intensity on T1-weighted images and tend to enhance minimally in the postcontrast sequences, leading to hypointense signal intensity relative to the surrounding enhancing liver parenchyma. Enhancement on immediate postcontrast images usually is predominantly peripheral. Lesions of malignant lymphoma may possess transient, ill-defined perilesional enhancement on postgadolinium images (Fig. 2.20) [45].
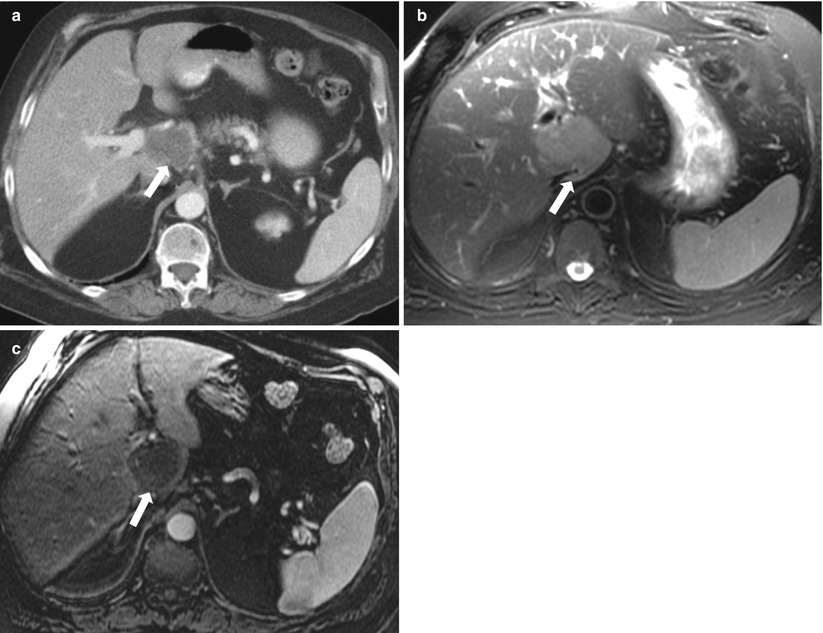
Fig. 2.20
Hepatic lymphoma. Axial contrast enhanced CT (a), axial T2-weighted (b) and contrast enhanced T1-weigted (c) demonstrate a well circumscribed hypoattenuating on contrast enhanced CT, mildly increased signal intensity on T2-w and low signal intensity on contrast enhanced T1-weighted images. The mass abuts the portal vein, hepatic artery, and common bile duct with no evidence of vascular or biliary ductal obstruction
Focal Infectious Parenchymal Disease
Inflammation/Infection
As previously stated, infectious process usually starts by diffuse inflammatory process but later matures to well-defined abscess cavity. If imaged at that early stage (before formation of abscess), this area of focal inflammation demonstrates patchy ill-defined hypodense area on CT and demonstrates low signal intensity on T1-weighted images and high signal intensity on T2-weighted images with enhancement less than the surrounding liver parenchyma.
Liver Metastases
Metastases are far more common than primary malignant tumors of the liver, especially in the developed countries.
Various imaging patterns have been described for liver metastases; for descriptive purposes, these can be classified into:
Hypoenhancing: lesions demonstrating lesser enhancement than the surrounding liver parenchyma
Hyperenhancing: lesions demonstrating greater enhancement than the surrounding liver parenchyma
Cystic/necrotic: as previously described in the section of cystic lesions
Peripheral/ring enhancement (Algorithm 2.4)
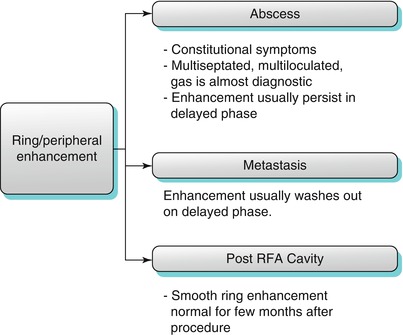
Algorithm 2.4
Several pathologies can demonstrate peripheral (or what is called “ring”) enhancement. The main entities demonstrating this pattern include metastasis, and abscess. Metastasis usually washes out in delayed phase, but abscess does not wash out. RFA cavity can demonstrate ring enhancement which is a normal finding that can persist several months after the procedure
Liver metastases are usually multiple and can have variable sizes and appearances.
T2-weighted images with fat-suppression and diffusion-weighted images are very important sequences in detecting liver metastases. This is particularly important in patients with fatty liver where small lesions can be easily missed in the non-fat-suppressed sequences due to relatively increased signal intensity of the liver [46]. Liver metastases are usually hypodense on precontrast CT, hypointense on T1-weighted images, and hyperintense on T2-weighted images and demonstrate various patterns of enhancement in the postcontrast sequences.
Peripheral enhancement is a characteristic pattern of enhancement in early phase after intravenous contrast administration phase (Fig. 2.19) [47], which can be typically described as peripheral early enhancement with or without progressive centripetal filling in the delayed phase. This pattern of peripheral enhancement could correlate to the highly vascularized outer portion of the tumor. In delayed phase, the center may enhance with occasional washout of the periphery (Fig. 2.21) [47, 48].
Fig. 2.21
Axial contrast-enhanced CT demonstrates a peripherally enhancing lesion (arrow) within segment VIII, consistent with metastatic deposit in a 72-year-old male patient with history of parotid carcinoma
Hypoenhancing Metastases: Some metastases enhance less than the surrounding liver parenchyma and thus appear hypodense relative to the surrounding liver parenchyma on contrast-enhanced CT and hypointense on contrast-enhanced T1-weighted images. Common primary tumors resulting in this pattern include the lung, gastrointestinal tract, prostate, transitional cell carcinoma, and breast (Fig. 2.22) [49]. Hypoenhancing metastases demonstrates minimal enhancement on arterial phase that can be more conspicuous on the interstitial phase [50]. In some cases, the hypoenhancing metastases can only be seen in the early enhancing phases as area of hypoenhancement compared to the enhancing liver background parenchyma; they then become isoenhancing with the liver parenchyma in delayed interstitial phase of contrast (Fig. 2.22).
Fig. 2.22
Axial contrast-enhanced CT demonstrating multiple hypoenhancing liver lesions (arrows), representing metastases in a 33-year-old male with history of testicular germ cell tumor
As previously described (under cystic lesions), metastases can appear cystic or necrotic with a resultant high signal intensity on T2-weighted images with no significant enhancement on various postgadolinium phases, and ovarian cancer metastases and post-treatment metastases are the main avascular metastases. Avascular metastases can be misdiagnosed as a simple cyst but can be differentiated through detection of the indistinct margins in the interstitial phase and size reduction of the metastases due to peripheral enhancement, while the simple cysts remain unenhanced and unchanged in size with well-defined borders [50].
Hyperenhancing Metastases: Metastases can enhance greater than the liver parenchyma. Common primary tumors leading to this pattern are neuroendocrine tumors, renal cell carcinoma, thyroid, melanoma, and breast. These tumors can demonstrate increased enhancement on arterial phases of postcontrast CT and MRI [51], with washout in the delayed phase; these features help to differentiate them from the flash-filling hemangioma (which retain contrast in delayed phase (Fig. 2.23).
Fig. 2.23
Axial Contrast-enhanced CT image demonstrating multiple enhancing lesions (arrows) compatible with metastatic carcinoid in a 72-year old woman with carcinoid
MRI (with its various pulse sequences) can help differentiate malignant from benign lesions. On routine T2 weighted images (TE around 90 ms), benign lesions (such as cysts and hemangions) demonstrate markedly increased signal intensity, as opposed to malignant lesions (such as metastases) which demonstrate mildly or moderately increased signal intensity. On heavily T2 weighted images (TE >160 ms), benign lesions demonstrate further increase in signal intensity, as opposed to malignant lesions which demonstrate less signal intensity and can appear isointense to the surrounding liver, may not be conspicuous and could be missed [50].
Teaching Points
Metastases can exhibit various morphologic and enhancement patterns. The nature of primary tumor plays a key role in the pattern of enhancement of metastases. Thus, metastases can be considered in the differential diagnosis of various patterns.
Hypovascular Hepatocellular Carcinoma
Hepatocellular carcinoma will be discussed under the category of arterially enhancing lesions as HCC most commonly manifests as arterially enhancing mass. However, hepatocellular can rarely appear as a hypovascular mass (Fig. 2.24).
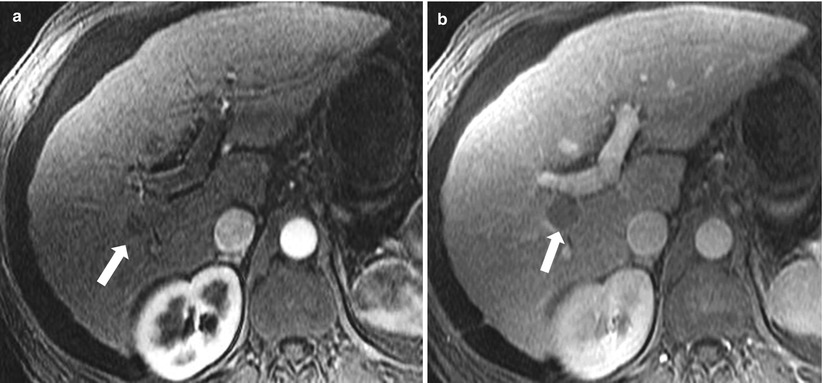
Fig. 2.24
Hypovascular HCC. Axial contrast enhanced T1-weighted images in arterial phase (a) and venous phase (b), demonstrating a single focus of hypoenhancement (arrow) which becomes more conspicuous in venous phase within the posterior segment of the right hepatic lobe, this was pathologically proven to represent HCC
Peripheral Washout Sign
The “peripheral washout sign” was reported in delayed 10-min postgadolinium MR images and appears as peripheral hypointense rim relative to the relatively enhancing center of the lesion (Fig 2.25) [47]. Peripheral washout sign indicates malignancy and has been described in some cases of hepatic metastases from carcinoid, breast, colon, and gastric cancers. Although this has been described in a 10-min delay after IV contrast administration on MRI, we are more frequently observing this pattern in standard delayed techniques and also on CT scan examinations.
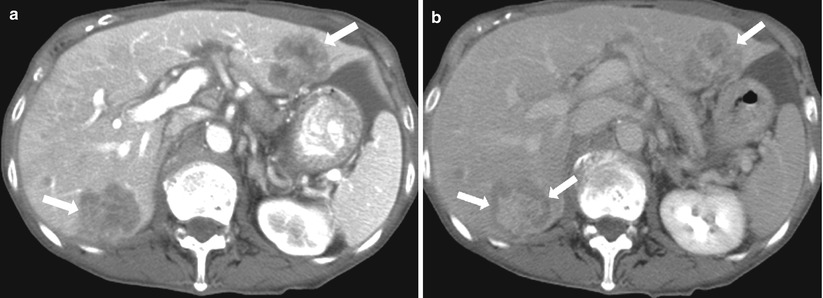
Fig. 2.25
Peripheral washout sign. Axial contrast enhanced CT in arterial phase (a), and delayed phase (b) demonstrate hypoattenuating lesions (arrows in a), with a peripheral hypoattenuating rim in delayed phase (arrow in b), consistent with metastatic deposits secondary to colon adenocarcinoma
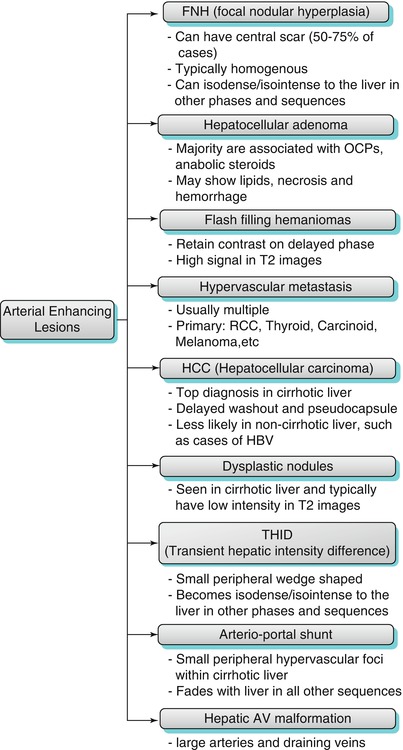
Arterial-Phase Enhancing Lesions (Algorithm 2.5)
These lesions demonstrate increased enhancement compared to the liver parenchyma on arterial phase after intravenous contrast administration:
Hepatocellular carcinoma
Focal nodular hyperplasia
Flash-filling hemangioma
Hepatocellular adenoma
Hyperenhancing metastases
Other less common causes of arterially enhancing lesions/pseudolesions:
AVF/AVM
THID/THAD
Aberrant gastric venous drainage
Hot spot sign
Angiosarcoma
Nodular regenerative hyperplasia
Inflammatory pseudotumor
Key Teaching Point
The main differential diagnoses for arterially enhancing lesions include hepatocellular carcinoma, focal nodular hyperplasia, adenoma, flash-filling hemangioma, and metastases. In the presence of cirrhotic features, HCC is the most likely diagnosis particularly when supported by enhancement washout and pseudocapsule in delayed phase. In the absence of cirrhosis, benign entities are more likely. Flash-filling hemangioma is specifically characterized by retention of contrast in delayed phase and increased signal intensity on T2-weighted image. In younger women of childbearing age, with history of oral contraceptive use, adenoma is the likely diagnosis. Central scar is present in about 50–70 % of cases of FNH. Pseudolesions are rarer but can mimic other more common diagnoses mentioned above.
Algorithm 2.5
The main differential diagnostic possibilities for arterially enhancing lesions are hepatocellular carcinoma (particularly in cirrhosis), focal nodular hyperplasia, fash filling hemangioma, adenoma and metastases. The clinical context and constellation of findings on other phases of enhancement and pulse sequences are helpful in reaching specific diagnosis. Rdiologists should be aware of the other rarer lesions (such as LRN) and pseudolesions (such as THID, AGVD and hot spot sign) which may mimic more aggressive pathologies
Hepatocellular Carcinoma (HCC)
HCC is considered the most common primary hepatic malignancy. The incidence is higher in cirrhotic liver as compared to the non-cirrhotic liver with hepatitis B is the major risk factor in the non-cirrhotic liver [52].
HCC is three times more common in men than women [53]. The difference in the 5-year survival rate for untreated symptomatic HCC in contrast to the survival rate in cirrhotic patients with small (<2 cm) HCC who have undergone liver transplantation is very impressive (5 and 80 %, respectively). This highlights the importance of early detection and treatment of HCC [52].
The pathogenesis of HCC begins with the development of benign regenerative nodules which in turn transform to dysplastic nodule. Dysplastic nodule is a premalignant lesion that finally progress to HCC [54].
MRI is better than CT in detection and characterization of HCC due to its superior contrast resolution, multiplanar imaging, and the ability to obtain serial dynamic imaging after IV administration of contrast using various pulse sequences. The combined use of all these features helps in superior characterization of hepatic nodules/masses and reaches a definitive diagnosis [55].
Larger HCCs >2 cm are more likely to follow the typical features of HCC, which have high signal intensity on T2-weighted images and low signal intensity on T1-weighted images with hyperenhancement on arterial phase and washout on delayed phase. The appearance of smaller HCCs <2 cm in MRI may vary as follows: on T2-weighted images, lesions may appear iso- to hyperintense to the surrounding liver, and on T1-weighted images, it is usually hypointense to the liver [55], and rarely HCC can contain high-protein content or less likely fat, which results in a high signal intensity on T1-weighted images.
The process of neoangiogenesis of HCC causes the specific features of HCC and renders the arterial phase of contrast-enhanced images to be the most sensitive sequence for detecting HCC [56], where the HCC shows moderate to intense enhancement in the early arterial postcontrast phase with gadolinium combined with washout on the delayed phase. These features are considered the only noninvasive radiological features in diagnosing HCC by the organization responsible for liver transplantation in the USA by the “United Network for Organ Sharing” {UNOS} [57]. Few HCC lesions are hypovascular and appear isointense with the liver parenchyma in the arterial postgadolinium phase, but show delayed washout in interstitial postgadolinium phase [58] (Fig. 2.26). This feature of delayed washout of the HCC can help in differentiating HCCs from other arterial enhancing lesions such s atypical hemangiomas (flash-filling hemangiomas), focal nodular hyperplasia, and hepatic adenomas.
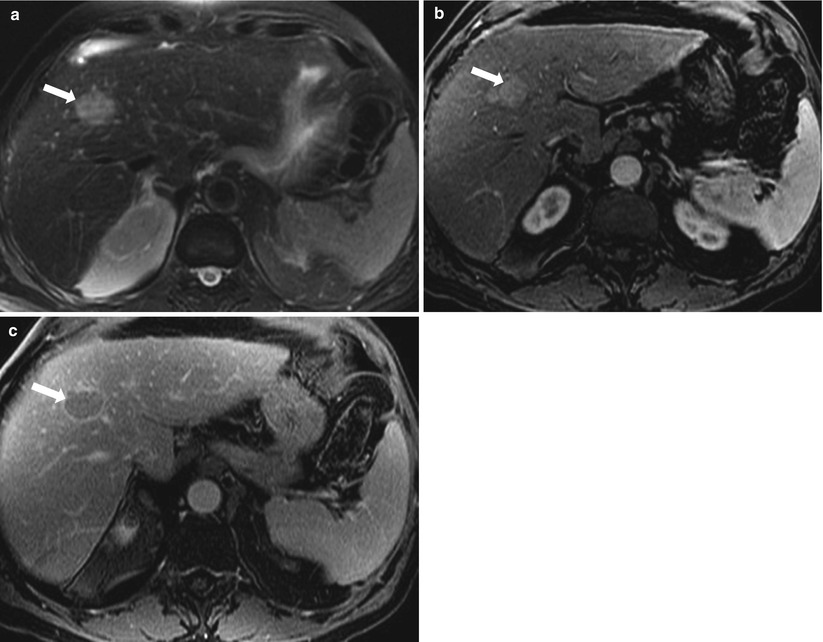
Fig. 2.26
HCC, axial fat-saturated T2-weighted image (a), axial contrast enhanced T1-weighted in arterial-phase (b) and delayed phase (c) demonstrate a focal lesion (arrow) exhibiting high signal intensity on T2-weighted image, homogeneous enhancement on arterial phase, and washout of enhancement as well as pseudocapsule (arrow) on delayed phase, consistent with hepatocellular carcinoma
Due to the development of the HCC from high-grade dysplastic nodules, there is an overlap between both entities. But there are some features that can be helpful in raising the suspicion of HCC over dysplastic nodules, such as development of new foci, larger size >2 cm, the presence of delayed enhancement washout, presence of a coexistent large HCC, and rapid interval growth of lesion (most reliable feature); while regression or disappearance of lesion on follow-up MR studies, small size of nodule <1.5 cm (in combination with the absence of a large coexistent HCC) is more consistent with dysplastic nodule.
Diffuse HCC occurs in 13 % of cases of HCC and appears as diffuse extensive heterogeneous permeative tumor often associated with portal vein thrombosis. These tumors appear as heterogeneous mottled moderate low signal intensity on T1-weighted images and moderate high signal intensity on T2-weighted images. These features are nonspecific and limit the ability of noncontrast sequences in detecting rather diagnosing the diffuse disease due to the similarity with the hepatic background. These tumors have patchy or nodular early enhancement pattern with enhancement washout and pseudocapsule enhancement on delayed phase [59].
Venous thrombosis associated with HCC is almost always affecting the portal veins. However, it can involve the hepatic veins. Tumor thrombosis is commonly high signal in T2-weighted images and enhances with gadolinium, in contrast to bland thrombus which appears hypointense in T2-weighted images and does not enhance with gadolinium [59]. On diffusion-weighted image, tumor thrombus demonstrates restricted diffusion, in contrast to bland thrombus which does not restrict diffusion.
Hepatocellular Adenoma
Hepatocellular adenomas (HCAs) are monoclonal hepatocellular benign epithelial neoplasms. Typically, 90 % of adenomas are described in young women with history of oral contraceptive [60]. Tumors typically involute spontaneously after patients withdraw from birth control pills. Other much less frequent associations include the use of anabolic steroids and disorders associated with abnormal carbohydrate metabolism [61]. Patients may present with a variety of symptoms, most commonly right upper quadrant abdominal pain, which is mostly related to hemorrhage into the tumor in 30 % of cases, and 10 % of adenomas transform into malignancy [62].
The histological hallmark consists of clusters of benign hepatocytes arranged in slender plates of cells. Neoplastic hepatocytes are separated by slit-like sinusoids and numerous thin-walled veins. Bile ducts are absent in internal structure of hepatocellular adenoma [63]. The typical MR appearance of adenoma is homogeneously mild hyperintensity on T2-weighted images. On T1-weighted images, homogeneously mild hypointensity, isointensity, or hyperintensity are described (Fig. 2.27). On postcontrast CT and MR images, homogeneous blush immediately after contrast has been described which uniformly fades to isodensity/isointensity relative to the liver parenchyma in the delayed phase. Some adenomas contain intracellular lipid yielding a drop in signal intensity on out-of-phase compared to in-phase pulse sequences.
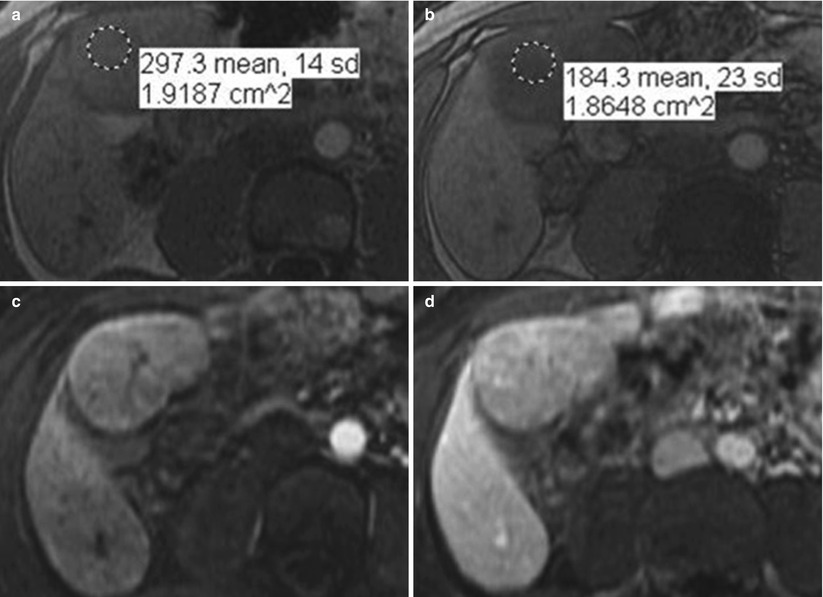
Fig. 2.27
Hepatocellular adenoma. Axial in-phase (a), and out-of-phase (b) demonstrating a well circumscribed mass (arrow), exhibiting homogeneous drop of signal on out-of-phase compared to in-phase secondary to the presence of intracellular lipid (microscopic fat), consistent with adenoma. Axial contrast enhanced T1-weighted images in arterial phase (c) and delayed phase (d) in a different patient demonstrating masses (arrows) exhibiting slight homogeneous enhancement in arterial phase and washout on delayed phase. Image courtesy, Christine Menias, Mayo Clinic, Arizona
Recently, hepatocellular adenomas have been classified into four subtypes (Table 2.2): hepatocyte nuclear factor-1α-mutated HCAs (HNF-HCAs), HCAs characterized by β-catenin mutations, inflammatory HCAs (I-HCAs), and miscellaneous category, which are due to different gene mutations. They have different pathological features which impact their features on imaging, the I-HCAs are the most common subtype and account for about 40–50 % of all hepatocellular adenomas, this typically appears hyperintense on T2-weighted images with intense arterial enhancement that persist in the venous and delayed phases, while the HNF-HCAs represent the second most common type of hepatocellular adenoma and constitute about 30–35 % of all hepatocellular adenomas and show diffuse steatosis which appears as homogeneous high signal in T1-weighted images with moderate arterial enhancement that does not persist into the venous phase, and lastly the HCAs with β-catenin have no specific features and generally shows arterial enhancement with portal venous washout, which make it very difficult to distinguish from HCC [64, 65] (Table 2.3).
Table 2.2
Classification of hepatocellular adenoma [64, 65]
Type | Incidence (%) | Symptoms | Malignant transformation | Hemorrhage |
|---|---|---|---|---|
Inflammatory | 40–50 | Young female, history of OCP and obese | 10 % show increased risk of malignancy | 20–25 % Tumors >5 cm (the highest risk of bleeding: 30 %) |
Chronic anemia | ||||
Systemic inflammatory syndrome: fever, ↑WBC, ↑CRP | ||||
HNF-1alpha mutated | 30–35 | Asymptomatic, discovered incidentally | Minimal or no risk | Tumors<5 cm show minimal risk of bleeding |
B-catenin mutated | 10–15 | Asymptomatic, but can be occasionally symptomatic if bleeds | 5–10 % | Has a risk of bleeding, exact incidence is unknown |
Table 2.3
MR imaging features of hepatocellular adenomas [64, 65]
Type | T1-WI | T2-WI | Chemical shift | Arterial phase | Venous and delayed phase |
|---|---|---|---|---|---|
Inflammatory | Isointense or mildly ↑ | ↑ signal | No signal drop | Intense enhancement | Persistent enhancement |
HNF-1alpha mutated | Isointense or ↑ | Intense to slightly ↑ | Intracellular lipid content → signal drop | Moderate enhancement | Enhancement doesn’t persist |
B-catenin mutated | Nonspecific | Nonspecific | Nonspecific | Marked enhancement | Possible washout |
Dysplastic Nodules
Dysplastic nodules represent intermediate step in the pathway of carcinogenesis of hepatocytes in cirrhotic liver. These are considered as premalignant nodules and are found in about 20 % of cirrhotic livers. Some studies have documented the development of HCC within a dysplastic nodule in few months. Dysplastic nodules appear most commonly as isointense or hypointense on T2-weighted images and isointense to hyperintense on T1-weighted images [66]. Unlike regenerative nodules, dysplastic nodules have been found to contain isolated arteries, with documented correlation between the extent of enhancement on arterial phase and the grade of dysplastic nodules; the greater the degree of arterial enhancement of the nodule, the more likely the potential of malignant transformation of HCC [67]. However, dysplastic nodules have the tendency to fade toward background signal of the liver in the interstitial and delayed phase of enhancement, which help in its differentiation from the small HCC which are most likely to exhibit enhancement washout with delayed capsule enhancement. Other features that can help differentiate dysplastic nodules from HCC include: high signal intensity of HCC on T2-weighted images. Foci of small HCC, which develop in the high-grade dysplastic nodules, appear as high signal intensity foci within low signal intensity nodule on T2-weighted images (nodule within a nodule sign) [68].
Related posts:
Stay updated, free articles. Join our Telegram channel

Full access? Get Clinical Tree


