Fig. 20.1
Graphical illustration of the prostate in relation to the other male pelvic organs. The prostate encases the proximal urethra (prostatic urethra) and is intimately bound to the bladder neck at the base and urogenital diaphragm at the apex. The posterior surface is separated from the rectum by the rectovesical septum (Denonvillier’s fascia)
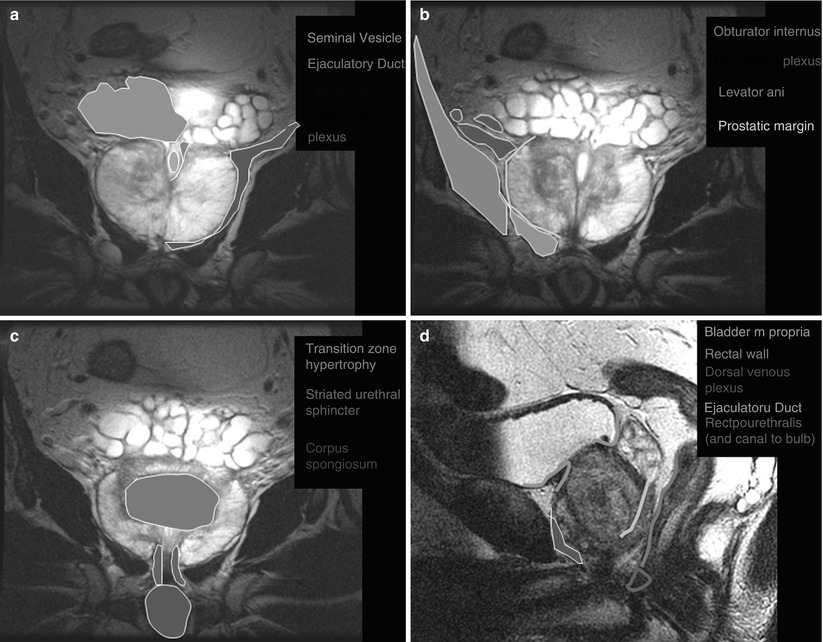
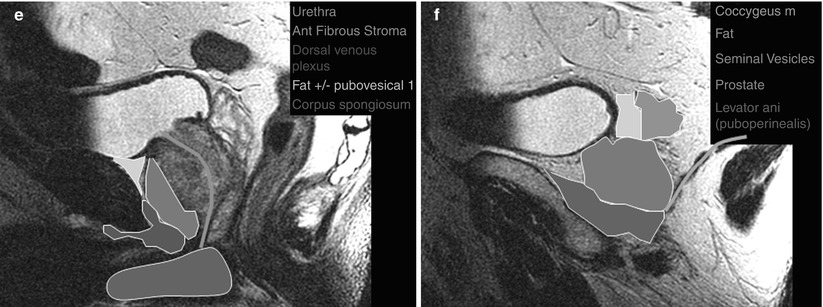
Fig. 20.2
Coronal (a–c) and sagittal (d–f) MR images of the prostate with superimposed illustrations identifying the prostate and related structures (Images provided by Dr. M.A. Haider)
Histologically, two-thirds of the prostate is composed of glandular tissue, and the additional third is nonglandular, namely, smooth muscle fibers, the prostatic urethra, and the anterior fibromuscular band [2, 3]. The prostate is typically divided into four zones (Fig. 20.3) as proposed by McNeal, each containing an increasing amount of glandular tissue and consequently an increasing incidence of prostate carcinoma [4]:
The anterior fibromuscular zone or anterior fibromuscular stroma accounts for less than 5 % of the prostate weight and contains nonglandular components such as muscle and fibrous tissue.
The transition zone surrounds the proximal prostatic urethra and accounts for approximately 10 % of the prostate weight. It is the location for approximately 25 % of prostate carcinoma [4]. In benign prostatic hypertrophy (BPH), it is this zone that enlarges.
The central zone surrounds the ejaculatory ducts, constitutes approximately 25 % of the prostatic volume, and is responsible for 14–25 % of prostate cancer [4, 5].
The peripheral zone occupies the posterior and inferior aspects of the prostate gland, surrounds the distal prostatic urethra, and constitutes 60 % of the prostate volume. Approximately 70 % of all carcinoma originates in the peripheral zone [4].
Fig. 20.3
3D graphical illustration of the prostate with corresponding axial drawings at the base, mid-gland, and apex. The central zone (pink) is seen surrounding the ejaculatory ducts at the base and mid-gland. The transitional zone (red) surrounds the proximal prostatic urethra. The peripheral zone (brown) occupies the posterior and apical gland, constituting between 60 and 70 % of the normal prostate’s volume. Paired neurovascular bundles run posterolateral to the prostate gland
Imaging Modalities
Direct imaging of the prostate is generally reserved for clinical suspicion of cancer, with MRI and ultrasound being the most commonly used and effective modalities. However, other imaging modalities offer value in the staging and posttreatment monitoring of prostate cancer.
Radiography
Radiography cannot be used to visualize the prostate directly, although calcifications within the prostate can be visualized and indicate glandular enlargement if extending above the pubic symphysis. Radiographs may be useful in the evaluation of bone pain in prostate cancer (Fig. 20.4), excluding degenerative bone changes as a cause for abnormal foci in radionuclide bone scans, or follow-up of osseous metastasis [6, 7].
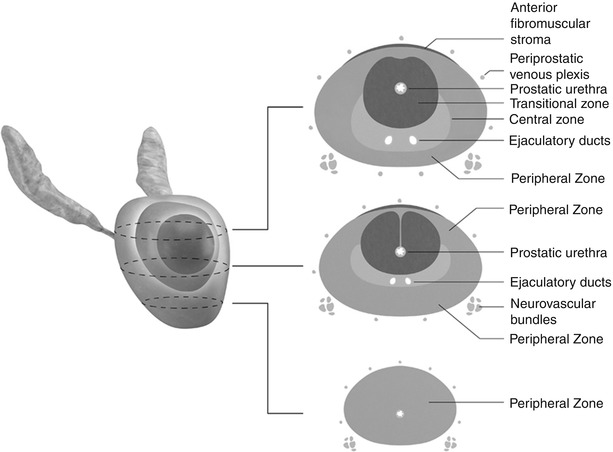
Fig. 20.4
Frontal (a) and lateral (b) radiographs of the thoracolumbar spine showing contiguous sclerotic change involving the T11, T12, and L1 vertebral bodies (white arrows) consistent with metastatic prostate carcinoma
Ultrasound
Gray-scale ultrasound has proven unsuccessful for the detection and local staging of prostate cancer due to limitations in spatial resolution and tumor contrast (Fig. 20.5) [8–10]. The most common appearance of prostate cancer on transrectal ultrasound (TRUS) is an ill-defined hypoechoic region compared to adjacent parenchyma, but it can be isoechoic in up to 30 % of patients. Only rarely is prostate cancer hyperechoic [9, 11].
The addition of color Doppler and power Doppler to TRUS has been shown to increase cancer detection but not improve staging accuracy [6, 12–14]. Contrast-enhanced ultrasound may further increase the accuracy of TRUS prostate cancer detection and staging; however, additional multicenter trials are required.
The most important role for ultrasound in prostate imaging is for biopsy guidance, and TRUS-guided prostate biopsy remains the most commonly used method for confirming the presence of cancer. TRUS has several benefits including safety, portability, low cost, and the ability to perform real-time imaging and image-guided procedures in an office setting.
As noted previously, limitations in the visualization of prostate cancer with ultrasound have led to random sampling strategies, commonly using 12 cores. However, random sampling of the prostate with 12 cores has a reported sensitivity for cancer detection of 53–68 % when compared to whole-mount specimens [15, 16]. To overcome this limitation, various degrees of MRI guidance (MRI-US fusion and MRI guided) have recently been utilized with some success.
Transabdominal ultrasound of the pelvis (bladder and prostate) is most appropriate for the evaluation of obstructive voiding symptoms, with BPH being a common potentially treatable cause [6]. Prostate volume can be equally evaluated by either transabdominal or transrectal (TRUS) ultrasound [17]. Prostate volume is determined using the standard equation for the volume of an ellipsoid:
 Prostate volume is also used to determine PSA density (serum PSA/prostate volume), an important factor in several staging and predictive nomograms [18].
Ultrasound elastography using compression and decompression techniques can be used in the detection of prostate cancer. Cancerous regions have been shown to be stiffer than surrounding tissue, and studies have reported sensitivities for cancer detection ranging from 84 to 88 % [16].
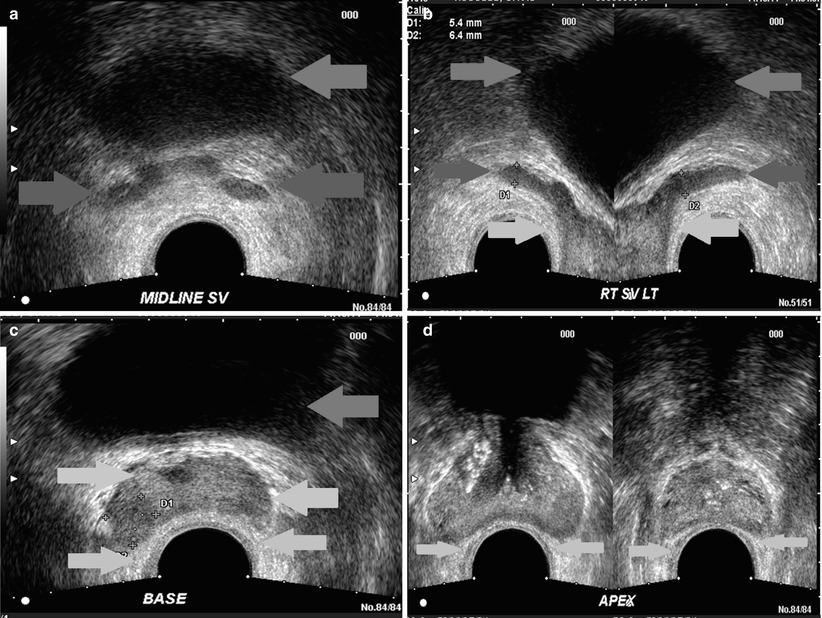
Fig. 20.5
Multiple transverse sonographic images of the prostate performed by transrectal approach, from the seminal vesicles (a), (b), base of the prostate (c), midgland (left d) and apex (right d). Green arrow, bladder; red arrow, seminal vesicles; yellow arrow, rectoprostatic angle; light blue arrow, urethra; purple, peripheral zone (note, the zonal anatomy of the prostate is poorly visualized sonographically)
Computed Tomography
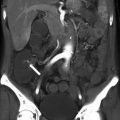
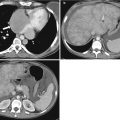
In prostate cancer patients with the highest risk disease (clinical T2c disease or higher, PSA >20 ng/ml, or Gleason score >8), CT of the chest, abdomen, and pelvis, along with radionuclide bone scans, can be useful for detecting nodal, visceral, or osseous metastases [6]. For patients with PSA values up to 20 ng/ml, the positive yield of CT for detection of local or distant metastases is less than 12 % [19]; therefore, there is little value to initial staging with CT in low- to intermediate-risk patients [20].
Due to poor soft tissue contrast, CT is unfit for primary detection of prostate cancer or for local recurrence in the surgical bed unless the recurrence is large (>2 cm) [21]. CT has replaced lymphography for evaluation of nodal disease, with sensitivities between 27 and 75 % and specificities between 66 and 100 % for nodes >1.0 cm [6]. CT is also valuable in the planning and assessment of brachytherapy [22].
CT is of little use in the evaluation of an enlarged prostate [23] but can be valuable in the suspicion of abscess formation in prostatitis.
Magnetic Resonance Imaging
MRI of the prostate provides the highest spatial resolution and tumor contrast of all imaging modalities. Prostate imaging can be performed with or without an endorectal coil, although at 1.5 T current recommendations suggest endorectal coil use to ensure adequate signal-to-noise ratios for small field-of-view imaging (12–16 cm) at a high spatial resolution (0.5 mm) [6]. Consensus recommendations suggest T2-weighted, diffusion-weighted, and contrast-enhanced imaging at 1.5 T to constitute the minimal imaging requirements [24]. Optimal requirements suggest the addition of an endorectal coil or, alternatively, imaging at 3 T. There is insufficient evidence to definitively prove superiority of imaging at 3 T versus 1.5 T [6]. However, recent evidence suggests that the inherent spatial and temporal resolution advantages of imaging at 3 T with an endorectal coil are beneficial for cancer localization and characterization [25, 26].
Radionuclide Studies
Radionuclide bone scans are not recommended in low-risk patients because of their low yield and are therefore reserved for the following clinical situations: PSA ≥20 ng/ml (with any T stage or Gleason score), locally advanced disease (T3 or T4 with any PSA or Gleason score), or Gleason ≥8 (with any PSA or T stage) [6].
A Tc99m-MDP bone scan is the recommended first test when there is suspicion of prostate cancer recurrence post prostatectomy, radiation, or androgen deprivation therapy [6]. A positive bone scan would be confirmatory, and no additional studies are required (Fig. 20.6). However, studies have shown that bone scans are limited until PSA rises above 30–40 ng/ml [27]. Inconclusive bone scans warrant additional investigation with CT for nodal involvement or MRI and ultrasound for local recurrence.
Newer techniques such as 18F–FDG (18F-fluorodeoxyglucose) and 11C–choline PET/CT (among other tracers) are emerging as useful imaging tools to stage prostate cancer and evaluate recurrence. A 2010 meta-analysis shows that 18F-FDG PET and 18F-FDG PET/CT are more effective than Tc99m MDP at diagnosing bone metastases [28]. However, the role for PET/CT in newly diagnosed and recurrent prostate cancer is still being evaluated.
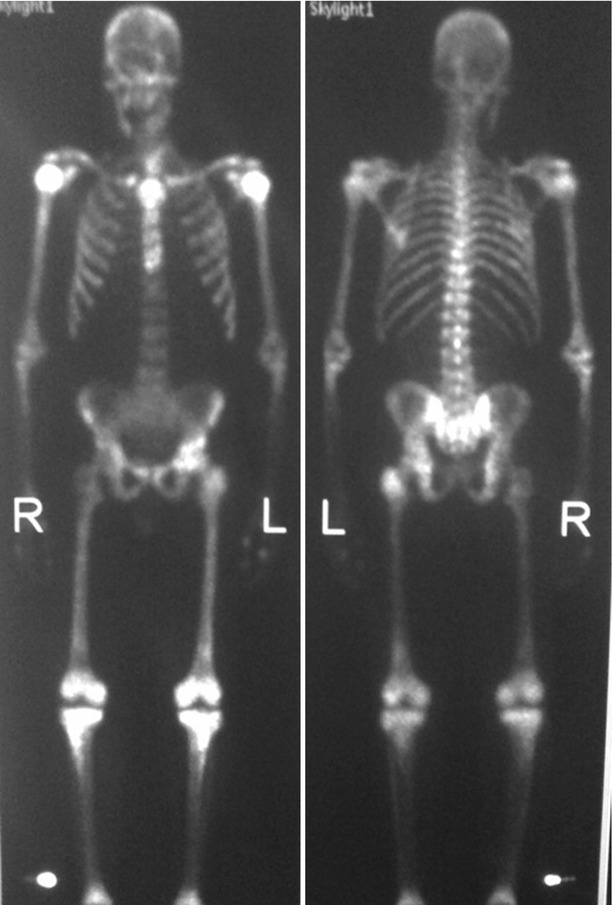
Fig. 20.6
Tc99m-MDP bone scan (AP on the left and PA on the right) in a patient with known prostate carcinoma. Bone scan reveals diffuse radiotracer uptake through the axial and appendicular skeleton without renal excretion (superscan) characteristic of diffuse metastases
Pathologic Conditions of the Prostate
Congenital ectopia and agenesis of the prostate are extremely rare and often associated with additional urogenital tract anomalies.
Congenital hypoplasia of the prostate is found on patients with prune belly syndrome and may be explained as a pressure-induced dysplasia rather than a primary maldevelopment, most likely from either anatomic or functional obstruction [29].
Congenital Prostate Cysts
Congenital cysts, although relatively uncommon, are the most frequently observed congenital abnormality of the prostate. The location of the cyst provides valuable insight as to the potential origin and forms a basis for organizing a differential diagnosis.
Median Cysts
These are cysts located in the midline and posterior to upper half of the prostatic urethra and include utricular and Mullerian duct cysts. Utricular cysts are the most common congenital cyst, resulting from a dilatation of the prostatic utricle rising from the verumontanum that communicates with the posterior prostatic urethra. These cysts are occasionally diagnosed in childhood due to an association with hypospadias, cryptorquidism, and pseudohermaphroditism [30].
Mullerian duct cysts are rare remnants of the Mullerian duct. They are connected to the verumontanum by a thin stock, may rise above the prostate into the retrovesicular space, and do not communicate with the urethra, distinguishing them from utricular cysts. Mullerian duct cysts are usually asymptomatic but can in early adulthood present with urinary tract infection, urinary retention, hematuria, or lower abdominal pain. Stones are commonly found within it and are virtually diagnostic. These cysts may contain endometrial, clear cell, or squamous cell carcinoma; however, malignant transformation is a rare complication [2, 31].
Paramedian Cysts
Lateral Cysts
These more laterally located cysts include seminal vesicle cysts and prostatic cysts. They are commonly symptomatic presenting with hematuria, hematospermia, or post-ejaculatory discomfort among other symptoms. These cysts frequently protrude into the bladder. There is a clear association with ipsilateral renal agenesis, and the fluid contents are frequently hemorrhagic [31].
Acquired Cysts
These include degenerative cysts due to benign prostatic hyperplasia, ejaculatory duct cysts, retention cysts, cystic carcinoma, abscesses, and parasitic cysts [31].
Cystic degeneration of benign prostatic hyperplasia (BPH) is by far the most frequently observed cystic lesion of the prostate, located in the hyperplastic transition zone and within nodules [31]. Unlike the other prostatic cysts previously discussed, degenerative cysts are usually multiple in number. In BPH, these cysts are indistinguishable from retention cysts caused by obstruction of prostatic glandular ducts.
Ejaculatory duct cysts are rare and related to an obstruction of the duct, either congenital or inflammatory. They may cause dysuria and perineal and ejaculatory pain. These cysts contain normal spermatozoa (which help to distinguish from a Mullerian duct or utricular cysts), and sometimes intracystic calculi are demonstrated.
Benign Prostatic Hypertrophy
BPH is the result of stromal proliferation, remodeling, and the formation of numerous benign hyperplastic (fibromyoadenomatous) nodules within the transition and periurethral zones, causing subsequent enlargement of the entire prostate [32]. BPH is a common disorder in men over 50 years of age, progressively increasing in incidence and effecting over 80 % of men over 80 [33].
Although the exact cause is unclear, BPH is thought to be multifactorial and related to family history, testosterone, estrogen, and dihydrotestosterone exposure.
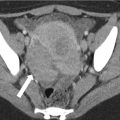
Symptoms of BPH are related to progressive prostatic enlargement and protrusion into the bladder with compression of the adjacent prostatic urethra (Fig. 20.7). This results in lower urinary tract symptoms including increasing frequency, nocturia, urgency, hesitancy, and a reduction in urinary flow.
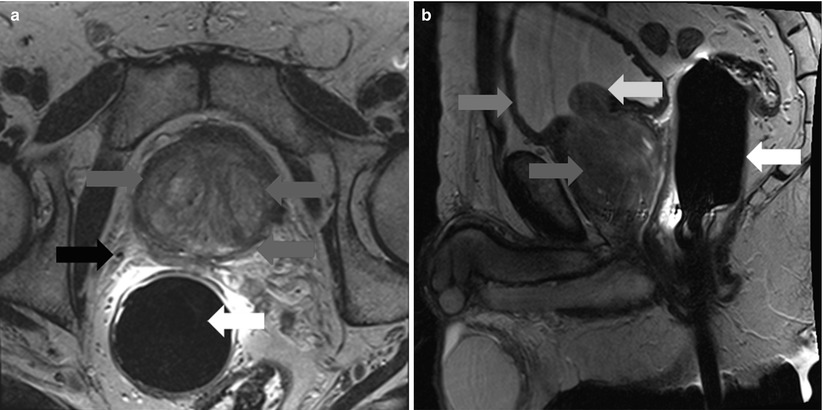
Fig. 20.7
Axial (a) (left) and sagittal (b) (right) T2-weighted MR images of the prostate in a patient with BPH. There is marked expansion of the transition zone (blue arrows) resulting in compression of the peripheral zone (red arrow) and compression of the bladder trigone (yellow arrow). Green arrow – anterior bladder wall
Prostatitis
Prostatitis-like symptoms resulting from acute or chronic bacterial prostatitis are common complaints in men with a lifetime prevalence of 10–15 % [34]. The presentation is variable, although most patients with acute bacterial prostatitis appear ill with fever and chills, irritative, and occasionally obstructive urinary symptoms [35]. Symptoms may subside but persist, continuing to chronic prostatitis and chronic pelvic pain syndrome.
Imaging in prostatitis is generally only indicated for the detection of abscess formation. CT findings may show a diffusely enlarged, edematous gland in prostatitis and a rim-enhancing, low attenuation mass in abscess [36]. Ultrasound findings include focal hypoechoic regions, inseparable from malignancy, while focal fluid collections suggest abscess formation [37]. On MRI, prostatitis can be indistinguishable from cancer, presenting as a focal region of low signal intensity on T2-weighted imaging, often localized to the peripheral zone (Fig. 20.8). Diffusion-weighted imaging may be of value in distinguishing prostatitis from cancer. However, although mean apparent diffusion coefficient (ADC) values in prostatitis are significantly higher than in cancer, there is considerable overlap between these two processes, making definitive diagnosis difficult [38, 39].
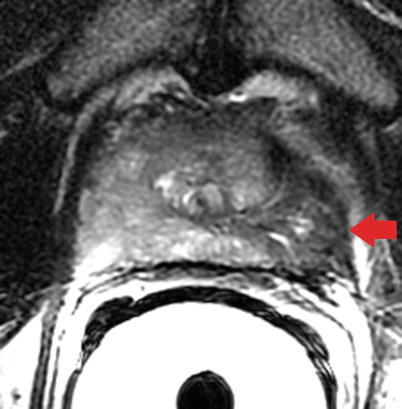
Fig. 20.8
Axial T2-weighted MR image of the prostate in granulomatous prostatitis. Note the wedge-shaped region of low signal intensity in the left peripheral zone (red arrow) mimicking cancer with extraprostatic spread. The absence of mass effect may often differentiate cancer from prostatitis on T2-weighted imaging (Image provided by Dr. M.A. Haider)
Prostate Cancer
Overview
Prostate cancer is the second most common cancer in men worldwide, accounting for an estimated 28,170 deaths in 2012 [40]. The clinical course of prostate cancer ranges from microscopic, well-differentiated, clinically insignificant tumors to aggressive, high-grade disease with metastases and death. Prostate cancer screening is performed via digital rectal exam or prostate-specific antigen testing.
Digital rectal exam is insensitive and limited to palpation of the peripheral zone. While PSA measurement has been instrumental in the success of prostate cancer screening, there is little evidence to suggest it has had a significant impact on cancer-related mortality [41]. In addition, PSA values are normal in 15 % of men with disease found on prostate biopsy. PSA can be taken alone or combined with prostate size to determine PSA density, or previous values to determine PSA velocity. Separating bound and unbound forms of PSA can be used as an additional input into several staging nomograms.
Clinical suspicion of prostate cancer either by abnormal digital rectal exam or elevated prostate-specific antigen (PSA) usually results in TRUS-guided biopsy (Fig. 20.9). If the biopsy is negative but clinical suspicion persists, MRI is often indicated as the next investigation.
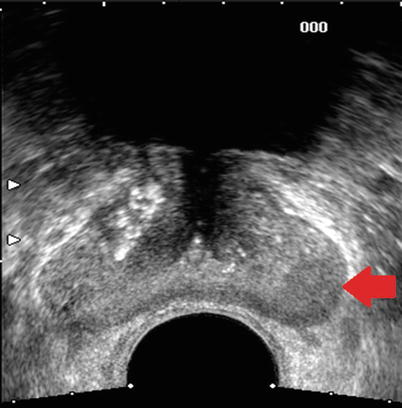
Fig. 20.9
Transverse sonographic image of the prostate in a patient with biopsy-proven prostate cancer. Red arrow points to an area of decreased echogenicity in the left peripheral zone shown to be cancer on subsequent TRUS biopsy
Gleason Score
The Gleason score assigned to a tumor has been shown to correlate with biologic activity and prognosis. The Gleason score is a sum of the major and minor subcomponents of a tumor, with each subcomponent graded on a 1–5 scale. For example, a tumor assigned a major subcomponent score of 4 and minor subcomponent score of 3 would result in a Gleason 7 (4 + 3) tumor. It is important to include the subcomponent scores, particularly for Gleason 7 tumors, as the biologic behavior of a Gleason 7 (3 + 4) tumor is thought to differ from a Gleason 7 (4 + 3) tumor.
TMN Staging
The American Joint Committee on Cancer TMN system is commonly used for predicting the risk of extraprostatic disease (or alternatively, the likelihood of cure):
Primary tumor (T) (Fig. 20.10) | |
|---|---|
TX | Primary tumor cannot be assessed. |
T0 | No evidence of primary tumor. |
T1 | Clinically imperceptible tumor neither palpable nor visible by imaging. |
T1a | Tumor incidental histologic finding in 5 % or less of tissue resected |
T1b | Tumor incidental histologic finding in more than 5 % of tissue resected |
T1c | Tumor identified by needle biopsy (e.g., because of elevated PSA) |
T2 | Tumor confined within prostate (found in one or both lobes by needle biopsy but not palpable or reliably visible by imaging) |
T2a | Tumor involves one-half of one lobe or less. |
T2b | Tumor involves more than one-half of one lobe but not both lobes. |
T2c | Tumor involves both lobes. |
T3 | Tumor extends through the prostate capsule. |
T3a | Extracapsular extension (unilateral or bilateral). |
T3b | Tumor invades seminal vesicle(s). |
T4 | Tumor is fixed or invades adjacent structures other than seminal vesicles such as the external sphincter, rectum, bladder, levator ani muscles, and/or pelvic wall. |
Regional lymph nodes (N) | |
|---|---|
NX | Regional lymph nodes were not assessed. |
N0 | No regional lymph node metastasis. |
N1 | Metastasis in regional lymph node(s). |
Distant metastasis (M) (Fig. 20.11) | |
|---|---|
M0 | No distant metastasis |
M1 | Distant metastasis |
M1a | Nonregional lymph node(s) |
M1b | Bone(s) |
M1c | Other site(s) with or without bone disease |
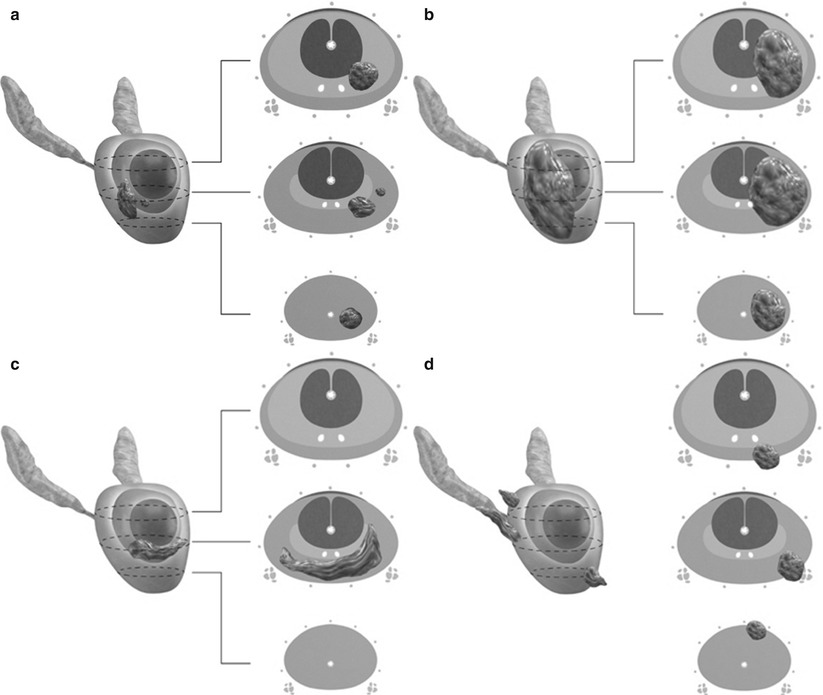
Fig. 20.10
Stages of prostate carcinoma. (a) T1 and T2a tumors are confined to the prostate and occupy one-half of one lobe or less. T1 tumors are clinically imperceptible by palpation or imaging, whereas T2a tumors may be palpable or detected radiographically. (b) T2b tumor involves more than half of one lobe but not both lobes and is confined to the prostate without extraprostatic spread. (c) T2c tumor involves both lobes. (d) T3 tumor extends beyond the anatomic limits of the prostate. T3a tumors demonstrate extracapsular extension without invading the seminal vesicles, while T3b tumors invade one or both seminal vesicles
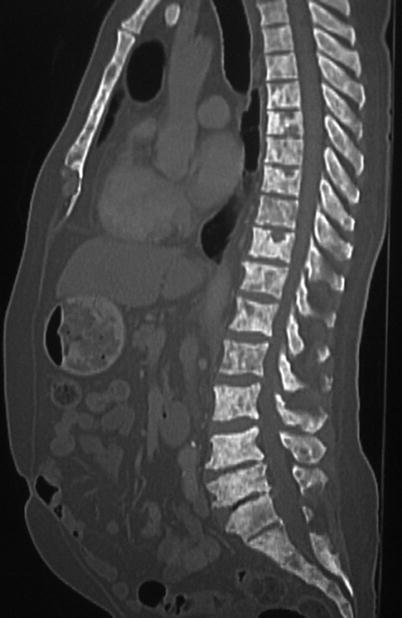
Fig. 20.11
Sagittal CT image of the thoracolumbar spine demonstrates diffuse sclerotic lesions throughout the spine and visualized sternum in a patient with known high-grade prostate cancer, consistent with prostate metastases
Risk Stratification
Numerous nomograms have been created to predict the probability of local invasion and distant metastases [42]. Such nomograms usually combine PSA level, Gleason score, and T stage (obtained by physical exam) to divide patients into the following categories:
Low risk | Clinical stage T1c or T2a and PSA ≤10 ng/ml and Gleason ≤6 (80 % 10 year PSA failure-free survival rate) |
Intermediate risk | Clinical stage T2b or PSA >10 but ≤20 ng/ml or Gleason 7 (50 % 10 year PSA failure-free survival rate) |
High risk | Clinical stage T2c or PSA >20 ng/ml or Gleason ≥8 ng/ml (33 % 10 year PSA failure-free survival rate) |
MR Imaging Requirements
While 3 T imaging of the prostate results in higher signal-to-noise ratio and shorter acquisition times, prostate imaging can be adequately performed at 1.5 T [43]. At both 1.5 T and 3 T, endorectal coils have been shown to improve image quality and improve staging performance compared to pelvic phased-array coils (Figs. 20.12, 20.13 and 20.14), although the need for an endorectal coil at 3 T is debatable. At the most commonly used field strength of 1.5 T, an endorectal coil is suggested for sufficient signal-to-noise ratio and adequate spatial resolution to allow for cancer localization in a clinically reasonable time frame [43].
However, the use of an endorectal coil requires additional time, incurs additional costs, can cause patient discomfort, and can result in minor complications [44].
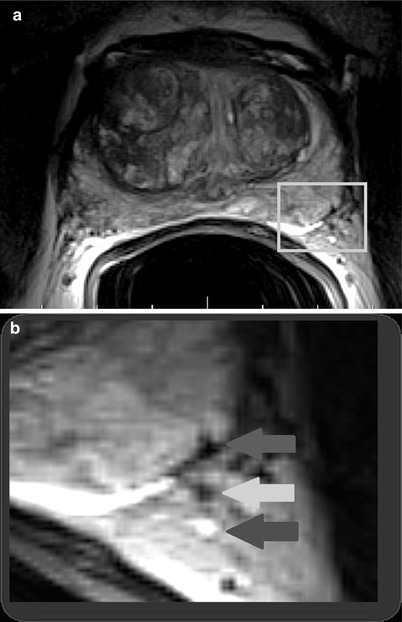
Fig. 20.12
T2-weighted axial MR image (a) acquired with an endorectal coil at the level of the mid-gland depicting the left neurovascular bundle posterolaterally (yellow box). Magnified view (b) better depicts the intimate relationship between the prostate margin (red arrow) and neurovascular bundle (yellow and blue arrows), which supplies the corpora cavernosa and is essential for normal erectile function (Images provided by Dr M.A. Haider)
Structured Reporting
A scoring system for multiparametric prostate MRI (PI-RADS) [24] similar to that used by breast radiologists has been recommended and prospectively evaluated. This system suggests a minimal requirement dividing the prostate into 16 regions and optimally into 27 regions, noting the presence or absence of cancer in each. In their guidelines [24], the authors propose a five-point scoring system for each MR technique (T2-weighted, diffusion-weighted, dynamic contrast-enhanced, and MR spectroscopy) and combining each to create an overall composite PI-RADS score predicting the likelihood of clinically significant disease:
Score 1 – Clinically significant cancer highly unlikely
Score 2 – Clinically significant cancer unlikely
Score 3 – Clinically significant cancer equivocal
Score 4 – Clinically significant cancer likely to be present
Score 5 – Clinically significant cancer highly likely to be present
Anatomic T2-Weighted Imaging
High resolution, small field-of-view T2-weighted imaging serves a key role in anatomic imaging of the prostate, clearly differentiating the intermediate to high signal intensity of the peripheral zone from the low signal intensity central and transition zones in most patients. T2-weighted images are acquired in three dimensions with left-to-right phase encoding to ensure motion artifact does not overlap with the prostate. Bowel motion is minimized by use of antiperistaltics.
Related posts:
Stay updated, free articles. Join our Telegram channel

Full access? Get Clinical Tree


