Fig. 23.1
Arterial anastomoses include the more common end-to-side allograft renal artery to native external iliac artery anastomosis (a) and the older, less common end-to-end allograft renal artery to the native internal iliac artery (b)
Fig. 23.2
Venous anastomosis typically consists of end-to-side anastomosis of the allograft renal vein to the native external iliac or corresponding vein
Fig. 23.3
The donor ureter or pelvis may be anastomosed to the bladder after creation of a submucosal tunnel near the trigone (a, inset) or may be anastomosed end to end to the native ureteral remnant (b) or ileal conduit (c)
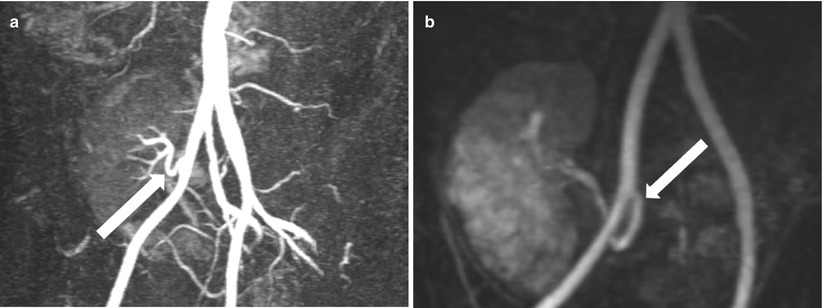
Fig. 23.4
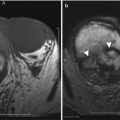
Contrast-enhanced MRA demonstrates end-to-side renal artery to external iliac artery (a) and end-to-end renal artery to internal iliac artery (b)
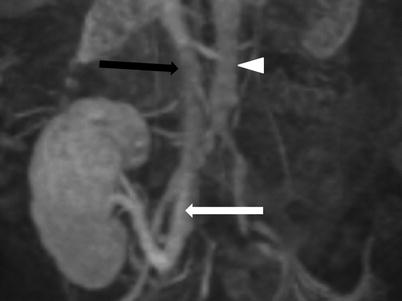
Fig. 23.5
Contrast-enhanced MRV demonstrates end-to-side renal vein to external iliac vein (white arrow). Note the inferior vena cava (black arrow) and the aorta (arrow head)
Renal Transplant Pathology
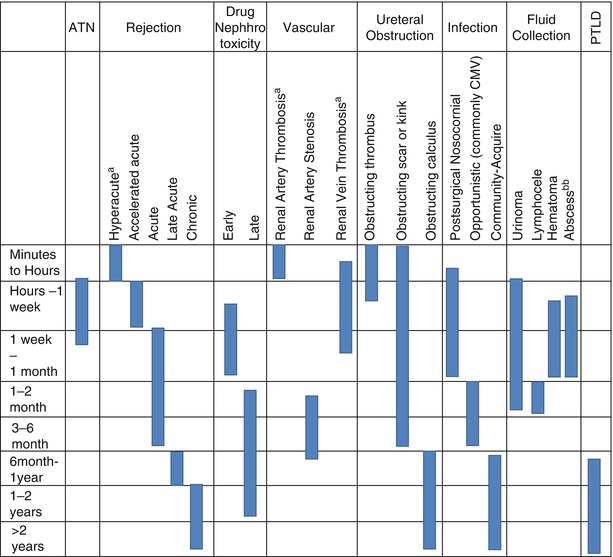
The pathologic processes and complications that affect renal transplant patients are closely dependent on age of the transplant. Early complications occur in the first few weeks posttransplantation and typically include acute rejection, acute tubular necrosis, bleeding, infection, urine leak, ureteral obstruction renal artery stenosis, and renal vein thrombosis. With some overlap, late complications occur after the first month posttransplantation and most commonly include chronic rejection, ureteral obstruction, lymphocele, renal cysts, and malignancy [3] (Tables 23.1 and 23.2).
Parenchymal | Vascular | Urologic | Infections | Collections | Malignancy |
|---|---|---|---|---|---|
Rejection (hyperacute, acute, chronic) | Infarction | Hydronephrosis | Pyelitis | Hematoma | Posttransplant lymphoproliferative disease |
Acute tubular necrosis | Renal artery stenosis and pseudo stenosis | Nephrolithiasis | Pyelonephritis | Seroma | Urothelial carcinoma |
Drug toxicity | Pseudoaneurysm | Ureteral necrosis | Pyonephrosis | Lymphocele | Renal cell carcinoma |
Renal artery and vein thrombosis | Ureteral stricture | Renal abscess | Perirenal abscess | Extrarenal malignancy | |
Thrombotic microangiopathy | Leak | Urinoma | |||
Arteriovenous fistula | |||||
Arteriovenous malformations |
Cross-Sectional Modalities and Techniques
Several noninvasive imaging techniques have been developed and improved over recent years that facilitate detection of both vascular and nonvascular postoperative complications as well as diagnosis of other diseases related to the transplanted allograft. While biopsy is typically needed for definitive diagnosis in many of these cases, note should be made of the role imaging plays in guiding these procedures.
Ultrasound
Ultrasound (US) is usually the first-line imaging modality with morphologic visualization of the renal parenchyma and measuring the resistive indices. The general appearance of the transplanted kidney is similar to that of the normal native kidney, with the caveat that more detail is evident in renal transplants, as they are generally close to the US transducer (Fig. 23.6). The normal renal transplant may be expected to be 30–100 % larger to the normal native kidney. As with native kidneys, the medullary pyramids are hypoechoic to the renal cortex and the fatty renal sinus hyperechoic. Mild pelviectasis may be present due to loss of tone or urinary bladder distension, but hydronephrosis is abnormal. Similarly, the walls of the collecting systems and ureters should be imperceptible. US is also useful in the evaluation of the peritransplant space, where fluid collections may be present. Use of color Doppler US (CDUS) and spectral analysis greatly enhances evaluation of the renal transplant. CDUS allows evaluation of the main renal vessels as well as the vascularity of the renal parenchyma. The normal renal allograft should show diffusely brisk perfusion arborization with spectral analysis demonstrating a peak systolic flow (PSV) <200 cm/s in the main renal artery (MRA) and low-resistance intrarenal waveform with sharp upstrokes and resistive indices (RI) of 0.55–0.7. As a final note, US is also invaluable as imaging guidance during procedures, such as biopsies, which are ultimately needed in many situations [2, 5, 6].
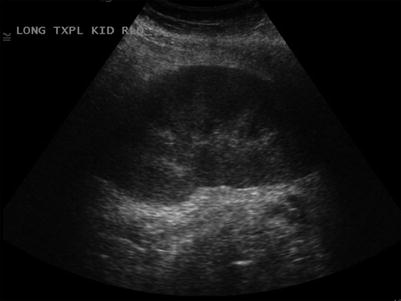
Fig. 23.6
Normal grayscale appearance of a renal allograft with normal cortical thickness and echogenicity, normal corticomedullary differentiation, and normal sinus
Computed Tomography
Although US is the first-line modality for imaging renal allograft, computed tomography (CT) techniques allow new and advanced ways of evaluating renal transplant patients. This includes CT angiography (CTA) with the ability to visualize renal and perirenal vessels making diagnoses previously left to digital subtraction angiography (DSA). CT can now easily provide accurate and useful multiplanar and volumetric reformations. A global assessment of the regional anatomy and perirenal area is also done with CT effortlessly. Like their native counterparts, unenhanced transplanted kidneys are of homogeneous soft tissue attenuation of computed tomography (CT). Similarly, on contrast-enhanced computed tomography (CECT), the allograft should undergo the expected corticomedullary, nephrographic, and excretory enhancement during the corresponding arterial, venous, and delayed timing [3].
Magnetic Resonance Imaging
Magnetic resonance imaging (MRI) is a versatile tool for the evaluation of the renal allograft. Use of fast acquisitions, such as half Fourier acquisition single-shot turbo spin echo (HASTE), with heavy T2 weighting can produce an MR urogram (MRU). MRU has great sensitivity for fluid and identification of hydronephrosis, peritransplant fluid collections, and intraparenchymal cysts. MR arteriography and venography (MRA and MRV) can be obtained with or without contrast enhancement with great detail of vascular structures. Some of these techniques compare favorably with DSA, but may overestimate degree of stenosis in some cases and is prone to susceptibility artifacts and bolus timing problems. In patients with adequate renal function, volumetric T1 fat-saturated dynamic postcontrast acquisitions allow evaluation of the renogram at multiple phases of enhancement. During a single session, the patient can undergo angiography, renography, and urography with accurate vascular, anatomic, and functional information [7].
When using gadolinium-based contrast agents, the risk of nephrogenic systemic fibrosis (NSF) should be considered. NSF is a newly described disorder occurring in patients with renal failure. Gadolinium-based contrast used in MRI has been suggested as a dose-dependent cause. Use of gadolinium-based contrast agents should be avoided when possible in patients with renal failure [4].
Imaging Patterns
Algorithm 23.1 Imaging patterns of renal allograft pathology
Diffuse Parenchymal Processes
Imaging of diffuse parenchymal disease is nonspecific. As previously discussed disease timing and clinical pictures may be essential in making the diagnosis. In many cases, histopathologic evaluation is ultimately required.
Allograft Swelling
During the first 2 weeks after transplantation, the renal allograft may be expected to enlarge to up to 130–200 % its original size. This hypertrophy is physiologic. Pathologic renal enlargement is usually due to swelling and commonly accompanied by diffuse hypoechogenicity of the renal cortex. These findings may be seen with rejection, but also with acute tubular necrosis, obstruction, infection, and renal vein thrombosis, among other conditions.
Algorithm 23.2 Imaging findings of allograft swelling
Allograft Rejection
Allograft rejection is classified based on time of onset, which in turn is a product of the immunologic process.
Imaging of the allograft is rarely performed during hyperacute rejection, as renal artery thrombosis and allograft infarction occur immediately following anastomosis and are evident intraoperatively [2] (Table 23.3).
Type of rejection | Onset posttransplant | Immunologic process |
|---|---|---|
Hyperacute | Minutes to hours | Preexisting antibodies |
Accelerated acute | First week | Memory cells with T- or B-cell response |
Acute | Days to weeks | Cell-mediated response |
Late acute | After first 6 months | Therapy noncompliance |
Chronic | Months to years | Multifactorial |
Timely diagnosis of acute rejection is key to prompt treatment with corticosteroids and/or antibody therapy, which may reverse its effects. Unfortunately, the US findings of rejection may occur late and are nonspecific. Thus, tissue diagnosis is needed. Monitoring response to therapy may also be done with serial US.
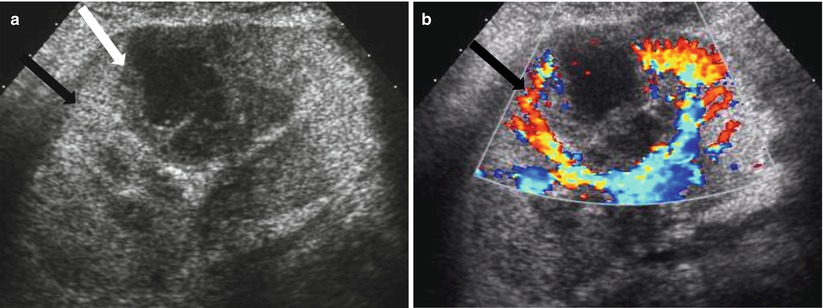
Enlargement of the renal allograft can be seen during acute rejection and early phases of chronic rejection, but grayscale findings are not uncommonly absent. The swollen allograft may be hypoechoic or hyperechoic, with loss of corticomedullary differentiation, prominence of the hypoechoic medullary pyramids surpassing the renal cortex thickness, and concurrent effacement of the echogenic renal sinus (Fig. 23.7). Hypoechoic foci may be seen with edema, whereas heterogeneously echogenic foci may represent hemorrhages associated with rejection. Urothelial thickening may also be seen with allograft rejection. Poor vascular arborization may be present on CDUS, especially if severe rejection is present. On spectral Doppler evaluation, elevated RI may be seen with a value above 0.8 being associated with poor outcome (Fig. 23.8) [4, 7]. While this is a nonspecific finding, a higher RI value increases the likelihood of acute rejection [5].
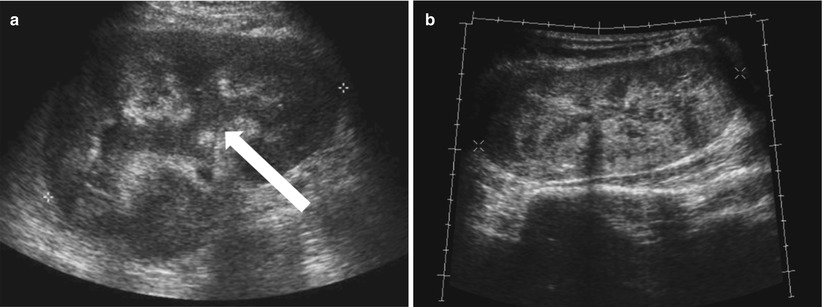
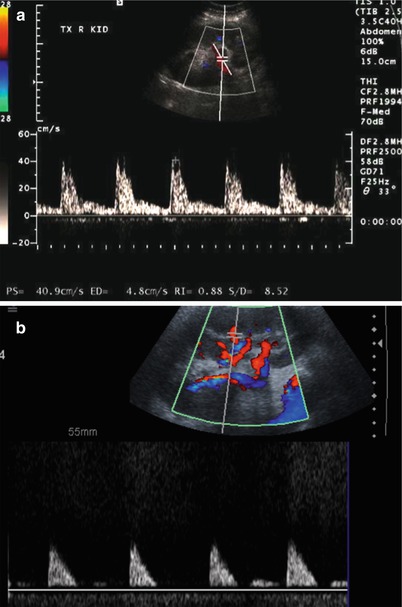
Fig. 23.7
Grayscale US of allograft rejection demonstrate a swollen kidney with loss of corticomedullary and mild hydronephrosis (arrow, a). Grayscale US on a different patient shows a different manifestation of rejection, with diffuse heterogeneous hyperechogenicity (b)
Fig. 23.8
Spectral Doppler US on two different patients with allograft rejection demonstrate a high resistance pattern. Some diastolic flow is preserved on (a), but little diastolic flow is perceptible on (b) with RI of 1.0
The CT appearance of the acute and early chronic rejection may also demonstrate a swollen allograft with increased size, poor enhancement, and loss of corticomedullary distinction (Fig. 23.9). Contrast excretion may be altogether absent (3).
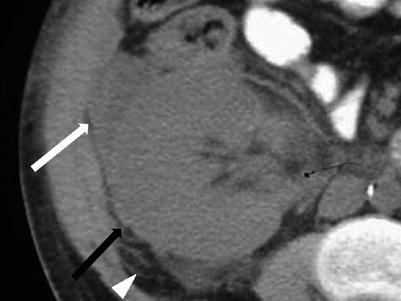
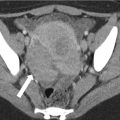
Fig. 23.9
Unenhanced CT demonstrates a swollen allograft (black arrow) with perinephric fluid (white arrow) and stranding (arrow head) in this patient with allograft rejection
The T2 characteristics of allograft rejection are variable. T1 shortening of the renal cortex decreases its signal intensity on those sequences, decreasing the distinction with the medulla. Similarly, lack of enhancement and loss of corticomedullary distinction will be seen with gadolinium administration. Unfortunately, many of the described imaging characteristics can be seen with other entities, such as ATN, cyclosporine toxicity, and allograft infection, albeit less commonly [8]. Still, a complete lack of concentration or excretion of contrast in the setting of a patent renal artery and vein suggests rejection [7]. Promising results suggest the use of blood oxygen level-dependent (BOLD) MR may be useful in distinguishing acute rejection from ATN [9].
Late acute rejection may be seen with no compliance and will have similar findings as described for acute rejection and early chronic rejection. The late chronic rejection and end-stage appearance of the allograft is one of an atrophic kidney, as discussed on the section of renal atrophy.
Acute Tubular Necrosis
ATN is the most common reason for early posttransplant failure. ATN may result from increased ischemia times and reperfusion injury. Many of the features discussed for rejection are variably present in ATN, which is the most common cause of failure in the first week posttransplant and cannot be reliably differentiated from rejection by imaging alone. The clinical course and imaging findings are transient with ATN, however [2]. On MR, loss of corticomedullary differentiation may be less common with ATN, but this is nonspecific [8].
Infection
The renal allograft is at an increased risk of infection in its postsurgical status, as well as secondary to immunosuppression. In the immunosuppressed state, presentation may be delayed. The most common opportunistic pathogen is cytomegalovirus (CMV). Infection may also be due to staphylococci, aerobic gram-negative bacilli, anaerobes, Candida, and Nocardia.
The renal allograft may be enlarged, but the appearance of pyelonephritis is also nonspecific on US. The renal cortex can be diffusely or focally hypoechoic, but can also have increased echogenicity (Fig. 23.10). There is loss of corticomedullary distinction and inflammation/stranding of the perinephric fat. Although CT may demonstrate focal wedge-shaped areas of hypoattenuation (Figs. 23.10 and 23.11), more focal abnormalities evident by US may indicate focal pyelonephritis and intrarenal abscess [2, 5].
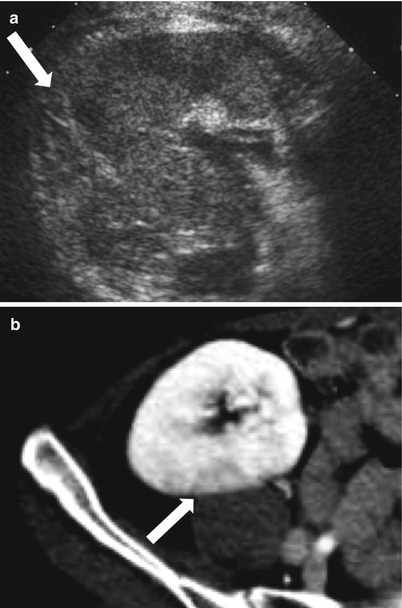
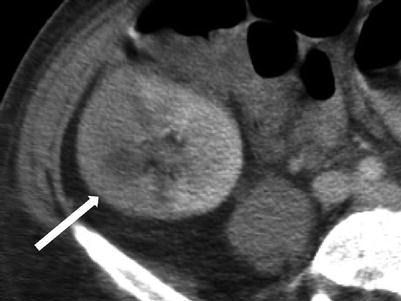
Fig. 23.10
Grayscale US demonstrates a heterogenous allograft with a more discrete echogenic focus in this patient with pyelonephritis (arrow, a). Contrast-enhanced CT demonstrates a corresponding area of wedge-shaped hypoenhancement (arrow, b). Microbiology showed vancomycin-resistant Enterococcus and Candida glabrata
Fig. 23.11
Contrast-enhanced CT demonstrates segmental hypoenhancement (arrow) in this patient with pyelonephritis
Drug Nephrotoxicity
The most common cause of renal allograft nephrotoxicity is cyclosporine, which has the greatest nephrotoxic potential. Typically, US is not specific, but any finding should be correlated with cyclosporine serum levels [2]. On US, renal enlargement may be seen with increased cortical thickness, increased or decreased cortical echogenicity, loss of corticomedullary distinction, and prominent medullary pyramids. Intrarenal resistive indices may be increased, but this is also a nonspecific finding [5].
Acute Infarction
When globally infarcted, the allograft is acutely enlarged and diffusely hypoechoic with no identifiable Doppler signal internally [1]. On CT a nonenhancing renal transplant with enhancing capsule may be evident (Fig. 23.12). Subsequently, the allograft will atrophy and adopt the appearance of an end-stage kidney. A change in axis of the renal allograft may suggest allograft torsion as a cause of ischemia or infarction [3]. Focal areas of hypoechogenicity may be seen with segmental infarctions.
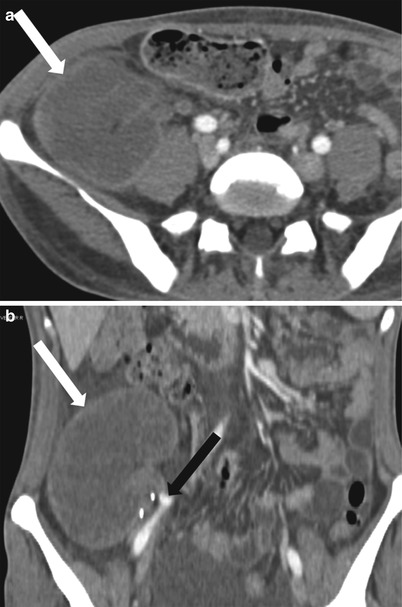
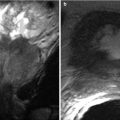
Fig. 23.12
Axial (a) and coronal (b) contrast enhanced CT demonstrate a “rim nephrogram” indicating a complete infarct (white arrows). The renal allograft artery takes off from the right external iliac with proximal complete occlusion (black arrow)
Others
An enlarged, swollen allograft may also be seen with renal vein thrombosis, obstruction, and glomerulonephritis. The former two are discussed in the Vascular and Collecting Systems sections, respectively. The appearance of glomerulonephritis is nonspecific and includes enlargement and swelling of allograft with decreased perfusion and areas of corticomedullary hypoechogenicity [6].
Allograft Atrophy
Chronic rejection is the most common cause of late allograft failure (2). The end-stage allograft will appear small and echogenic with subsequent cortical thinning reminiscent of medical renal disease in native kidneys with prominent sinus fat. A chronically infarcted allograft will also be atrophic. On CDUS, perfusion arborization is decreased. Fatty replacement may be evident with CT. There may also be punctate nephrocalcinosis or amorphous diffuse calcification, as well as arterial calcifications (Figs. 23.13 and 23.14). Mild collecting system dilation will be seen later [3, 10, 11].
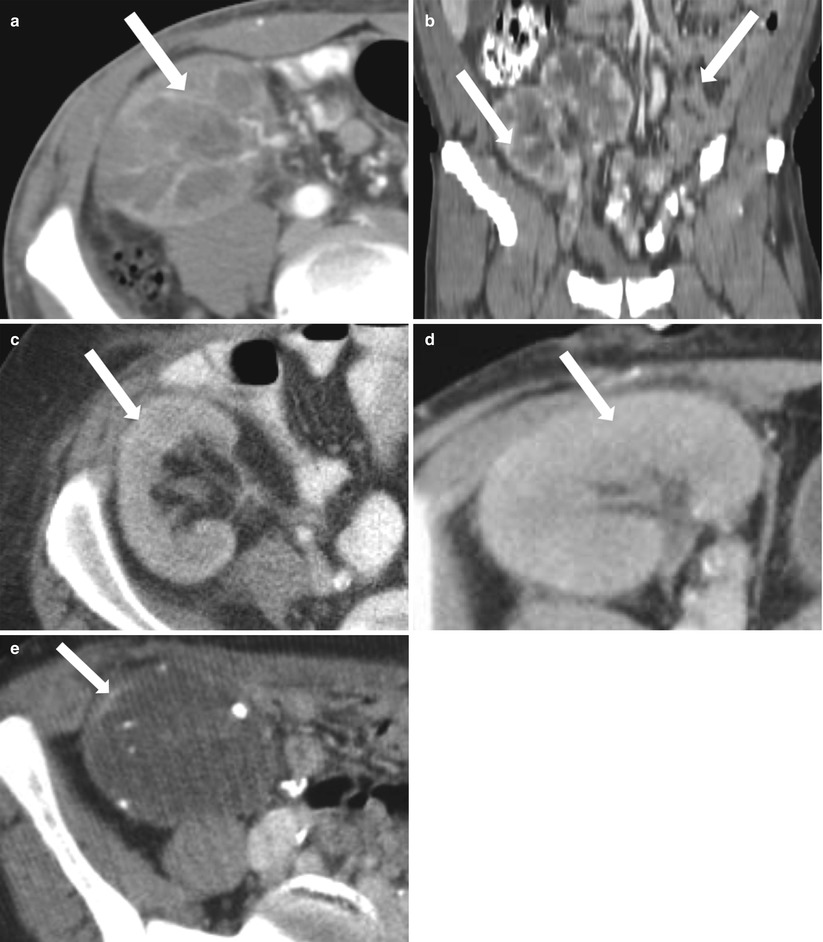
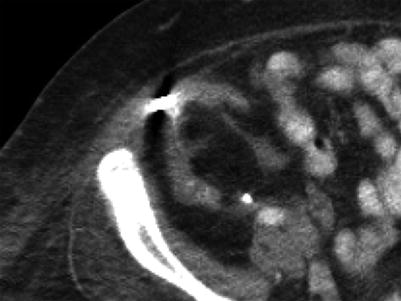
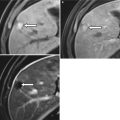
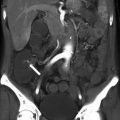
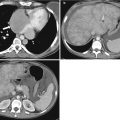
Fig. 23.13
Contrast-enhanced CT images demonstrate weak enhancement in chronic rejection. Axial CECT of single allograft (a) and coronal CECT (b) of paired infant allografts also demonstrate cortical thinning. Poor corticomedullary differentiation is also evident on axial CECT (c, d). Axial CECT shows coarse calcifications and poor enhancement (e)
Fig. 23.14
Contrast-enhanced CT demonstrates a nonenhancing, atrophic, infarcted allograft with prominent renal sinus fat and cortical calcifications
Nephrocalcinosis
Renal allograft nephrocalcinosis (Figs. 23.15 and 23.16) may be seen with hyperparathyroidism, drug toxicity (tacrolimus), denervation hyperphosphaturia, chronic gromerulonephritis, chronic renal tubular acidosis, cortical necrosis, and chronic rejection. In adults, early nephrocalcinosis may be related to hyperparathyroidism and can portend a poor prognosis. The same prognostic outcome is not seen in pediatric patients [12]. Chronic glomerulonephritis and cortical necrosis have similar appearance to their native counterparts. On an atrophied allograft, chronic rejection or end-stage transplant is the likely cause.
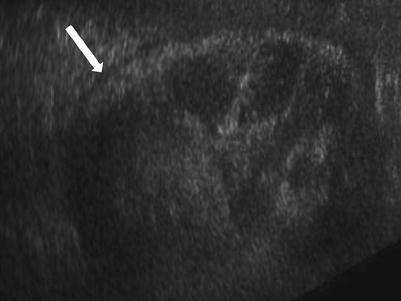
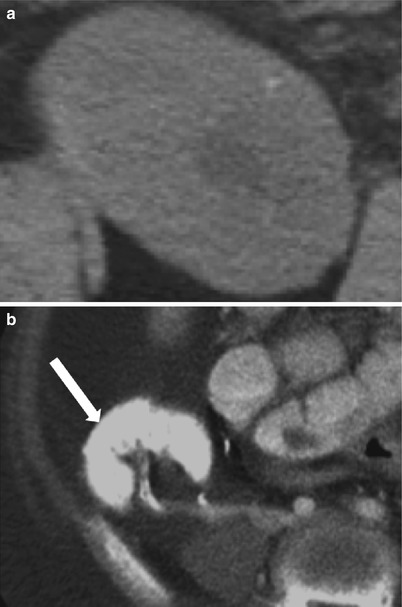
Fig. 23.15
Grayscale demonstrates extensive cortical calcification (arrow), representing cortical nephrocalcinosis
Fig. 23.16
Axial CT images demonstrate faint diffuse allograft calcification of nephrocalcinosis (a). Densely calcified allograft is seen after infarction (arrow, b)
Focal Parenchymal Lesions
Areas of focal contour abnormality, hypoechogenicity, or hyperechogenicity are typically nonspecific, but may relate to neoplasm, focal infection, infarction, or even rejection. Neoplasms occur in the late posttransplant period and include renal cell carcinoma, transitional cell carcinoma, and posttransplantation lymphoproliferative disorder (PTLD), as well as other extrarenal malignancies, including skin, cervical cancer, and non-Hodgkin’s lymphoma [2, 5].
Algorithm 23.3 Imaging findings of focal parenchymal lesions
Focal Pyelonephritis and Intrarenal Abscess
Because the renal allograft is less responsive to antibiotic therapy, focal pyelonephritis, and abscess may develop despite treatment. As previously discussed, a diffusely swollen allograft may be seen with infection. A focal area of decreased echogenicity on US indicates more advanced disease like focal pyelonephritis or intrarenal abscess. An abscess typically appears cystic, and there may be increased color flow in the surrounding renal parenchyma (Fig. 23.17). Gas bubbles within an abscess or renal parenchyma in emphysematous pyelonephritis may produce echogenic lines and reverberation artifact [2, 5].