Chapter 2 Clinical-Anatomical Syndromes of Ischemic Infarction
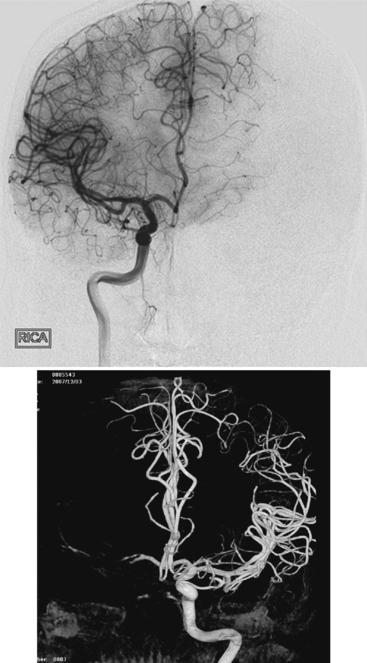
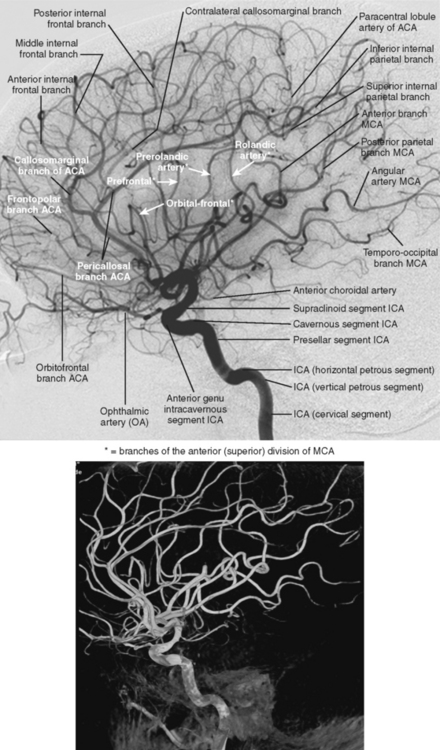
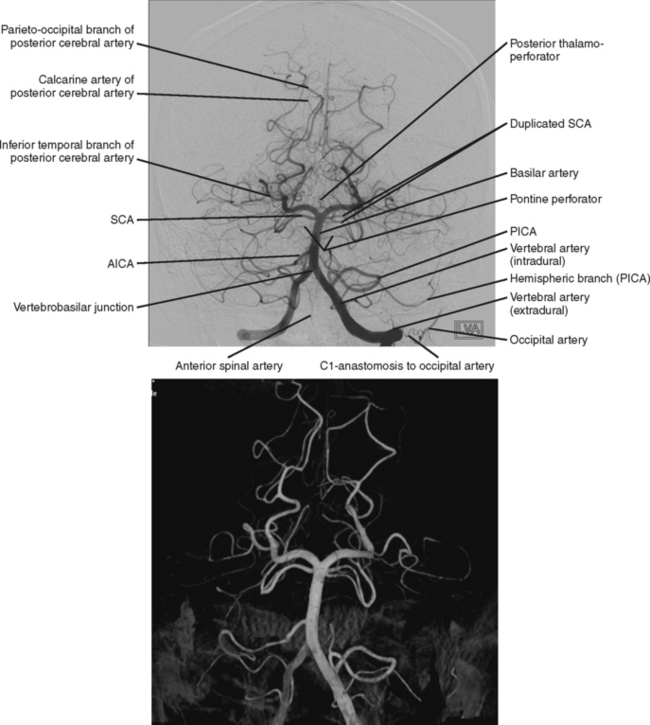
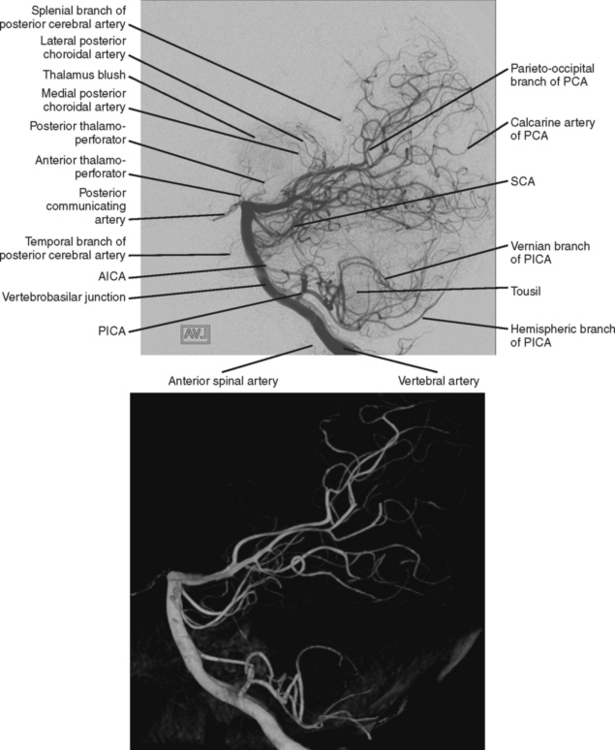
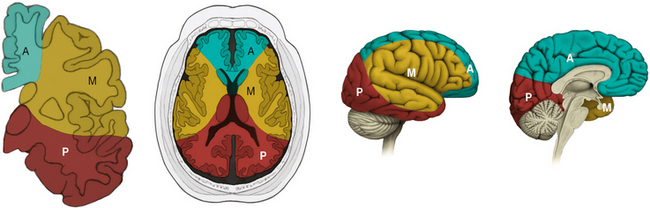
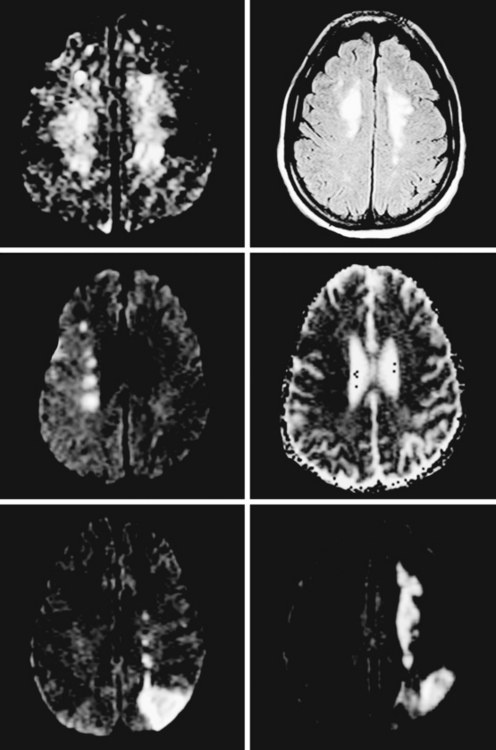
Ischemic stroke can be defined as a sudden focal neurological deficit corresponding to a vascular distribution. Brain imaging techniques allow us to visualize lesions with great anatomical precision. However, optimal interpretation of the information provided by neuroimaging requires having detailed knowledge of the arterial anatomy (Figures 2-1 through 2-4) and the vascular territories of the brain (Figure 2-5).

Figure 2-1 Anterior circulation, frontal view on conventional angiogram (top) and three-dimensional angiogram (bottom). ICA, internal carotid artery; ACA, anterior cerebral artery; MCA, middle cerebral artery.

Figure 2-2 Anterior circulation, lateral view on conventional angiogram (top) and three-dimensional angiogram (bottom). ICA, internal carotid artery; ACA, anterior cerebral artery; MCA, middle cerebral artery.

Figure 2-3 Posterior circulation, frontal view on conventional angiogram (top) and three-dimensional angiogram (bottom). PICA, posterior-inferior cerebellar artery; AICA, anterior-inferior cerebellar artery; SCA, superior cerebellar artery.

Figure 2-4 Posterior circulation, lateral view on conventional angiogram (top) and three-dimensional angiogram (bottom). PICA, posterior-inferior cerebellar artery; AICA, anterior-inferior cerebellar artery; SCA, superior cerebellar artery; PCA, posterior cerebral artery.

Figure 2-5 Arterial territories of the cerebral hemispheres. Coronal image is shown on the left, axial in the middle, and sagittal on the right. A = anterior cerebral artery territory, M = middle cerebral artery territory, P = posterior cerebral artery territory.
Brain imaging has also enhanced our understanding of clinical-anatomical correlations in patients with ischemic infarctions. Before the development of modern neuroimaging modalities, these correlations could only be established by necropsy studies. In fact, clinical research using radiological data has shown that localization based on classical semiological syndromes may often be incorrect. Similar clinical presentations may occur in patients with strokes in different territories and, conversely, infarctions in the same territory may produce dissimilar manifestations in different patients. Nonetheless, accurate diagnosis relies on the recognition of the brain lesion in a defined vascular territory.
This chapter provides illustrations of ischemic infarctions in all major vascular territories and presents the most common clinical correlations. It is conceived as a practical and concise guide to the correct interpretation of brain imaging and not as a comprehensive anatomical or semiological monograph on this important topic. The reader should keep in mind that the variety of distribution of infarctions encountered in practice is enormous. The boundaries of arterial territories are far from invariable across patients, and anatomical variations in the constitution of the cerebral circulation and its interconnections are relatively common.
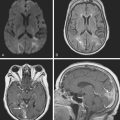
CAROTID BIFURCATION OCCLUSION
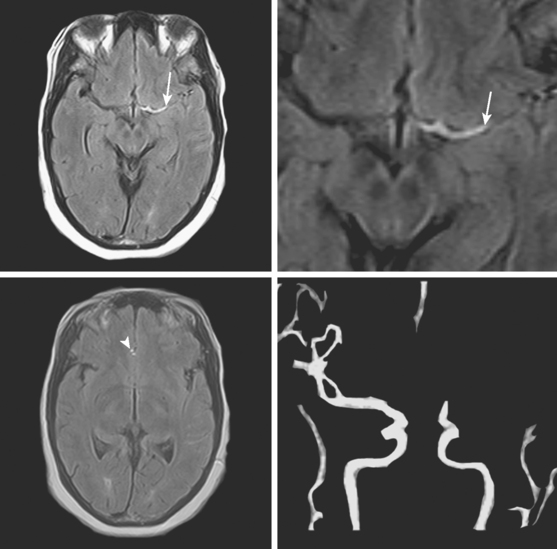
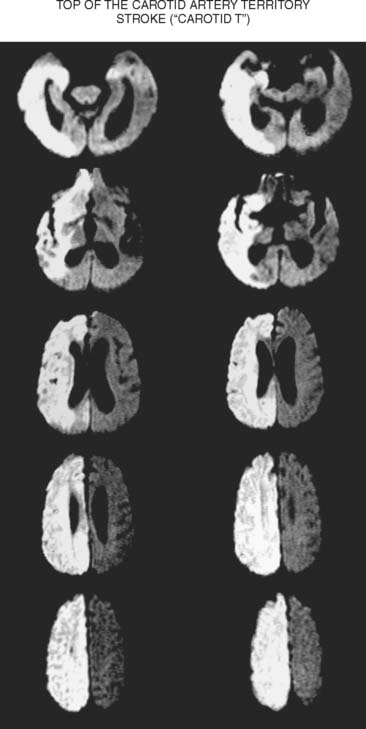
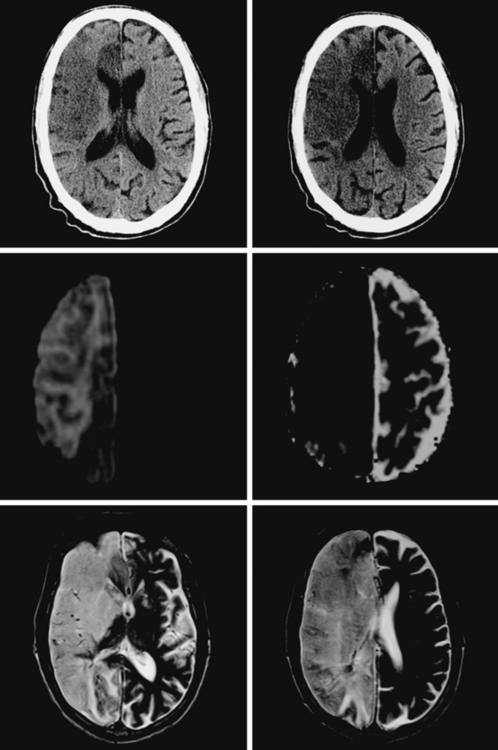
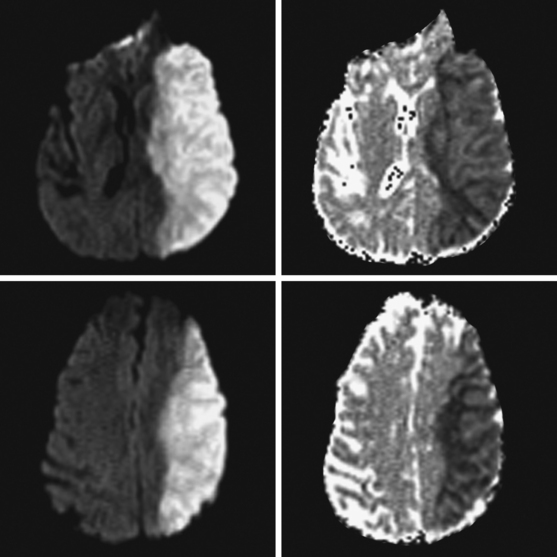
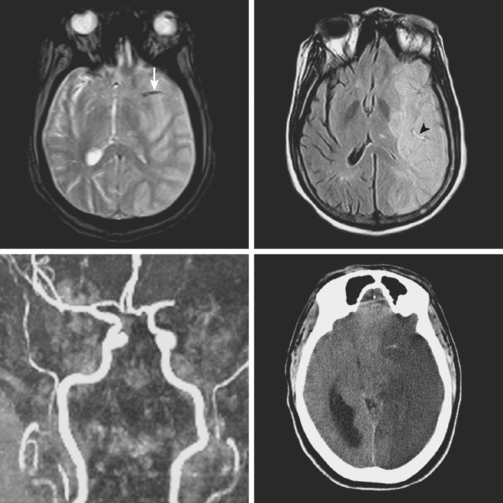
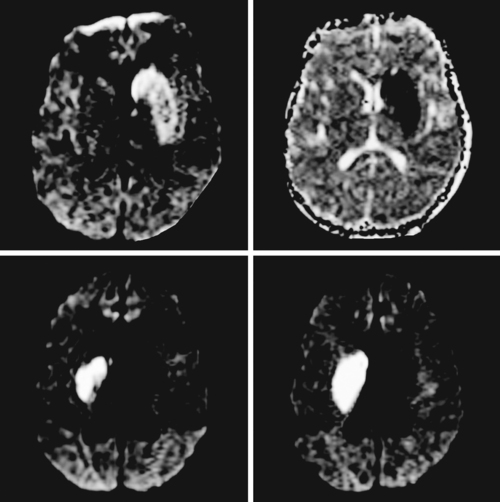
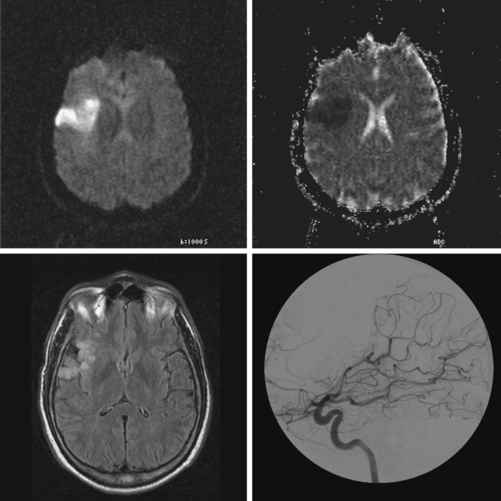
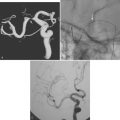
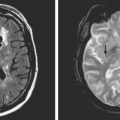
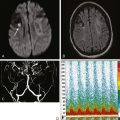
A 61-year-old man with history of coronary artery disease, previous myocardial infarction, and multiple vascular risk factors presented to the emergency department with global aphasia and right hemiplegia for more than 6 hours. On examination, he was drowsy and exhibited forced left gaze deviation, right hemianopia, right flaccid hemiplegia involving the arm and the leg to similar degree, and absent response to pain on the right side. Diffusion-weighted imagery (DWI) of the brain revealed a large area of ischemia in the left hemisphere, including the territories of the anterior and middle cerebral arteries (Figure 2-6). Fluid-attenuated inversion recovery (FLAIR) sequence showed no parenchymal hyperintensity but disclosed extensive hyperintense signal in the left middle cerebral artery consistent with fresh thrombus (Figure 2-7). Magnetic resonance angiography (MRA) of the intracranial circulation confirmed the presence of a left carotid terminus occlusion (Figure 2-7). The patient was subsequently diagnosed with acute myocardial infarction and a left ventricular mural thrombus. His neurological condition deteriorated over the following 48 hours, and he expired after care was restricted to palliative measures.

Figure 2-6 Diffusion weighted imaging (left) and apparent diffusion coefficient map (right) of the brain magnetic resonance imaging show extensive areas of restricted diffusion’indicative of cellular edema’in the territories of the left anterior and middle cerebral arteries.

Figure 2-7 Fluid-attenuated inversion recovery magnetic resonance imaging showing hyperintense signal (top row, arrow) in the left middle cerebral artery extending from the top of the intracranial carotid artery caused by acute thromboembolism; regular (left) and enhanced views (right). Hyperintense signal is also seen in the left anterior cerebral artery (lower left panel, arrowhead). Magnetic resonance angiogram of the intracranial circulation confirms the diagnosis of left carotid terminus occlusion (lower right panel).

Figure 2-8 Multiple ascending cuts of a brain magnetic resonance imaging (diffusion-weighted imagery sequence) illustrating the distribution of ischemia in a patient with carotid terminus occlusion.

Figure 2-9 Fifty-eight-year-old man presenting with right carotid T occlusion who expired on the third day after hospitalization. Admission computed tomography scan is shown in the upper row, and magnetic resonance imaging (MRI) obtained a few hours later is displayed in the middle (diffusion weighted imaging on the left and apparent diffusion coefficient map on the right), and lower (T2-weighted MRI) rows.
MIDDLE CEREBRAL ARTERY OCCLUSION

Figure 2-10 Ischemic infarction of the middle cerebral artery territory from proximal occlusion of the horizontal (M1) segment of the vessel. Note that the infarction involves the basal ganglia and internal capsule because the occlusion is proximal to the takeoff of the lenticulostriate braches.

Figure 2-11 Ischemic infarction of the middle cerebral artery territory from distal occlusion of the horizontal (M1) segment of the vessel. Note that the infarction spares the basal ganglia and internal capsule because the occlusion is distal to the takeoff of the lenticulostriate braches.
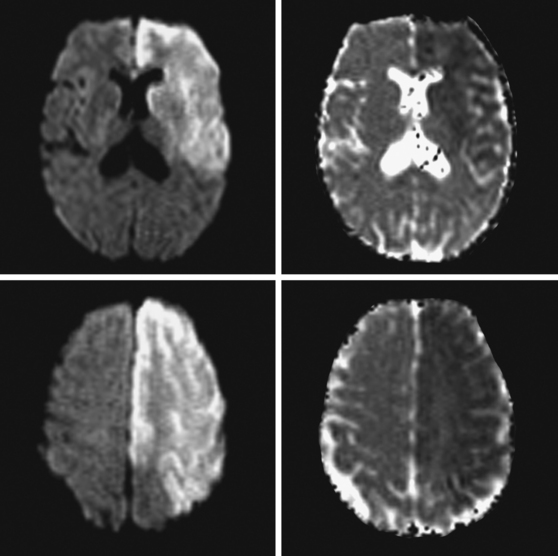
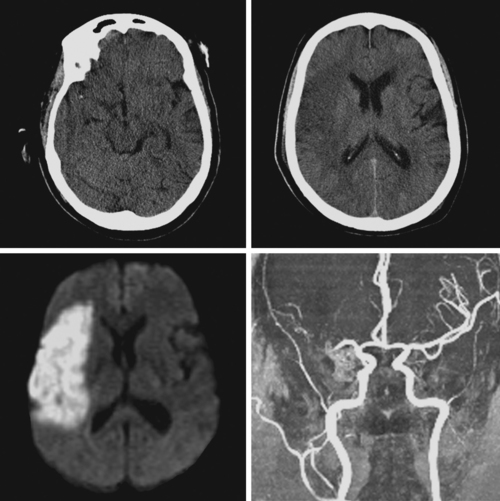
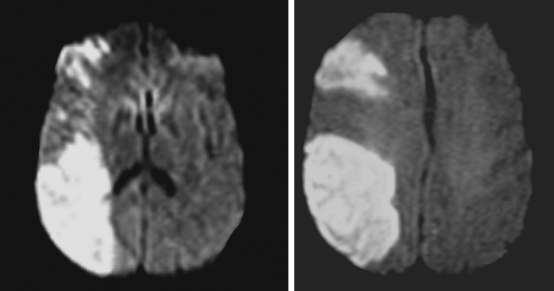
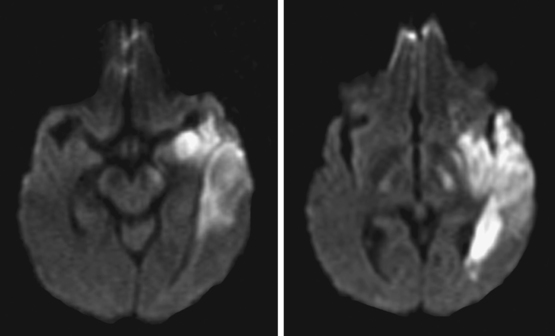
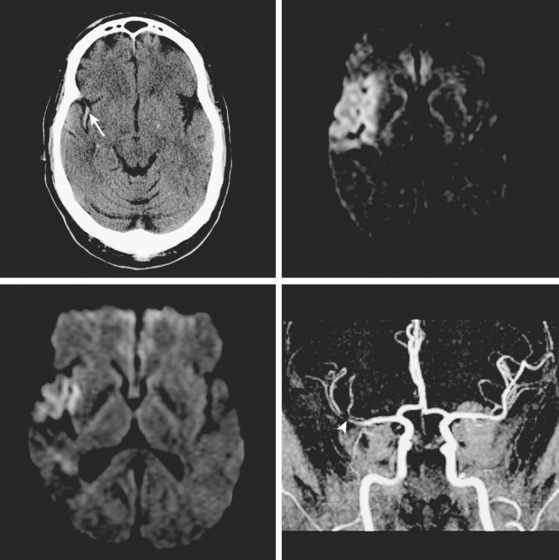
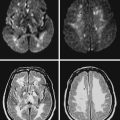
A 65-year-old man with history of hypertension presented with acute global aphasia and right flaccid hemiplegia involving the lower face, the arm, and, to a lesser degree, the leg. He also had a dense right visual field deficit and profound right sensory loss. Magnetic resonance imaging (MRI) with DWI revealed extensive ischemia in the territory of the left MCA (Figure 2-13). T2* sequence disclosed a hypointense signal in the left MCA indicative of acute vessel thrombosis and MRA confirmed the left M1 occlusion (Figure 2-14). Atrial fibrillation was noted on cardiac telemetry. Over the following 48 hours, the patient developed fatal brain swelling (see Figure 2-14).

Figure 2-13 Brain magnetic resonance imaging showing acute infarction of the left middle cerebral artery territory (diffusion-weighted imaging on the left and matching apparent diffusion coefficient on the right). Note sparing of the deep territory indicating distal M1 occlusion.

Figure 2-14 T2* sequence demonstrates acute thrombus in the distal part of the M1 segment of the left middle cerebral artery (MCA) (upper left, arrow). Fluid-attenuated inversion recovery sequence depicts the extension of the infarction (upper right); notice hyperintense vessel signal in sulcal braches (arrowhead). Intracranial magnetic resonance angiography confirmed the distal MCA occlusion (lower left). Computed tomography scan 2 days later shows massive progression of ischemic brain swelling (lower right).
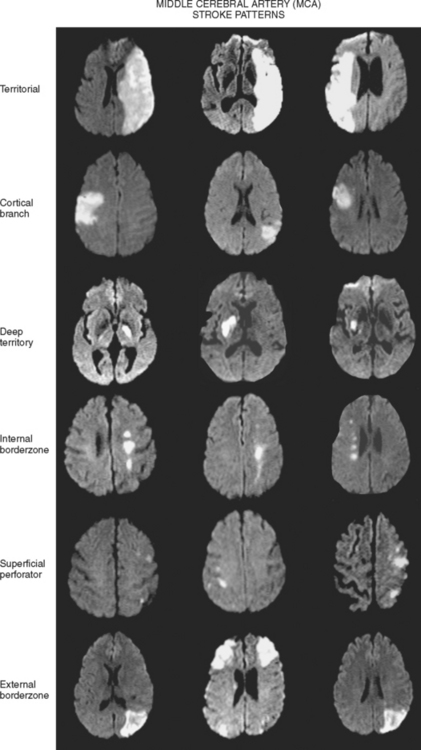
Territorial MCA Infarction

Figure 2-15 A 54-year-old woman presented to the emergency department with mild confusion, left visual field impairment, left hemiparesis, and left-sided neglect. Computed tomography scan of the brain (upper row) shows early low attenuation changes in the right middle cerebral artery (MCA) distribution, sparing the deep structures. The acute right MCA infarction was subsequently confirmed by magnetic resonance imaging (diffusion-weighted imaging sequence shown, lower left). Intracranial magnetic resonance angiography displayed the occlusion of the right MCA responsible for the ischemic stroke (lower right).

Figure 2-16 Patchy infarction of the right middle cerebral artery territory shown on diffusion-weighted imaging. Although the patient had an occluded right M1 segment, the infarction is discontinuous likely because of preservation of part of the cortex of the arterial territory by perfusion through collateral flow.
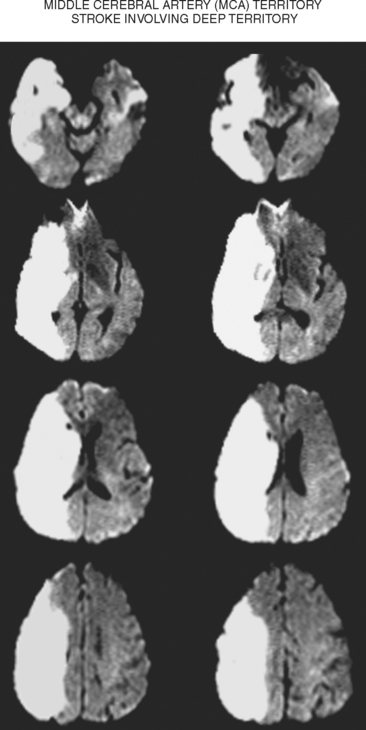
Deep Middle Cerebral Artery Infarction

Figure 2-17 Examples of deep infarctions in the middle cerebral artery (MCA) territory. The case displayed in the top row is unusual because of concomitant involvement of the head of the caudate’typically perfused by the recurrent artery of Heubner, most often a branch of the anterior cerebral artery’and the lenticular nucleus (diffusion-weighted imaging [DWI] on upper left and matching apparent diffusion coefficient map on the upper right). The case portrayed in the lower row illustrates extension of the infarction into the paraventricular corona radiata (DWI is shown). These cases serve to highlight the various anatomical presentations that can be seen with deep infarctions in the MCA territory.
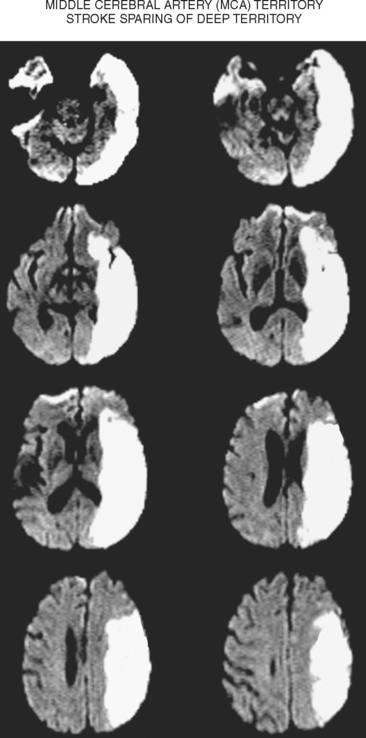
Superficial Divisional Middle Cerebral Artery Infarction

Figure 2-18 Superior division middle cerebral artery stroke. Diffusion-weighted imaging and apparent diffusion coefficient map shown in the upper row. Fluid-attenuated inversion recovery sequence displayed on the lower left. Conventional angiogram (lateral view, lower right) demonstrates the absence of filling of the occluded superior M2 branch.
Superficial Cortical Infarctions

Figure 2-20 Examples of middle cerebral artery infarction with involvement of the insular cortex. Upper row: Early computed tomography scan (left) with a hyperdense vessel sign in the Sylvian fissure (arrow) and loss of differentiation of the right insular ribbon and underlying anatomical boundaries. Diffusion-weighted imagery (DWI) sequence of magnetic resonance imaging (MRI) (right) allows recognition of the extension of the ischemic area. Lower row: DWI sequence of MRI (left) showing a restricted area of ischemia in the right insular region. MRA (right) shows a flow gap in the distal M1 segment (arrowhead) with reduced filling of M2 branches.
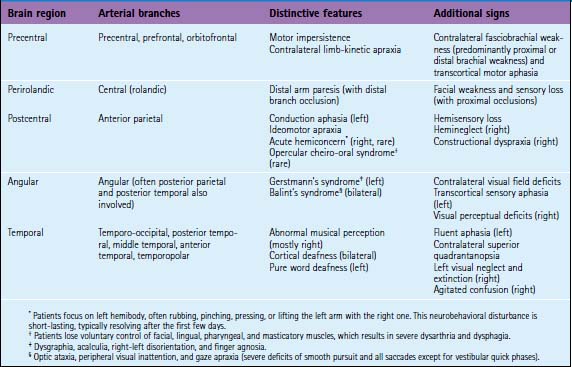
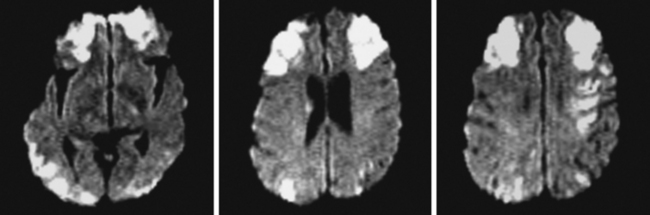
Hemispheric Border-Zone Infarctions

Figure 2-21 Example of fairly extensive acute external border-zone infarctions in patients who had developed severe hypotension during emergency cardiovascular surgery and who had preexistent bilateral carotid artery stenosis.

Figure 2-22 Three examples of internal border-zone infarctions. Notice the variable distributions of the lesions (unilateral or bilateral, confluent or patchy, purely internal or combined with areas of ischemia in the external border-zone region). Systemic hypotension was the mechanism of infarction in all these cases. Upper row: Diffusion-weighted imaging (DWI) sequence on the left and fluid-attenuated inversion recovery on the right. Middle row: DWI and matching apparent diffusion coefficient map. Lower row: DWI at two levels.
ANTERIOR CEREBRAL ARTERY OCCLUSION

Figure 2-23 Multiple ascending cuts of a brain magnetic resonance imaging (diffusion-weighted imaging sequence) illustrating the distribution of ischemia in a patient with proximal left anterior cerebral artery occlusion.

Stay updated, free articles. Join our Telegram channel

Full access? Get Clinical Tree

