Clinical Application of IVIM in the Female Pelvis
There is growing interest in multiparametric assessment of female pelvic diseases, especially cervical cancer. Intravoxel incoherent motion (IVIM) provides simultaneous information on tissue or tumor cellularity and perfusion; with that it offers promising clinical applications in diagnosis, disease stratification, and treatment response assessment in female pelvic diseases. Most of the evidence is based on studies in cervical cancer, but its use in other areas of the female pelvis is expanding. In this chapter, we will summarize the current literature in this area and discuss the emerging applications of IVIM in the female pelvis, with technical considerations, its position in the roadmap to clinical translation, and directions for future research.
15.1 Cervical Cancer
Cervical cancer is ranked the fourth-most-common female cancer worldwide, with 85% of the cancer burden in less developed regions of the world, and a lethal cancer with an estimated 266,000 deaths in 2012 [1].
15.1.1 Tissue Differentiation
Magnetic resonance imaging (MRI) is the cornerstone in the evaluation of cervical cancer, in diagnosis, staging, treatment planning, and detection of recurrent disease. The addition of diffusion-weighted imaging (DWI) as part of the MRI examination is useful in disease detection and provides prognostic information through the measurement of the apparent diffusion coefficient (ADC), which is based on the monoexponential signal decay model [2, 3]. With the development of IVIM MRI, we know that ADC not only contains information on water diffusivity but also data from the microcirculation [4, 5].
In the feasibility study that applied IVIM in the female pelvis, the diffusional signal decay in cervical cancer demonstrated biexponential function, giving it a unique IVIM profile [6]. Cervical cancer demonstrated a considerable perfusion fraction (f) of 14.9 ± 2.6%, though it is lower when compared to that of the normal cervix (18.6 ± 2.2%) and leiomyoma (17.3 ± 3.6%) [6]. Subsequent studies observed similar findings and reported a lower f in cervical cancer; the f estimates by Lin et al. were higher than those by Lee et al. and Wu et al., which could be related to the higher b values used in their study [6–8].
As ADC intrinsically includes an IVIM effect, ADC values of cervical cancer are higher than the true diffusion coefficient (D) derived from the IVIM model [6–8]. Hence, ADC overestimates the water diffusivity, leading to inaccurate quantification of diffusion in cervical cancer. Nevertheless, in terms of clinical diagnostic performance, both ADC and D performed equally well in discriminating cancerous tissue from normal cervical tissue [6, 7]. These data were derived from cohort who underwent MRI for primary diagnosis, and there has been no study to date that evaluates the value of IVIM in the detection of cervical recurrence. There was no additional benefit of dynamic contrast–enhanced (DCE) MRI over DWI in the detection of cervical recurrence [9, 10]. Therefore, it remains unclear whether the perfusion parameters from IVIM will add value and have a role in cervical recurrence detection; further research is required to clarify the value of the perfusion parameters derived from IVIM in this setting.
15.1.2 Relationship with Dynamic Contrast–Enhanced MRI
The lower f in cervical cancer seems counterintuitive to what had been observed in DCE MRI, where rapid and intense contrast uptake was observed in cervical cancer compared to normal cervix [11, 12]. The relationship between IVIM-derived perfusion parameters and the “classical” perfusion parameters, mainly from DCE MRI, is dependent on the tissue under investigation, leading to mixed results in the published literature [13–20].
In a cohort of 25 patients with newly diagnosed cervical cancer (FIGO IB2-IVB), Lee et al. found that the flow-related parameter (fD*, where D* represents the pseudodiffusion coefficient derived from IVIM) was positively related to quantitative DCE MRI, that is, the estimated volume transfer constant between blood plasma and the extravascular extracellular space (est K trans with r = 0.42, p = 0.038) and the amplitude factor (A with r = 0.50, p = 0.011), which represented the degree of MRI signal enhancement. Furthermore, fD* was also moderately correlated with semiquantitative DCE MRI, namely the maximum relative enhancement (maximum relative enhancement [MaxRE], r = 0.52, p = 0.008). The f was also associated with the area under the signal-time curve on DCE MRI (AUC, r = 0.58, p = 0.003) (Fig 15.1) [21].
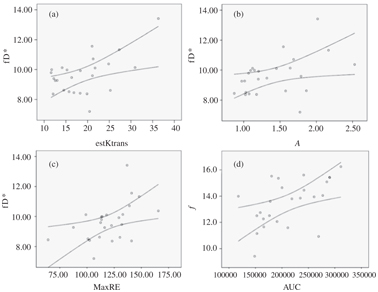
Figure 15.1 Scatterplots of IVIM perfusion parameters against DCE MRI perfusion parameters (a–d). The curved lines represent the 95% confidence intervals. (a) Moderate positive correlation between fD* (×10−3 mm2/s) and est K trans (s−1) (r = 0.42, p= 0.038). (b) Moderate positive correlation between fD*(×10−3 mm2/s) and amplitude factor A (r = 0.50, p = 0.011). (c) Moderate positive correlation between fD* (×10−3 mm2/s) and MaxRE (%) (r = 0.52, p = 0.008). (d) Moderate to good positive correlation between f (%) and AUC (r = 0.58, p = 0.003). Reprinted from Ref. [21], with permission from John Wiley and Sons, copyright 2014.
The measured fD* is dependent on the complex interplay among different factors that influence tumor microcirculation, for example, the capillaries geometry, the endothelial permeability, the exchange surface areas, the interstitial volume, and flow dynamics. Therefore, fD* could provide surrogate assessment of the endothelial leakiness and blood flow in cervical cancer; and its positive relationships with DCE MRI parameters support this notion. The signal attenuation that contributed to the IVIM-derived perfusion parameters in cervical cancer is likely related to the increased microvessel density due to tumor angiogenesis [22, 23]. Similarly, the positive correlation between f and the area under the signal-time curve or area under the curve (AUC) could be explained by the fact that both measurements are related to quantification of the blood volume. A separate study also found correlations between semiquantitative DCE MRI parameters and f in cervical cancer, namely the maximum slope of contrast uptake, the contrast enhancement ratio, and the AUC within the initial 90s of DCE MRI [24].
Despite these positive relationships, the degrees of agreement were only weak to moderate, suggesting that both methods are measuring different aspects of tumor microcirculation in cervical cancer. There are fundamental differences in the model assumptions of both methods, with IVIM investigating the microvessels network, while DCE MRI relies on the intravascular and extravascular distribution of exogenous contrast agent, in this case, gadolinium. Furthermore, the IVIM-derived perfusion parameters are affected not only by microcirculation but also by other physiological processes in cervical cancer, for example, glandular secretion [25].
The perfusion characteristic of cervical cancer affects the sensitivity to radiotherapy and has been a target for antiangiogenic therapy [23, 26]. Understanding the tumor microcirculation is important, given its influence on treatment response to radiation and disease prognosis. Poorly perfused cervical cancer is hypoxic, and hypoxia is a biological determinant of poor outcome to radiation [27]. MRI-derived perfusion parameters are promising surrogates for hypoxic imaging, which may have potential in guiding radiation dose escalation to hypoxic regions of cervical cancer, therefore offering personalized treatment. Although DCE MRI provides prognostic information on cervical cancer outcome, there are associated risks of toxicities related to the use of gadolinium [28]. IVIM-derived perfusion parameters have the advantages of being more sensitive to incoherent motion in the capillaries feeding the tumor and less sensitive to adjacent large vessel signal contamination, as in DCE MRI [14]. Therefore, IVIM-derived perfusion assessment may pose as an alternative to DCE MRI.
15.1.3 Tumor Differentiation
Approximately 85% of cervical cancers are squamous cell carcinoma (SCC) and the remaining 15% are adenocarcinoma (ACA).
Cervical SCC exhibited lower D compared to cervical ACA [7, 29] and substantiated by similar findings in our study that utilized his- togram-based analysis [30]. In one of the studies, the authors sug- gested that a possible explanation for this is that SCC contains more tumor but less stroma than ACA, resulting in a higher restriction of water diffusion in SCC [29].
A lower f was observed in cervical SCC [7,29,31], in agreement with findings on immunostaining where lower microvessel density and lower intensity of vascular endothelial growth factor expression were observed in cervical SCC than in cervical ACA [32]. It is probable that the vascular endothelial organization and tumor architecture are more important in histological subtype differentiation, having a more profound effect on IVIM parameters like D, f, and D* [31].
Apart from histological subtype differentiation, D is promising in tumor grading. Poorly differentiated cervical cancer was more restricted with a lower D [7,29,31]. Tumor grading relies on the nuclear polymorphism and frequency of mitotic figures, affecting the cell density, explaining the observed lower D in poorly differentiated cervical cancer. Although Wu et al. did not find a significant statistical difference, they observed a similar trend in that poorly differentiated cervical cancer tended to have a lower D [8]. D remained lower in poorly differentiated tumor when histological subtypes were considered [7, 24].
None of the perfusion-related IVIM parameters could be used to differentiate tumor grading when whole-tumor analysis was performed [7,8,31]. Interestingly, when only the periphery of the tumor was considered, f was useful in discriminating well/moder- ately differentiated versus poorly differentiated cervical SCC with a higher f in a poorly differentiated tumor [24]. This relates to tumor heterogeneity, especially in a large tumor where tumor growth ex- ceeds neoangiogenesis, resulting in a poorly perfused tumor center [23, 33]. Whole-tumor analysis has the disadvantage of not taking tumor heterogeneity into consideration. With histogram analysis, we observed higher percentiles of f in poorly differentiated cervical SCC (Fig 15.2), in agreement with Zhou et al. [24, 30]. Hence, histo- gram analysis provides more global assessment of cervical cancer, taking into account of tumor heterogeneity.
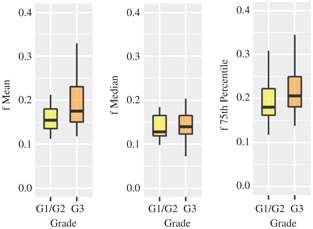
Figure 15.2 Boxplots of mean, median, and 75th percentile of f between well-/moderately (G1/2) and poorly differentiated (G3) cervical cancer showing statistical differences.
With histogram analysis, we were able to demonstrate that lo- cally advanced cervical cancer (FIGO IIB-IVA, high FIGO) had lower values of skewness and kurtosis but higher percentile values in f than early cervical cancer (FIGO IB-IIA, low FIGO) (Fig 15.3) [34]. Only a few of the histogram parameters of D were significantly dif- ferent between the two groups, suggesting that the effect of cellular heterogeneity was not as dominant as the perfusion heterogeneity in the two different FIGO groups.
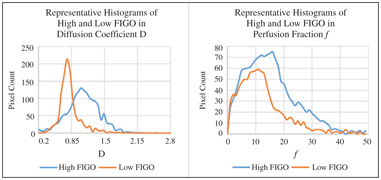
Figure 15.3 Smooth curverenderings of representative histogram distributions of D and f from high and low FIGO groups.
In recent years, there has been growing interest in the quantity and quality of tumor stroma that impact tumor progression. In cervical cancer, the tumor–stroma ratio (TSR) has a prognostic value in that stroma-rich tumor has a poorer prognosis and outcome [35]. Given the ability of DWI to characterize tumor microenvironment, the correlation between IVIM and TSR was investigated. D and f were significantly lower in a stroma-poor tumor with moderate negative correlations with TSR [35]. The lower D in the stroma-poor tumor could be explained by the higher proportion of tumor cells resulting in more water restriction in the tumor, but the mechanism of the lower f remains unclear and will need further exploration.
IVIM-derived parameters are promising in differentiating histological subtypes and tumor grading and possibly their correlations with TSR in cervical cancer (Table 15.1). Although significant differences have been observed between clinical groups, there is considerable overlap in the IVIM parameters, making them insufficient predictors by themselves and preventing them from being integrated in clinical decision-making at present. Tumor heterogeneity will need to be taken into consideration when performing quantitative analysis in terms of placement of the region of interest (ROI).
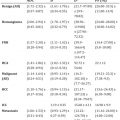
Table 15.1 Summary of the changes in D and f in relation to different cervical cancer characteristics
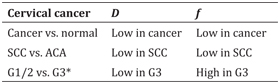
ACA: adenocarcinoma; SCC: squamous cell carcinoma; G: tumor grade.
* only in tumor periphery and on histogram analysis, likely due to tumor heterogeneity
15.1.4 Treatment Response Assessment and Disease Prognostication
The standard treatment regimen for locally advanced cervical cancer is concurrent chemoradiotherapy (CCRT). This usually takes the form of four to five weeks of external beam radiotherapy to the whole pelvis and weekly cisplatin-based chemotherapy. Given the role of MRI in the pretreatment evaluation of cervical cancer, it is increasingly used in treatment response assessment during and following CCRT. However, assessment based on morphological and T2 signal changes is challenging and inaccurate [36, 37]. The addition of DWI and DCE MRI is useful in monitoring the treatment response by observing the cellular and perfusion modulation in the tumor microenvironment following CCRT [38, 39].
The first experience in treatment response assessment with IVIM in cervical cancer was reported in 21 patients who underwent CCRT [40]. Serial MRI examinations, which included IVIM, were performed before, throughout (Week 2 and Week 4 of CCRT), and after CCRT. D, f, and D* increased in the early stage of CCRT; D continued to increase after CCRT, but the perfusion-related parameters started to decrease after the initial rise [40]. The trends in IVIM-derived perfusion parameters are compatible with those shown on DCE MRI, both semiquantitatively and quantitatively [41]. Herein, the increase in perfusion during CCRT is related to the modulation in the microvasculature of the tumor by radiation resulting in damage of the vascular endothelium and changes in the vascular density [41, 42]. However, subsequently the same group of authors observed a different trend in D* in that it continued to rise after CCRT [43]. The discordant results are likely the consequence of instability of D*, given its huge standard deviation and dependence on the signal-to- noise ratio (SNR), therefore limiting its use as a clinical parameter within the constraint of the current clinical MRI systems [44].
Histogram analysis provided an additional dimension to treatment response assessment by taking tumor heterogeneity into consideration. In an exploratory study, we observed that the histogram parameters generated from IVIM metrics significantly changed after CCRT in that both skewness and kurtosis were lower after treatment while other percentile values increased, both in D and f; and these changes were independent of changes in the tumor volume (Fig 15.4) [45]. Our results concurred with the trends observed in head and neck SCC that had undergone CCRT [46]. This suggests that histogram analysis of IVIM parameters is able to quantify the spatial variations of D and f before and after CCRT.
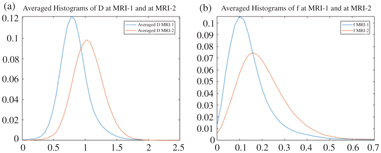
Figure 15.4 From left to right, averaged histogram curves (a) D and (b) f at baseline (MRI-1) and four weeks after CCRT (MRI-2). The decreasing skewness can be geometrically interpreted as a rightward shift in the histogram mass, while the decreasing kurtosis can be similarly interpreted as a flattening of the peak and lighter tails.
The pretreatment f was found to be useful in discriminating complete response from partial response and predicting both, with a higher f observed in the former group [43]. The authors went on to say that with a cutoff value of 9.85%, f was able to predict the response with a sensitivity of 72% and a specificity of 75% with the area under the receiver operating characteristic (ROC) curve of 0.768. Moreover, the results from the pretreatment f were comparable to those achieved on the basis of unidimensional tumor regression between Week 2 MRI and Week 4 MRI (sensitivity 75%, specificity 72%, and the area under ROC curve 0.763) [43]. Pretreatment f is advantageous over the serial tumor regression by providing early and timely assessment and prediction without the reliance of the Week 4 MRI, in which by then the impact on treatment is likely going to be small toward the end of the CCRT. Nevertheless, the cohort was small in this study and results will require further validation.
Contrary to this, we did not find f predictive of treatment re- sponse but D was when histogram analysis was applied [47]. We found that the skewness of D at baseline MRI was predictive of the treatment response, in addition to the increment in the 90th per- centile of D following CCRT. The discrepancy between the two stud- ies could be related to the differences in patient dichotomization, in which volume reduction was used as a reference in our study instead of unidimensional measurement in Zhu et al. and the differences in the method of analysis (histogram versus mean values) [43, 47]. Similarly, D was found useful in predicting response to neoadjuvant chemotherapy (areas under ROC curves: 0.763–0.823) whereas f and D* were not [48].
A group of researchers studied the prognostic imaging markers from serial IVIM in a cohort of 30 patients who underwent CCRT with a median follow-up of 24 months (range 10–34 months) [49]. In this study, the authors found that some of the imaging parameters were good in predicting prognosis following CCRT, namely the ADC at Week 2 of CCRT and ADC and f at Week 3 of CCRT with areas under the ROC curves of 0.767, 0.857, and 0.820, respectively. In particular, the Week 3 imaging parameters performed better than the tumor regression rate, which only achieved an area under the ROC curve of 0.75 [49]. The lack of significance in D suggested that the dominant prognostic effect could be coming from the perfusion component of IVIM. The pattern of f in patients with a good prognosis was concordant with prior studies based on DCE MRI; a higher-perfusion tumor responded better to CCRT, being less hypoxic and less resistant to radiation therapy [23, 39]. These early results are encouraging, but the sample size was small in this study. A larger cohort and external validation are likely going to address the significance of these findings.
15.2 Technical Consideration
Thus far, the number and range of b values were variable among studies that had applied IVIM in the female pelvis described in this chapter, ranging from 9 b values to 14 b values, with the maximum b value reaching 2000 s/mm2. Furthermore, the number of low b values (<200 s/mm2 when the “pseudodiffusion” is significant and the perfusion effect of IVIM could be observed) included was variable ranging from 5 to 9. Therefore, we need to identify the optimal number and range of b values to avoid acquisition heterogeneity when applying pelvic IVIM. This will allow standardization of the imaging protocol for subsequent validation in multicenter studies.
Wu et al. tried to address this important question by using different ranges of b values (0–1000 s/mm2 versus 0–2000 s/mm2) to fit the IVIM model and assessed the diagnostic performance of the IVIM-derived parameters in differentiating cervical cancer from normal cervix [8]. They found that the IVIM parameters derived from the higher-range b values (0–2000 s/mm2) performed better than their counterparts but both were able to distinguish cervical cancer from normal tissue, making no clinical impact in diagnosis [8]. However, the range of low b values remained the same in the two groups and the authors did not address the effect of choice of low b values that could significantly affect the f and D* estimations. In other organs, like the liver and pancreas, a simplified IVIM model based on three b values showed promising results in lesion characterization [50, 51]. If this could be transferrable to the female pelvis and results are reproducible as those in the upper abdomen, it will greatly reduce IVIM acquisition time and potentially allow integration of IVIM into clinical practice.
It is increasingly recognized that the water diffusion in biological tissues derived from DWI does not always follow a Gaussian process [5,52–54]. As alluded earlier, the signal attenuation on DWI was better ascribed by IVIM in cervical cancer [6]. Apart from IVIM, there are other nonmonoexponential models that can be applied in female pelvic imaging and potentially provide different aspects of tumor biology and microstructures.
In the exploratory study by Winfield et al., the authors fitted the signal attenuation of DWI in cervical cancer with different models, namely the monoexponential, the stretched exponential, kurtosis, statistical, and IVIM [31]. They found that the preferred models were IVIM and stretched exponential in 43% and 36% of the cervical cancers evaluated (n = 42), respectively. Furthermore, it was found that f and D* from IVIM and a from the stretched exponential model (water diffusion heterogeneity index) were significantly different between histological subtypes whereas D from IVIM was significantly different between tumor grades [31]. The results were reproducible in a larger cohort (n = 71) except for a, for which there was no statistical difference between SCC and ACA subtypes [7]. Both studies agreed and suggested that parameters from these models provided different and additional information on tumor properties, other than that provided by ADC in the monoexponential model [7, 31].
Clinically useful parameters have to be robust and reliable. Previous studies have shown that repeatability of IVIM parameters is generally poor, especially with f and D*, having a coefficient of variation (CV) larger than 20% [44,55–57]. Reliable estimates of f and D* are dependent on a high SNR and this is higher for D* than for f [58]. In the presence of a high level of noise, f and D* were overestimated whereas D was underestimated [58]. These limitations potentially hinder the clinical application of IVIM in the female pelvis. There are suggested methods to improve the estimation certainty of IVIM by averaging over the ROI [58], using the Bayesian probability approach in model fitting [59], applying fusion bootstrap moves [60], and using image denoising [61]. Future research work is required for improving the estimation of IVIM parameters and data reproducibility, specifically in female pelvic diseases. Furthermore, there is also the unresolved challenge of standardization across different MRI platforms.
15.3 Other Applications of IVIM in the Female Pelvis
The application of IVIM in other female pelvic diseases is very limited, but there is emerging evidence that IVIM may have a role in other malignant and benign diseases affecting the female reproductive organs.
15.3.1 Malignant Diseases
In ovarian cancer, lower D and f values were associated with high- grade epithelial ovarian cancer, while D showed a high performance on ROC analysis in differentiating high-grade from low-grade ovarian tumors (AUC > 0.900) [62]. The lower D in high-grade epithelial ovarian cancer is conceivable as D is commonly a surrogate measure of tumor aggressiveness. In the same study, the authors fitted the data using the stretched exponential model and found that both f and a performed less well than D (f and a, AUC ranging from 0.667 to 0.774) but suggested that both parameters provided information other than information on water diffusion [62]. Nevertheless, an earlier study suggested that the stretched exponential model provided a better fit of the diffusional signal from ovarian cancer and its metastases and IVIM was not a suitable fit for the data due to poor repeatability, hence the unreliability as clinically useful quantitative parameters [57].
An exploratory study applying IVIM in endometrial pathology showed that f was lower in the endometrial malignancy compared to normal endometrium, but surprisingly malignancy had a higher D than normal endometrium [63]. The latter finding was not concordant with previous studies that showed lower ADC in endometrial malignancy compared to normal endometrium [64–66]. One potential explanation for this discrepancy could be related to the age of the normal subjects, in which the menopausal status may affect the endometrial DWI signal.
Other than primary pelvic female malignancy, researchers attempted to evaluate the value of IVIM in determining metastatic pelvic nodal disease in cervical cancer but failed to demonstrate its superiority [67]. In this recent study, 157 lymph nodes with high DWI signals were mapped with the surgical specimens to determine their malignant status. Although the authors found that metastatic pelvic lymph nodes had higher D and lower f values, the IVIM parameters did not perform better than size criteria, only achieving areas under the ROC curves in-between 0.610 and 0.633, whereas the short-axis measurement could achieve a higher diagnostic performance (area under ROC curve 0.844). Therefore, on the basis of this study, no additional benefit of IVIM was found in the assessment of pelvic nodal disease.
15.3.2 Benign Disease
With the use of MRI-guided high-intensity focused ultrasound (HIFU) as a nonsurgical therapeutic option for uterine leiomyoma, there is a need for optimal patient selection and to monitor treatment efficacy. To select suitable patients for MRI-guided HIFU, Funaki classification is commonly used, which is based on the T2- weighted signal of the uterine leiomyoma (Type I signal, similar to that of the skeletal muscle; Type II signal, between the signals of the skeletal muscle and the myometrium; and Type III signal, greater than that of the myometrium) and correlates with treatment outcome, whereby response is poor in Type III leiomyoma [68]. Type III uterine leiomyoma tends to enhance avidly and is thought to be highly perfused, in which MRI-guided HIFU has not been shown to be effective [69]. The f was found to be significantly higher in Type II uterine leiomyoma compared to Type I after correction of the T2-weighted effect on the image [70]. This indicates that the potential of IVIM is tissue characterization of uterine leiomyoma, providing quantitative biometrics in patient selection for MRI-guided HIFU, more objective than the qualitative Funaki classification. However, the study was limited by the lack of Type III uterine leiomyoma, and whether the findings can be translated to clinical use is yet to be examined.
The treatment response assessment of MRI-guided HIFU is usually done through contrast-enhanced MRI or DCE MRI [69]. Ikink et al. showed that the ADC derived from low b values (£200 s/mm2) decreased significantly in treated uterine leiomyoma following MRI-guided HIFU but the value increased if high b values were used (≥400 s/mm2) [71]. The former observation was likely due to the reduced perfusion in the ablated tissue, and this concurred with the visual assessment on contrast-enhanced MRI. The increase in ADC derived from the set of high b values could be explained by the expansion of the extracellular volume following treatment [71]. Potentially, IVIM can be used to monitor treatment efficacy following MRI-guided HIFU in uterine leiomyoma, without the dependence on gadolinium-based MRI contrast agent.
15.3.3 Treatment-Related Changes in the Pelvis
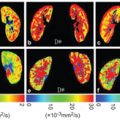
Pelvic radiotherapy is commonly used in treating gynecological malignancy, and it is well known that radiation induces injury to the pelvic marrow, manifesting as hematological toxicity (HT) and skeletal complications [72, 73]. In a cohort of locally advanced cervical cancer patients who underwent CCRT, we observed the IVIM signal changes in the pelvic marrow during CCRT [74]. In patients who suffered from HT, that is, those who required blood transfusion or interruptions to their treatment due to thrombocytopenia or neutropenia, had an associated rise in D after four weeks of CCRT compared to baseline measurement (Fig 15.5). Although f increased from the baseline, there was no difference in the pattern observed between patients who suffered from HT and those who did not (Fig 15.6) [74]. IVIM parameters appear to be able to monitor the microenvironmental changes in the pelvic marrow induced by radiation, offering a way to identify the subregion of the pelvis more susceptible to irradiation damage and allowing more precise radiation planning. Nevertheless, its clinical application will require prospective research and a larger study cohort with a longer follow- up to understand the long-term implications of these parametric changes in IVIM.
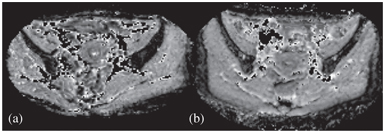
Figure 15.5 D maps at the level of the ilium before (a, baseline MRI) and after (b, Week4 MRI) CCRT in a patient who suffered from HT. Note the increase in the ilium marrow signal at MRI-2. Reprinted from Ref. [74], with permission from John Wiley and Sons, copyright 2017.
Related posts:
 IVIM MRI: A Window to the Pathophysiology Underlying Cerebral Small Vessel Disease
 Clinical Applications of IVIM MRI to the Nervous System
 Head and Neck IVIM MRI
 Assessment of Liver Tumors with IVIM Diffusion-Weighted Imaging
 Flow-Compensated IVIM in the Ballistic Regime: Data Acquisition, Modeling, and Brain Applications
 IVIM MRI in the Kidney
Stay updated, free articles. Join our Telegram channel

Full access? Get Clinical Tree


