CHAPTER 16 Clinical Techniques of Cardiac Magnetic Resonance Imaging
Functional Interpretation and Image Processing
Accurate assessments of global and regional left and right ventricular (LV and RV) function are important when managing patients with cardiovascular disease. Magnetic resonance imaging (MRI) has been developed to characterize cardiac function, yielding high-quality images in patients, regardless of body habitus. Using fast imaging protocols with high temporal resolution, MRI allows one to identify resting and stress-induced changes in LV wall motion to predict the contractile reserve in patients with ischemic heart disease, detect improvement in regional LV performance after coronary artery revascularization1 or transmyocardial placement of stem cells,2 and visualize evidence of ethanol ablation of the myocardium in patients with hypertrophic obstructive cardiomyopathy.3 With MRI, RV function can be defined in those with congenital heart disease,4 arrhythmogenic right ventricular dysplasia (ARVD), and primary pulmonary hypertension.5 The purpose of this chapter is to describe the various MRI techniques used to assess LV and RV function.
IMAGE ACQUISITION TECHNIQUES
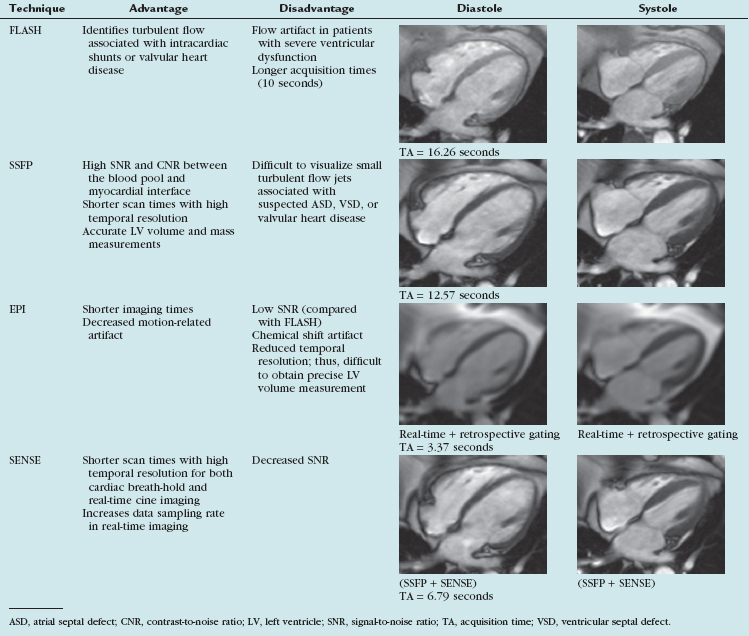
“White blood” imaging with fast field gradient-echo, or steady-state free precession (SSFP), sequences provides the basis whereby cine images of LV and RV mass, volume, and ejection fraction (EF) are determined with MRI.6 By grouping the phase encodes and coordinating image acquisition with the rhythmic contraction of the heart, crisp, clear images of cardiac contraction can be obtained in 2 to 4 seconds.
Steady-State Free Precession
Limitation
This technique underestimates turbulent flow associated with intracardiac shunts or valvular heart disease (Table 16-1).
Description
SSFP imaging exhibits high signal-to-noise ratio (SNR) and high contrast-to-noise ratio (CNR) with the blood-myocardial interface. With SSFP, cine MR images depict the endocardial surface, regardless of blood flow velocity.7,8 This technique can be used with brief repetition times repetition times (TR) (<3 ms), leading to short scan times with high temporal resolution. Studies comparing FLASH and SSFP imaging have demonstrated significant improvements with SSFP in the blood-myocardial interface in patients with decreased LV ejection fraction.9 With short echo times of less than 1.5 ms, the blood pool within the cavity appears more uniform and image quality is not hampered by turbulent flow.
Echo-Planar Imaging
Limitation
Because of low spatial and temporal resolution, this technique is not well suited for precise determination of volumes and EF.10
Sensitivity Encoding Parallel Imaging
Indication
The sensitivity-encoding (SENSE) technique obtains images during short periods of breath-holding.
Description
This technique uses sensitivity information from multiple coil elements to correct for k-space undersampling in the post-Fourier domain. Each coil has a different sensitivity profile so that undersampled acquisitions may be unfolded that result in decreased scan time. Images produced with the SENSE technique exhibit consistent contrast, with preserved spatial resolution (see Table 16-1).
TECHNIQUE FOR ASSESSING QUANTITATIVE ANALYSIS OF MYOCARDIAL MOTION
Tagged Imaging
Limitation
With this technique, it is difficult to measure LV function along the LV epicardial and endocardial surfaces.11
Description
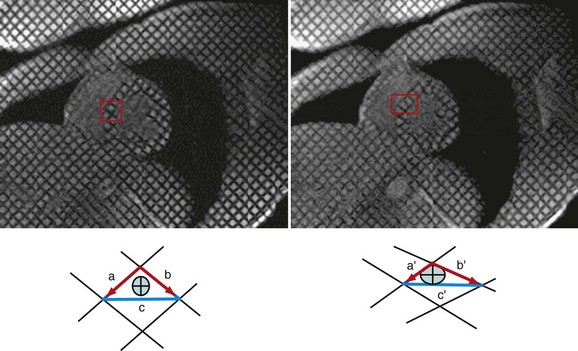
Myocardial motion can be tracked in one, two, or three dimensions using tissue tagging.12,13 With tagging, dark saturation bands, or “markers,” are placed across the myocardium for the purpose of quantifying LV function. These markers are induced by prepulse sequences applied immediately after the R wave, usually in planes perpendicular to the imaging plane. Quantification of intramyocardial deformations can be accomplished by tracking the intersection points of the tagging lines to demonstrate myocardial rotation, contraction, relaxation, and strain (Fig. 16-1). The SPAMM (spatial modulation of magnetization) technique,14 uses two perpendicular sets of parallel lines that form a rectangular grid on the image that can be tracked throughout the cardiac cycle. These tagging lines move with the myocardium during the contraction and relaxation phases of the cardiac cycle (see Fig. 16-1).
As soon as the images are acquired, there are three methods for extraction of motion data from tagged images: (1) tracking the dark tag lines as intensity minima; (2) eusing optical flow analysis; or (3) applying harmonic phase (HARP) determinates. All three of the tracking methods (Table 16-2) are highly accurate for assessing midwall myocardial function but exhibit some difficulty for discriminating tag intersection points near the epicardial and endocardial surfaces.11
TABLE 16-2 Technique for Assessing Quantitative Analysis of Myocardial Motion
| Technique | Advantage | Limitations |
|---|---|---|
| Tagged imaging | Provides the data suited for strain assessment. | |
| Phase contrast imaging | ||
| DENSE | Provides regional LV myocardial function assessments across the endocardium, mid wall, and epicardium. | Requires experienced center and specialized software |
DENSE, displacement encoding with stimulated echoes technique; LV = left ventricle; TDI, tissue Doppler imaging.
Phase-Contrast Velocity Mapping
Description
The change in the phase of the net magnetization inside each pixel is proportional to the velocity of the tissue during systole and diastole. Studies by Markl, Kvitting, and colleagues15,16 have demonstrated the utility of this technique for tracking LV displacement in a manner similar to that performed with tissue Doppler imaging (TDI) during transthoracic echocardiography. Paelinck and associates17
Stay updated, free articles. Join our Telegram channel

Full access? Get Clinical Tree


 FIGURE 16-1