6 | Common Errors in the Doppler Ultrasound Display of Uterine Blood Flow and Fetal Vessels |
Correct Display of Vessels with Normal Instrument Settings
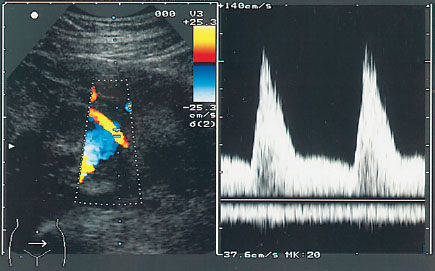
Fig. 6.1 Uterine a. Color Doppler display of the uterine a. crossing over the iliac vessels. Acute angle of incidence, indication of a notch in the spectrum.
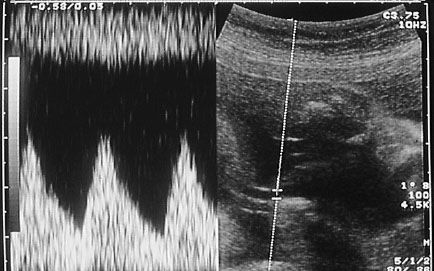
Fig. 6.2 Optimal method of examining the umbilical a. The umbilical a. is shown with forward flow, the umbilical v. with reverse flow (upper margin of display).
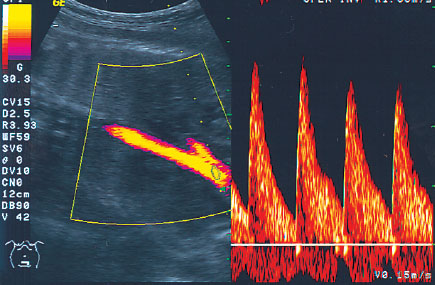
Fig. 6.3 Fetal aorta. Acute angle, legend at the margin of the display, wall filter and pulse repetition frequency (PRF) at optimal setting. Spectrum unremarkable.
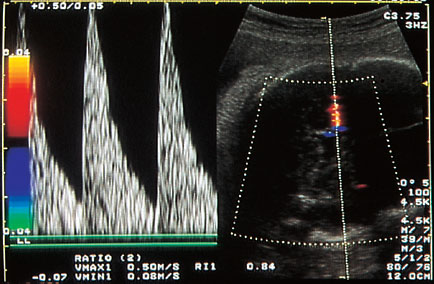
Fig. 6.4 Middle cerebral a. Angle almost 0°, optimal PRF, and sample time duration optimizes the flow profile. Unremarkable spectrum.
Role of the Angle in the Doppler Examination
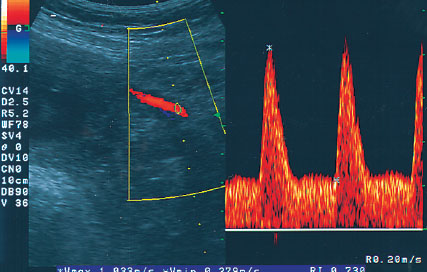
Fig. 6.5 Uterine a. Displayed is the origin of the vessel on the other side of the iliac crossing. The Doppler angle is more obtuse than in Fig 6.1. The resistance index (RI) is elevated and there is a visible notch.
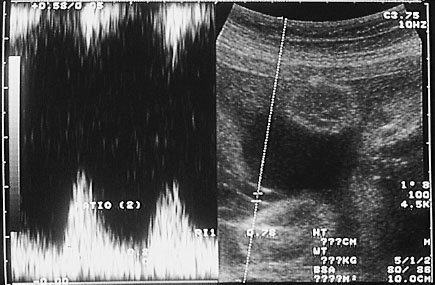
Fig. 6.6a Display of the umbilical a. Because the vessel is poorly focused, the spectrum is not homogenous, the RI is elevated, and the umbilical v., shown in reverse flow, is displayed only partially.
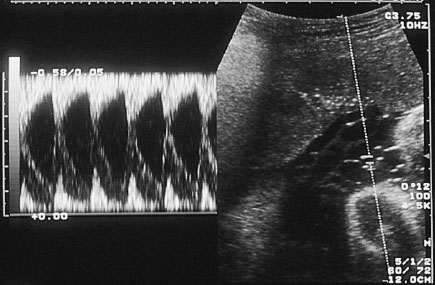
Fig. 6.6b The umbilical aa. are displayed three times in this spectrum: 1. Reverse flow, 2. Forward flow with a high RI, 3. Forward flow with a low RI. When a choice must be made between several such curves, the problems posed by the examination of umbilical aa. become clear.
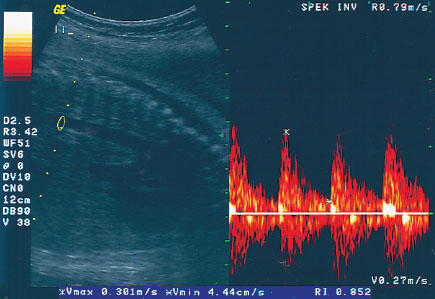
Fig. 6.7a The fetal aorta has been examined with a poor angle of almost 90° in the center of the display. The RI is almost 85%.
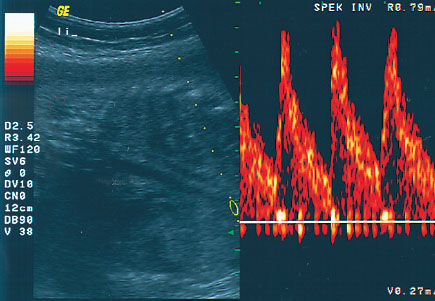
Fig. 6.7b The same aorta as in Fig. 6.7a examined a little later with an acute angle and at the margin of the display. Result: Normal spectrum, unremarkable RI of ca. 75%.
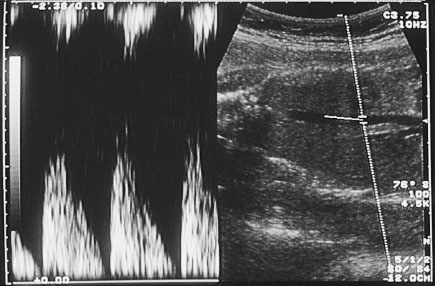
Fig. 6.8a Display of a fetal aorta examined with a 90° angle. The incorrect examination technique results in zero flow in the aorta.
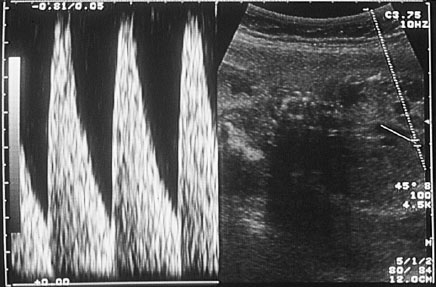
Fig. 6.8b The same vessel examined a few seconds later with a Doppler angle of 45°. Result: Normal flow profile; normal RI.
Possible Sources of Error in Doppler Ultrasound Examinations of Maternal and Fetal Vessels
Displaying the Uterine Artery
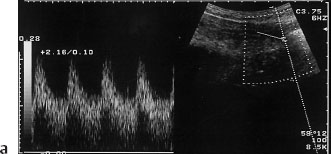
Fig. 6.9a Typical flow profile of a uterine a. with an elevated diastole and a RI of about 50%.
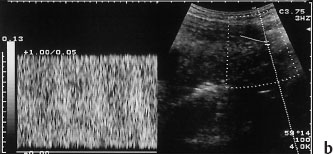
Fig. 6.9b Same vessels as in Fig. 6.9a. Error: PRF is set too low, with the result that no Doppler spectrum is displayed.
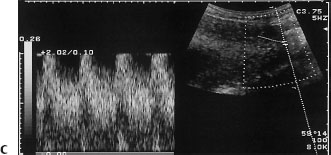
Fig. 6.9c The PRF is adapted, the Doppler spectrum appears. However, systole continues to be incomplete and appears as a “peak” above the baseline.
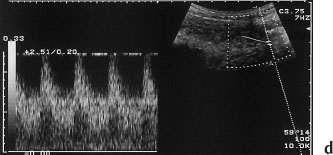
Fig. 6.9d In this case the spectrum of the uterine vessel is displayed optimally; the waveform can be evaluated.
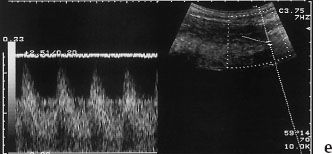
Fig. 6.9e A venous uterine vessel appears in reverse flow.
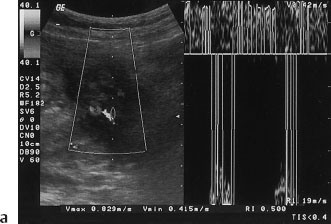
Fig. 6.10a Uterine a. The vessel has been detected in B-mode by color Doppler and has been captured by the Doppler beam at an acute angle. The right-hand spectrum cannot be evaluated: The baseline is too elevated and the waveform has been cut off by the upper margin of the display. The waveform displayed by the instrument suggests an elevated systole, but this cannot be confirmed visually. In this case the waveform is somewhat unfavorable, not very helpful.
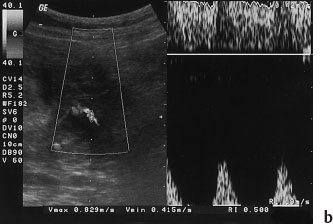
Fig. 6.10b Uterine a. Error: Baseline too high.
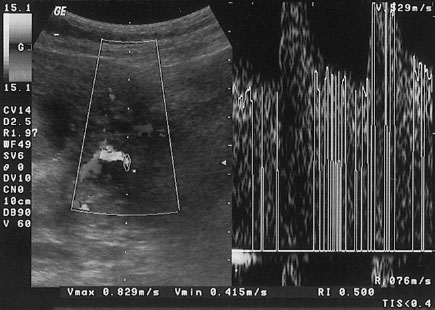
Fig. 6.10c Error in the display of the uterine a. The waveform displays faulty curves, due to too low amplification. Systole is incomplete.
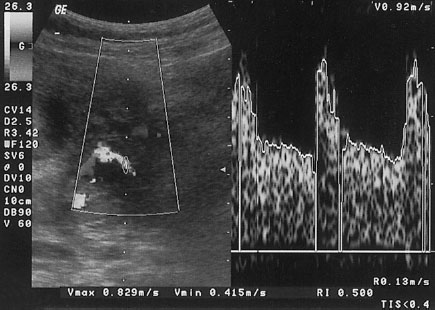
Fig. 6.10d The spectrum displaying the flow of the uterine a. is complete here. The waveform represents the course of diastole correctly.
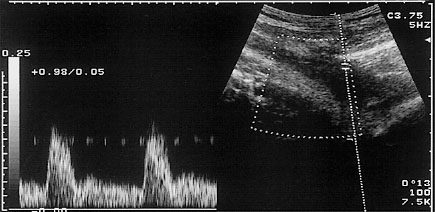
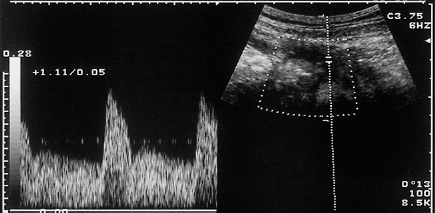
Fig. 6.11a Notched uterine a.
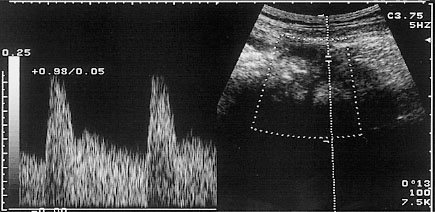
Fig. 6.11b Incomplete display ofthe systole of a uterine a. PRF set too low. Notch.
Displaying the Umbilical Artery
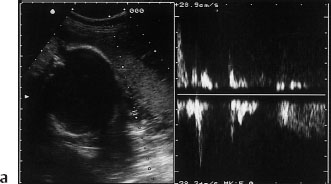
Fig. 6.12a Display of the umbilical a. Error: The waveform cannot be interpreted, since neither systole nor diastole was recorded uniformly. The Doppler beam did not encompass the coil of the umbilical cord in continuity.
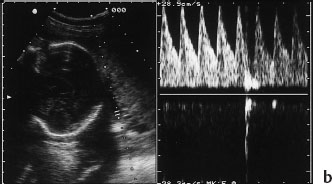
Fig. 6.12b The umbilical cord has been encompassed in continuity, the spectrum is continuous. Error: The wall filter is too high. Systole is cut off. Possible corrective actions: Lower baseline; reduce wall filter.
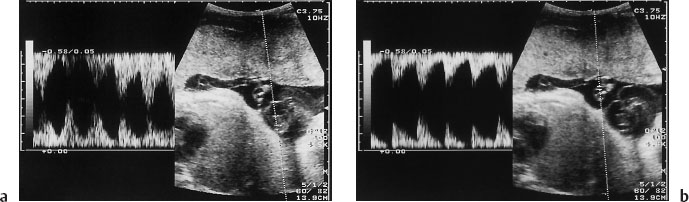
Fig. 6.13 a, b Display of umbilical a. Each figure shows two coils of umbilical cord caught by the Doppler beam. As a result there is a tracing on the baseline with forward flow, and a second curve at the upper margin of the display with reverse flow. When the waveform is not homogeneous, it is not possible to derive Doppler parameters.
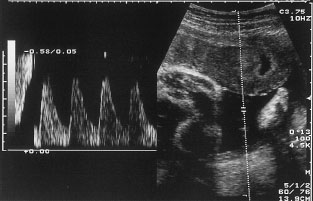
Fig. 6.14 Umbilical a. with characteristic sawtooth pattern. In the first part of the tracing the spectrum is inverted.
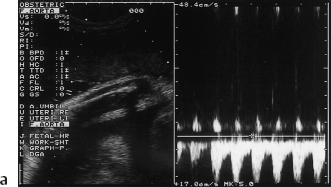
Fig. 6.15a Umbilical a. The spectrum is inverted, systolic peaks are cut off and appear at the upper margin of the display.
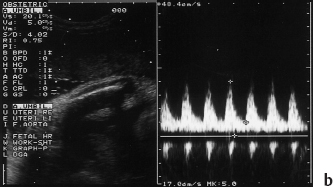
Fig. 6.15b The waveforms in Fig. 6.15a have been corrected. The angle is set too high, resulting in a curve that does not touch the baseline.
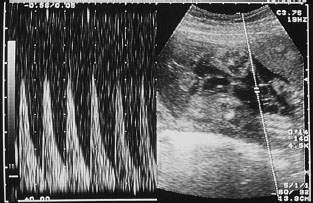
Fig. 6. 16 Umbilical a. Background noise is too strong in this examination of the vessel. Sample duration too high.
Displaying the Fetal Aorta
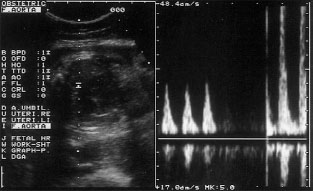
Fig. 6.17 Display of fetal aorta. Error: The B-mode display is indistinct. The curve is incomplete. The faulty choice of a too high wall filter leads to an erroneous impression of zero flow.
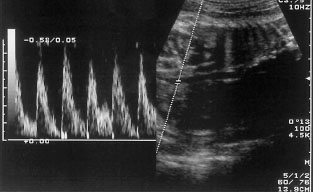
Fig. 6.18 Display of fetal aorta. Error: Angle ca. 80°. Result: The RI of the curve displayed will be abnormal by being falsely elevated, since the Doppler angle is not <60°.
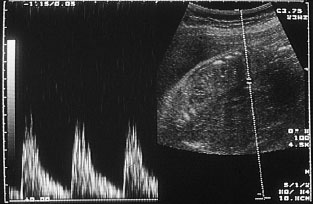
Fig. 6.19 Fetal aorta. The vessel has been examined in the center of the display, rendering the recording of the spectrum unproductive.
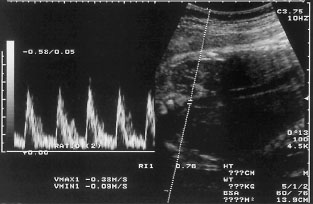
Fig. 6.20 Fetal aorta displayed with an obtuse Doppler angle. RI: 76%, unremarkable. The correct examination appears at the left margin of the display.
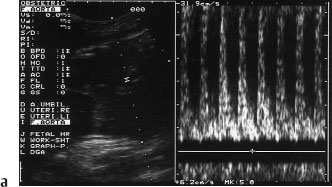
Fig. 6.21a Fetal aorta. The sample duration has been set too high, with the result that the diastole cannot be viewed and noted. The tracing does not lie on the baseline, indicating faulty filter setting.
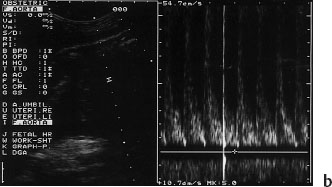
Fig. 6.21b The filter error has been insufficiently corrected and the record of the Doppler spectrum is even more blurry than in Fig 6.21a. The B-mode image does not allow an evaluation of the Doppler angle.
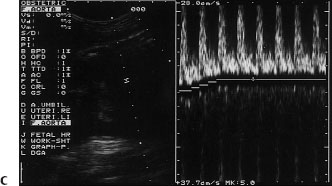
Fig. 6.21c In this display the baseline is set too high and has been corrected upward in error. The result is that systole has been cutoff and the peaks appear at the bottom of the display.
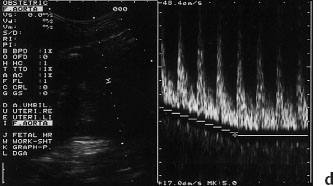
Fig. 6.21d The baseline has been corrected to its proper level. The filter is still too high; the B-mode image blurry.
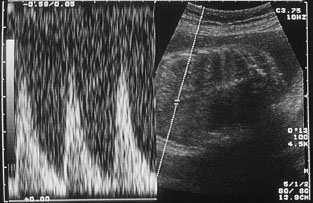
Fig. 6.22 Fetal aorta. Error: Strong background noise blurs the contour of the Doppler spectrum. Correction: Reduced amplification.
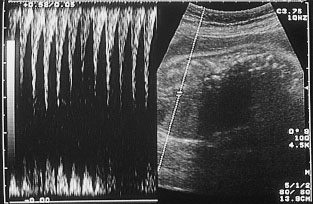
Fig. 6.23 Fetal aorta. Error: The waveform tracing shows reverse flow. Systole lacks homogeneity. A venous vessel is seen in forward flow. B-mode image shows a poorly selected Doppler angle. Correction: Invert the angle.
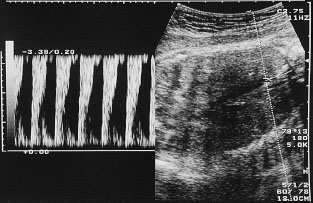
Fig. 6.24 Fetal aorta. Error: Tracing shows reverse flow. Faulty angle, resulting in falsely showing reverse flow in the vessel. Diastole can only be presumed at the upper margin of the display. Correction: Inversion, adaptation of the PRF, correction of the angle of incidence.
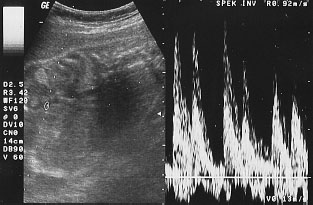
Fig. 6.25 Doppler signal in the fetal aorta during arrhythmia. Doppler parameters in this situation are inadmissible. Conclusions are only valid for orientation.
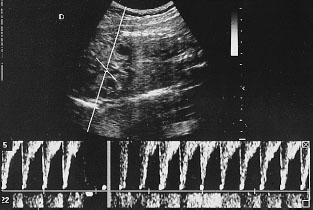
Fig. 6.26 Fetal aorta. Error: Angle reading in the B-mode image is incorrect. 60° was set, but this does not follow the actual course of the aorta. The spectrum is inverted; baseline shift has not been utilized.
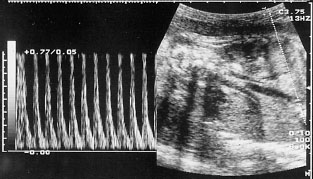
Fig. 6.27 Fetal aorta: Error: Sample duration set too high. Systole cannot be delimited. Angle not set optimally. Correction: Reduce sample rate, if necessary raise PRF.
Displaying the Middle Cerebral Artery
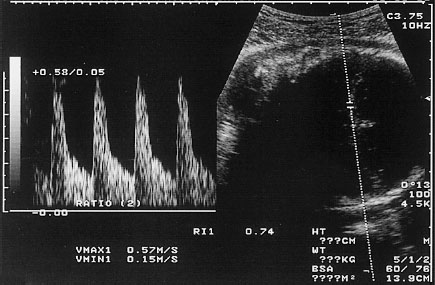
Fig. 6.28 Middle cerebral a. with diastolic flow. The result is a low RI of 74%. The angle is correctly acute.
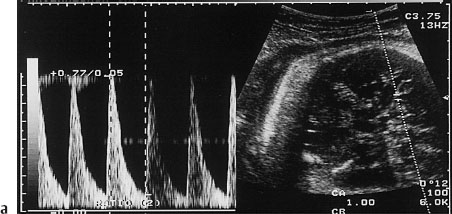
Fig. 6.29a Middle cerebral a. Correct display: Optimal angle, PRF, and sample duration set correctly. Systole and diastole well displayed. RI unremarkable.
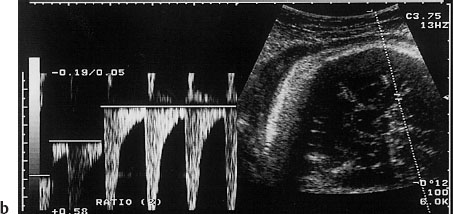
Fig. 6.29b Incorrect display. Spectrum inverted, baseline shifted in wrong direction, systolic peaks appear at the upper margin of the display.
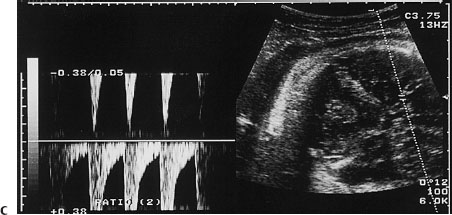
Fig. 6.29c Baseline and direction of flow incorrect. Correction: Shift baseline downward and invert.
Related posts:
 Diagnosis of the Uterine Tube by Transvaginal Sonography
 Doppler Sonography in Obstetrics—Screening At-Risk Populations
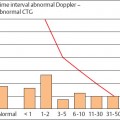
 Doppler Ultrasound and the Cardiotocogram
 Doppler Ultrasound in the Diagnosis of Fetal Anomalies
 Vascular Supply of the Uteroplacentofetal Unit and Techniques for the Examination of Individual Vessels
Stay updated, free articles. Join our Telegram channel

Full access? Get Clinical Tree


