9 | Doppler Sonography in Obstetrics—Screening At-Risk Populations |
The purpose of Doppler screening is to separate an at-risk group from the total population of pregnant women for further diagnostic studies, more intensive monitoring, and treatment. The goal is to improve obstetric results when compared to an unexamined population. However, before establishing a Doppler screening program we must assess the diagnostic and clinical validity of the Doppler technique.
The diagnostic validity of Doppler ultrasound in obstetrics may be measured by the reliability with which an abnormal Doppler finding is associated with an abnormal pregnancy as determined by research studies. The statistical criteria for diagnostic validity are the sensitivity and specificity of a test. The sensitivity of a test indicates how many abnormal cases are identified correctly (true positive/[true positive + false negative]). The specificity of a test indicates the proportion of genuinely healthy individuals in a test cohort (true negative/[true negative + false positive]). This implies that healthy individuals may be falsely classified as diseased, while genuinely diseased individuals may not be recognized. A good screening test should be easy to perform, cost-effective, noninvasive, and effective. One hundred percent sensitivity and specificity is an unattainable ideal in medicine (Table 9.1).
Tab. 9.1 Testevaluation
Actual | Test | |
|---|---|---|
Positive | Negative | |
Positive | TP | FN |
Negative | FP | TN |
TP = True positive
TN= True negative
FP = False positive
FN = False negative
Important statistical concepts
Sensitivity: TP/(TP + FN)
Specificity: TN/(TN + FP)
Negative predictive value: TN/(TN + FN)(TN rate)
Positive predictive value: TN/(TP + FP)(TP rate)
Efficiency: (TP +TN)/n
Prevalence: (TP + FN)/n
Validity of a Test
A suitable way to test the robustness of several indices is to compare their test validity. A tried and tested way of performing such a comparison is to construct a relative (receiver) operating characteristic (ROC) curve. For this purpose the sensitivity and specificity for a number of diagnostic threshold values are calculated and plotted. The ordinate represents the sensitivity from 0– 100%, the abscissa the specificity from 100–0%. The curves are constructed by selecting five to six threshold values from both the normal and abnormal range of the test used. Any point on such a curve represents both the sensitivity and the specificity at that point. The maximal perpendicular distance of the curve from the diagonal of the diagram (line of chance) is a measure of the validity of the test (Fig. 9.1). The curve of a test shows the increase in sensitivity in its ascending part, coincident with the decline in specificity. In the horizontal part any increase in sensitivity results in an ever larger loss of specificity. The apex of the curve represents the optimal validity of the test, since here maximal sensitivity coincides with maximal specificity. If the curves of different tests are entered into the diagram, the different tests can be compared objectively (validation). The curve with an apex closest to the upper left hand corner of the diagram represents the superior test.
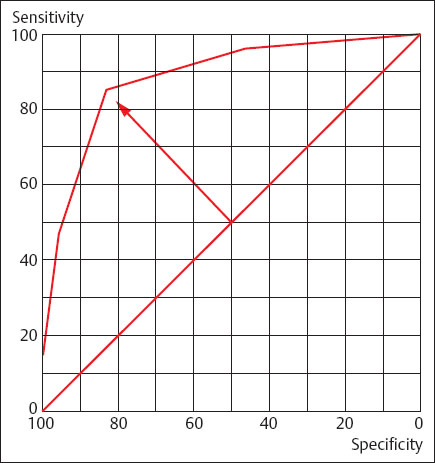
Fig. 9.1
Related posts:
 Diagnosis of the Uterine Tube by Transvaginal Sonography
 Umbilical Cord Complications and Doppler Ultrasound
 Doppler Ultrasound Findings Near Term
 Doppler Ultrasound in the Diagnosis of Fetal Anomalies
 Diagnostic Sonography of Blood Flow in Breast Tumors
 Vascular Supply of the Uteroplacentofetal Unit and Techniques for the Examination of Individual Vessels
Stay updated, free articles. Join our Telegram channel

Full access? Get Clinical Tree


