16 | Doppler Ultrasound Findings Near Term |
To estimate the time of delivery and determine whether the fetus is postterm, an ultrasound examination must be performed early in pregnancy. It should include crown–rump measurement and correction of gestational age if indicated.
Physiological Findings in the Late Stages of Pregnancy
Late pregnancy and delivery are marked by increased demands by the fetus with only minimal growth of the supply organ, the placenta.
The blood flow rate in the uterine aa. increases steadily throughout pregnancy, from 190mL/min before pregnancy to about 680 mL/min in late pregnancy. The mean diameter of the uterine a. expands from 1.6 mm before pregnancy to 3.7 mm near term. The ratio of the mean peak systolic velocity to the mean maximal end-diastolic velocity decreases from a mean value in the non-pregnant woman of 5.3 (resistance index [RI]: 0.81) to 2.3 (RI: 0.57) near term.
The mass of the placenta increases steadily from about 6 g at six weeks’ amenorrhea to over 500 g at term. The fetus grows considerably faster than the placenta, with the result that the ratio of the weight of the placenta to that of the fetus decreases from 1.16 at 16 weeks to 0.13 at term. Very early Doppler recordings show a rise of mean placental perfusion in the course of pregnancy from ca. 100 mL/min at 22 weeks of gestation to a maximum of over 320 mL/min at 37–38 weeks. After that the last two weeks show a regression to ca. 300 mL/min. The relation of the infant’s weight to blood flow volume is constant at 120 mL/kg/min until the 36th to 37th week of pregnancy. During the final stage of pregnancy this number, too, may regress to 90 mL/kg/min. At the same time the RI declines from 0.6 at 28 weeks of gestation to 0.5 at term.
Concurrently, the quantity of amniotic fluid declines, and the vernix caseosa disappears from the fetal skin, a sign that the nutritive function of the placenta is reduced.
The signs of maternal adaptation to the pregnancy gradually disappear: The hematocrit rises again, the blood pressure returns to its value before the pregnancy, the sensitivity to angiotensin II returns to normal values, and edema of pregnancy may subside.
The conditions affecting the responses of the fetal circulation include a relative reduction in placental tissue available for nutrition and gas exchange, as well as an absolute reduction in fetoplacental blood flow.
Aorta: Quantitative Analysis
In the early years of Doppler ultrasound use in obstetrics, quantitative measurements were obtained from the uteroplacentofetal unit. The largest vessel that can be accessed easily is the aorta. Hence one of the first reported results was that of a relative blood flow in the descending aorta of 185 (±7.6)mL/min/kg estimated fetal weight.
A number of groups determined and published other parameters during the course of pregnancy. Mean blood flow velocity (temporal average of spatial average velocity [TASAV]) ran between 26.5 cm/s and 34.6 cm/s, with a median of 29.0 cm/s. The relative mean blood flow amounted to between 169 mL/min/ kg and 246 mL/min/kg, with a median of 220 mL/min/ kg. The systolic peak velocity (Mvmax) was between 70 cm/s and 118 cm/s, with a median of 100 cm/s. At term mean aortic stroke volume was reported to be 5.4 (± 1.6) mL, the relative aortic stroke volume 1.8 (± 0.5) mL. The mean systolic diameter of the aorta was 7.3 (± 1.1) mm, the mean diastolic diameter 6.3 (± 1.1) mm. The mean effective aortic diameter, determined by echo markers, was 7.0 (± 1.1) mm.
In our own study of blood flow in the descending aorta we found that most values increased between the 24th week of gestation and delivery, though the range was wide.
All quantitative determinations of blood flow, then, varied widely both in normal and abnormal pregnancies. One reason for this was the equivocal and imprecise determination of the diameter of fetal blood vessels by ultrasound. Clinicians were disappointed, since their expectation that ultrasound would provide them with a precise method to measure blood flows was not fulfilled.
Aorta: Qualitative Analysis
The effective breakthrough for Doppler ultrasound came through the interpretation of the waveform of the Doppler sonogram, either by itself or combined with quantitative measurements. Impedance and pulse wave reflections became more important for the interpretation of Doppler sonograms than comparisons of blood flow volumes. In spite of technological advances, it is easier to obtain qualitative rather than quantitative results, especially since they are more or less independent of the insonation angle.
As a result blood flow even in small vessels could be analyzed, and so the aorta gradually lost its importance, while interest in the cerebral aa., as well as other peripheral vessels such as the renal aa., gained ground.
The systolic/diastolic variations of the aortic sonogram were analyzed in many ways. Most often the analysis utilized 2-point indices: the ratio of systolic maximum to diastolic minimum of the waveform ((S/D ratio; Stuart) and the resistance index (RI) (of Pour-celot). In a few instances the 3-point pulsatility index (PI) (of Gosling) was used because of its additional sensitivity to changes in the waveform between the maximum and the minimum. An interesting but complicated method of analysis is the frequency index profile (FIP) (Fig. 16.1).
A longitudinal examination of the aorta showed no major changes in the values obtained from the thoracic aorta during the last trimester: The peak velocity was 115.6 (± 9)cm/s, the PI 1.96 (± 0.31), the percentage acceleration time 19.2 (± .2)%, the rising slope 25.7( ± 5.6), and the descending slope 4.5 (± 0.9). The same applies to the abdominal aorta: The peak velocity was 99.5 (± 18.8) cm/s, the PI 1.68 (± 0.28), the percentage acceleration time 19.1 (± 3.3)%, the rising slope 29.9 (± 4.9), and the descending slope 5.3 (± 0.9).
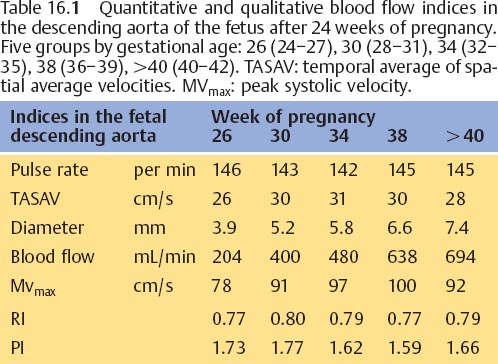
The mean blood flow velocity in the aorta surely rises between the 17th and 32nd weeks of gestation, then remains constant until the calculated term, after which it declines again until the 42nd week. Table 16.1 provides an overview of the most important quantitative and qualitative indices of blood flow after the 24th week of gestation.
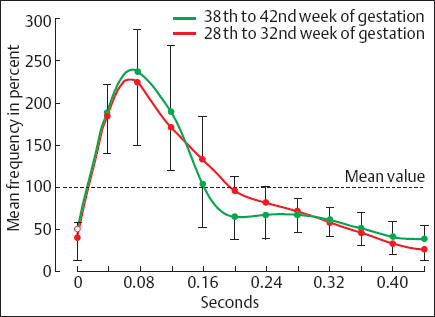
Fig. 16.1 Normalized waveforms of the descending aorta in the early and late third trimester: nomogram ± 2 standard deviations. The waveform has clearly changed in the late third trimester compared to the early third trimester. Specifically it shows a postsystolic notch (from Griffin et al. 1983).
Cerebral Arteries
The prevailing state of blood flow to the brain makes this a very important region. Vessels that may be examined include the common and internal carotid aa., and the arteries supplying the circle of Willis, namely the anterior, middle and posterior cerebral as. In the early days of Doppler ultrasound, the offset Dopplers then in use made it much easier to analyze the carotid aa. than the arteries of the circle of Willis. Nowadays the latter are imaged more easily with the use of a sector scanner with an integrated Doppler. This applies especially to the middle cerebral a., which can be displayed in the Doppler beam at an optimal, almost 0° angle.
Common Carotid Artery
Velocity of flow in the common carotid a. increases throughout pregnancy. The PI declines sharply after the 32nd week of gestation.
Middle Cerebral Artery
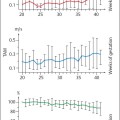
The waveforms of the middle cerebral a. typically display a biphasic pattern during continuous forward flow in diastole. The values of RI in the sonogram decline markedly at the end of pregnancy (Fig. 16.2). In another study the S/D ratio declined significantly from 6.89 (±1.48) at 25 weeks of gestation to 4.23 (±0.67) at term.
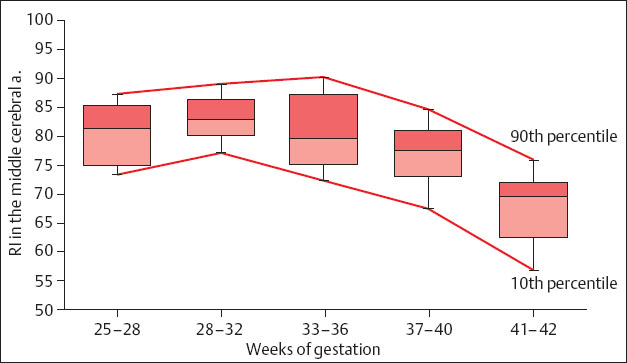
Fig. 16.2 Values of the RI of fetal intracranial flow curves in normal pregnancies. The boxes correspond to the 25th and 75th percentile and include the median. The whiskers mark the 10th and 90th percentiles for each pregnancy period (from Kirkinen et al. 1987).
Renal Arteries
In the course of pregnancy the PI declines from the 18th to the 22nd week of gestation from 3 to 2. This suggests a marked reduction in impedance and, hence, possibly an increase in renal perfusion.
Femoral Arteries
Related posts:
 Diagnosis of the Uterine Tube by Transvaginal Sonography
 Doppler Sonography in Obstetrics—Screening At-Risk Populations
 Doppler Ultrasound and the Cardiotocogram
 Doppler Ultrasound in the Diagnosis of Fetal Anomalies
 Diagnostic Sonography of Blood Flow in Breast Tumors
 Vascular Supply of the Uteroplacentofetal Unit and Techniques for the Examination of Individual Vessels
Stay updated, free articles. Join our Telegram channel

Full access? Get Clinical Tree


