22 | Diagnostic Sonography of Blood Flow in Breast Tumors |
Biological Background
In recent years ultrasonographic examination of blood flow has been added to the armamentarium used in the differential diagnosis of breast tumors of uncertain malignancy.
As early as 1907 Goldman first showed that the growth of a tumor leads to vascular proliferation in the surrounding tissue, and that this phenomenon is a response of the host to the growth of the tumor. In 1945 Algire and Chalkley discovered that malignant cells can elicit vascular proliferation on a continuous basis and that tumor cells have the property of inducing the growth of capillary epithelium in vivo. Finally, in 1971, Folkman et al. were able to isolate the factor responsible for angiogenesis in tumors (Folkman et al. 1971, 1987). Currently some authors assert that vascular proliferation in the tissues surrounding a tumor is an essential prerequisite for tumor growth. Beyond that, neovascularization is considered to be a sign of malignancy in a tumor (Delorme 1993, Kaiser et al. 1993, Plate 1993, Possover et al. 1994, Samejima et. al. 1988, Schild and Fendel 1991, Sohn et al. 1992a, Weidner et al. 1991). The degree of vascularization in a mammary carcinoma correlates with its invasiveness and its metastasizing potential (Weidner et al. 1991). Arteriovenous shunts develop and the newly-formed vessels can at times show considerable variation in their caliber, resulting in rather heterogeneous blood flow patterns (Bouck 1994, Horak et al. 1992).
Since the structure of the newly-formed capillaries does not include a muscular layer, their vascular resistance is very low, resulting in an extremely low flow rate (Sohn et al. 1992a, 1993, 1994a, b). It is precisely these minimal flow rates that can be brought into focus with the aid of the new color techniques, contributing to preoperative diagnostic staging.
However, some benign conditions, such as proliferative mastopathies, inflammatory processes, or a lactating breast can lead to increased blood perfusion (Leucht and Madjar 1995, Madjar et al. 1997/98). Due to the rapid technical developments of the last 10 years, different working groups have at times arrived at quite contradictory results (Adler et al. 1990, Bell et al. 1993, Blohmer and Lau 1993, Blohmer et al. 1993a, 1993b, 1994, Britton and Couldon 1990, Burns et al. 1982, Cosgrove 1992, Delorme 1993, Dock 1993, Huber et al. 1993, Konishi 1992, Madjar and Schillinger 1986, Madjar et al. 1989, 1991b, Schild and Fendel 1991, Schild et al. 1993, Sohn et al. 1992b, 1993).
Instrumentation
Doppler ultrasound uses the frequency shift in sound waves emitted from a mobile element to make visible and measure the motion of erythrocytes in the blood vessels of a tissue. The degree of frequency shift is recorded and documented in Hertz, or it is used to calculate the flow rate of the erythrocytes in millimeters per second or centimeters per second.
The frequency shift depends on the frequency of the sound waves generated and the velocity of blood flow in the vessels. Because, as noted above, the circulation in a malignant lesion in the female breast is very slow, high Doppler frequencies are required to detect blood flow in a mammary carcinoma (Madjar et al. 1989).
Continuous Wave Doppler
In a continuous wave (CW) Doppler, sound waves are continuously emitted and simultaneously received from the transducer. Using a frequency usually of 10 MHz, a transducer with a surface diameter of about 1 cm (pencil probe) is moved systematically over the whole breast. Good skin contact must be maintained throughout the examination. The results of CW Doppler recording are reproduced as acoustic noise or a Doppler flow curve on the monitor (Fig 22.1). It is not feasible to display the tissue under examination in B-mode image. By the same token vessels cannot be displayed at a specific depth. Because of the high frequencies used with the pencil probe, the sensitivity of this procedure for the display of the breast is very high. Admittedly, because of the small surface area of the probe and the type of signal display, the procedure must be performed absolutely systematically and the examiner must have a great deal of experience in the detection of nonpalpable tumors in the female breast.
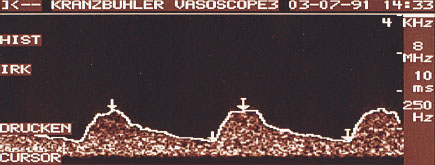
Fig. 22.1 CW Doppler. The results of the measurements are displayed as a Doppler flow curve.
Scientific research, in which the display by CW Doppler of the vessels in the breast affected by a tumor was compared with the contralateral side, found a definite increase in the number of vessels on the malignant side. Moreover, in most healthy women the course of the vessels and the blood flow in both breasts were symmetrical. The research also added information on the small circulatory changes in the female breast over the course of the menstrual cycle (Madjar et al. 1998, 1992).
Because of the lack of a visual display as a B-mode image, and because it is very time-consuming, CW Doppler is no longer used in routine diagnostic studies (Madjar et al. 1992, Schild and Fendel 1991, Schild et al. 1993).
Pulsed Wave Doppler
In pulsed wave (PW) Doppler, sound waves of one frequency are sent and received alternately at defined time intervals. Selected tissue depths can be calculated from the time interval between sending and receiving sound waves. Hence it becomes possible to display the vessels at specific depths. The findings can also be displayed simultaneously in B-mode.
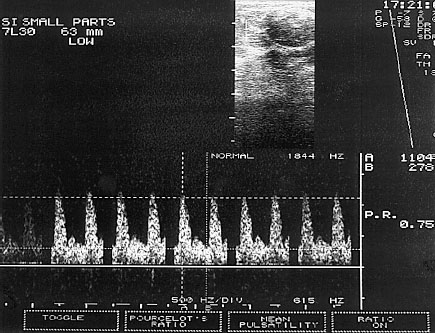
Fig. 22.2 PW Doppler. The sample volume is placed into the B-mode image in such a way that the Doppler spectrum of the blood vessels of interest is displayed.
The procedure first uses the B-mode image to look for a lesion in the breast. Next the Doppler window, called the “sample volume,” is placed over the region of interest (ROI). As a consequence the blood vessels at precisely this depth of penetration can be displayed with the recorded frequency shift and the corresponding Doppler spectrum can be measured (Sohn et al 1993; Fig. 22.2).
The following parameters are recorded and analyzed by PW Doppler:
 Maximal systolic velocity (V I<max sys): A
 Minimal end-diastolic velocity (Vmin dias): B
 A/B ratio: Q= A/B
 Resistance index (RI): RI = A–B/A
 Pulsatility index (PI): PI = A–B/Q
The Doppler spectrum should be recorded at an acute angle, preferably <60°, since otherwise errors could creep into the calculation of velocity. The RI and the PI are largely independent of the angle.
It is often difficult in the B-mode image to display the small vessels of a breast tumor formed by angiogenesis. Hence the detection of blood vessels involves a “blind” search of the sample volume, just as with CW Doppler.
Color-Coded PW Doppler
A large proportion of the diagnostic studies of blood flow in obstetrics and gynecology is currently performed by color-coded PW Doppler ultrasound. This procedure is especially applicable to sonography of the breast, because it is able to detect blood vessels of which the lumen is below the power of resolution of the B-mode image.
In the color-coded PW Doppler the received Doppler signals are color-coded, i.e., blood flow velocities are transformed on the monitor into various colors and degrees of brightness. In these procedures the direction of flow is meaningless. Depending on the manufacturer of the instrument, the procedure is based on an analysis of phase shift, runtime, or frequency shift.
In the course of the measuring procedure, a wall filter or high pass filter (HPF) filters out the oscillations of the vascular wall. However, slow flow components of the perfusing circulation are also filtered out. For this reason the wall filter in ultrasound examination of the breast must be high, so that precisely these slow components of flow velocities can be detected. The PW Doppler can record and measure a Doppler flow curve if the sample volume is placed in the vessel that is displayed in color.
Because of the very slow blood flows that need to be detected in mammary sonography, instrumental settings are very sensitive. Hence the development of artifacts is considerable, not only due to the patient’s respiration and heart beat, but also her spontaneous movements.
In the procedure the malignant lesion in the patient’s breast is first displayed in the B-mode image. Next the Doppler window of the color-coded Doppler ultrasound is placed over the B-mode image. The sample volume is set low. The detected blood vessels are now displayed in color (Fig. 22.3). Now the sample volume can be targeted at an acute angle to the vessel that is to be examined. The monitor displays a Doppler flow curve, which can be analyzed. Should measurements be unsuccessful at an angle <60°, it is possible to resort to angle correction. In this correction the actual angle is used in calculating the velocity.
The following technical aspects of instrumentation should be addressed when color-coded Doppler ultrasound is to be used:
 Color-coded pulsed wave Doppler technology,
 Doppler frequencies > 5 MHz,
 Synchronous display of B-mode image and Doppler flow curve,
 Variable size of the sample volume,
 Variable Doppler angle (it should be adaptable to the course of the vessel),
 Angle correction available,
 Low measuring range (< 1 cm/s),
 Limited expression of flash artifacts (movements in the surrounding tissue cause color artifacts),
 The capability of displaying the Doppler flow curve at a height at which quantitative measurements can be performed,
 Analysis of the usual Doppler parameters by the system’s software,
 Easily handled, lightweight probe.
Angio Color, Angio Mode, Power Doppler
The angio color technique is a procedure that, like conventional color Doppler ultrasound, displays blood flows as a color image superimposed on the B-mode image in real time. In contrast to the traditional color Doppler, angio mode analyzes the amplitude of the echo and consequently provides information concerning the number or density of the erythrocytes reflecting the ultrasonic beam.
As in the various procedures described above, the examination begins with a B-mode display of the suspected primary lesion in the female breast. Next, the color Doppler window is made to coincide with the changes previously outlined by ultrasound. Even very small blood vessels with low flows can be detected using this method (Fig. 22.4). The sample volume of the PW Doppler can now be placed over such a vessel, the Doppler flow curve can be recorded, and calculations derived from it.
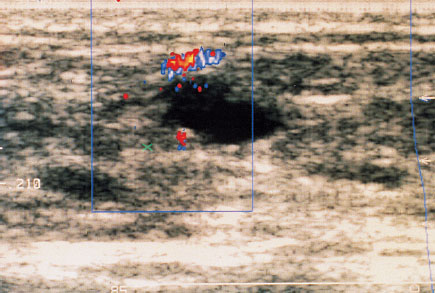
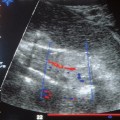
Fig. 22.3 In color-coded Doppler ultrasound the detected blood vessels are displayed in color.
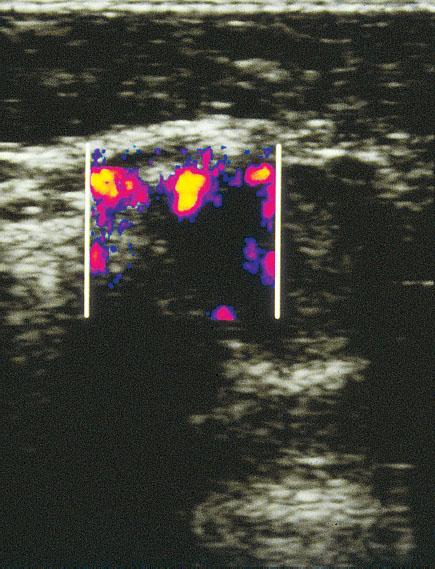
Fig. 22.4 Breast tumor in angio mode. Even very small blood vessels with low flows can be displayed by this procedure.
This system has distinct advantages. Because it uses amplitude, it is independent of the angle between blood flow and the incident ultrasonic beam. Moreover, the amplitude signals include less back-ground noise, since they are the result of the addition of frequency shifts, and not, as in a conventional Dop-pler, their mean. For this reason power Doppler can be used at higher amplification, enabling a more sensitive and continuous display of the vessels. Sensitivity is increased fortyfold. This procedure makes it possible to detect flow velocities of 0.4 mm/s (Sohn et al. 1996).
Because angio color is extremely sensitive to low blood flows in vessels formed by angiogenesis, artifacts formed by patient respiration, pulse, or movements are very frequent. Another drawback of the procedure is also due to its very high sensitivity: some of the blood vessels detected by power Doppler with extraordinarily low blood flows cannot be quantified by conventional PW Doppler. Quantification is not possible in angio mode alone. Work in progress is attempting to relate the number of color pixels in a ROI to the total sample volume, using computerized systems, but this model does not provide absolute figures.
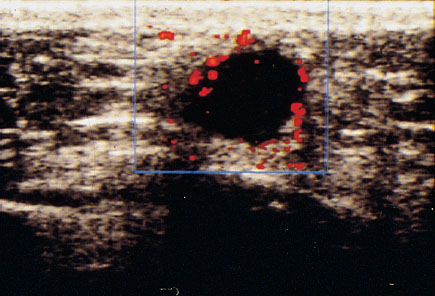
Fig. 22.5 Color Doppler sonographic display of a breast tumor without administration of contrast medium.
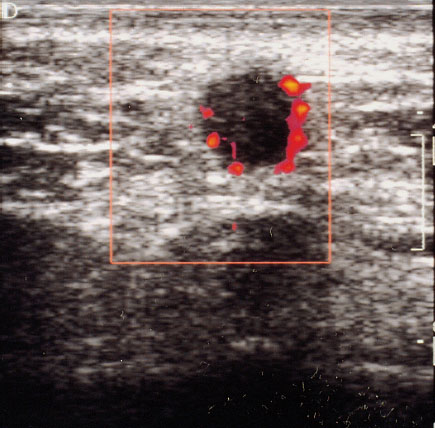
Fig. 22.6 Color Doppler sonographic display of a breast tumor with administration of contrast medium. Especially the small tumor vessels can be identified more easily.
Introduction of Ultrasound Contrast Media
In many cases the color signals and the quality of the Doppler flow curves obtained by the usual instrumentation are not adequate for reaching a satisfactory conclusion for the staging of a breast tumor. The introduction of ultrasound contrast media to amplify the echo signal can improve the evaluation of the degree of vascularization.
For this procedure 2.5 g of granular galactose are shaken with 7.5 mL H2O shortly before the examination to form a fluid with a concentration of 300 mg/mL. The microbubbles formed at the surface of the granules by the agitation are stabilized by adding 1 mg of palmitic acid, which keeps them in the hepatic and pulmonary circulations. About 20–25 seconds after the bolus of contrast medium is injected intravenously into the peripheral circulation, the intensity of the Doppler signal increases by 10–20 dB (Schlief 1991). The microbubbles increase the echogenicity of the blood by forming a boundary with increased acoustic impedance on their surface.
Side effects due to the contrast medium are rare. They include transient sensations of pain, heat, or cold at the injection site (Schlief 1993, Madjar 1997/8). Hereditary galactosemia is an absolute contraindication to the use of ultrasound contrast medium. Studies published in the literature to date report a subjective impression of improved display, primarily of small tumor vessels (Figs. 22.5, 22.6) (Cosgrove 1992, Duda et al. 1993, Madjar et al. 1993).
Considered from a fundamental point of view the use of sonographic contrast media, by displaying the dynamics of the circulation in a tumor, can serve as a diagnostic aid for staging. In this way it resembles magnetic resonance imaging (MRI), and such studies are being undertaken. However, a drawback to be considered is that administering a contrast medium represents an additional diagnostic step for both patient and examiner, and that this can be quite time-consuming. Finally, more evidence is required to confirm that this procedure truly provides additional information that broadens the diagnostic base for staging and so justifies the additional effort in clinical practice.
Color-Coded Doppler Ultrasound in the Differential Diagnosis of Breast Tumors
The first studies addressing the differential diagnosis of breast tumors by color-coded Doppler ultrasound described a purely qualitative display of blood vessels around the primary lesion. When blood vessels were then demonstrated in a sonographically equivocal tumor, the tumor was likely to be malignant, while it was considered to be benign in the absence of such vessels (Britton and Coulden 1990).
In contrast to this finding, Adler et al. (1990) could not demonstrate any blood vessels in 18 % of patients with breast cancer, while they detected bloods vessels in 97 % of all patients they examined who had no suspicious lesions. These results indicate that a purely qualitative description of blood flow is not sufficient for differential diagnosis.
Based on this finding, increased attention was devoted to quantitative analysis of Doppler flow curves derived from tumor vessels (Dock 1993, Konishi 1992). A further attempt to differentiate benign from malignant findings in the female mammary gland was based on the detection of a difference in the RIs of the breasts on the healthy and affected sides (Sohn et al. 1992b, 1993). Current opinions differ considerably regarding the conclusions that can be drawn from measurements of perfusion (Jellins 1988, Madjar et al. 1989, 1991a, 1991b, Sohn et al. 1992b, 1993).
The following markers can be examined and assessed:
 Number of vessels in the tumor and its immediate surroundings,
 Calculated Doppler parameters (quotient, RI, PI),
 Shape and characteristics of the Doppler flow curve,
 Comparison of perfusion in the healthy and affected breasts in the same patient,
 Size and number of individual color pixels or color surfaces in a tumor.
The differential diagnosis of breast tumors using the number of blood vessels detected seems problematic. As noted above, CW Doppler requires a systematic and time-consuming examination of the whole breast, and the results depend very much on the examiner’s experience. With color-coded ultrasound the vessels are detected by using the number of color pixels and surfaces displayed. Often the course of a tumor vessel cannot be determined with confidence, because only single pixels or small color surfaces are displayed. Therefore, if the loops of a single vessel appear several times in one ultrasonic cut, the possibility that it will be counted several times in the total number of vessels cannot be excluded with confidence.
The most reproducible constants are the conventional Doppler parameters. Hence in recent years quantitative analysis of blood flow in tumor vessels has increasingly been using calculated Doppler parameters (Blohmer and Guski 1995, Dock 1993, Konishi 1992, Madjar et al. 1991a, Sohn et al. 1992a, 1993). However, the velocities calculated from the Doppler flow curve depend on the angle of the incident sound waves (Sohn et al. 1993). In routine clinical practice it is difficult, especially for very small tumor vessels, to assure an optimal angle. The profile of the Doppler curve can of course be defined objectively to some extent by the RI and the PI, both almost independent of the angle. Therefore, the RI is most often used in daily clinical practice. The vascular resistance is then expressed as a number between 0 and 1 or as a percentage. The lowest measured RI values of a tumor and its immediate surrounding tissue are always used for evaluation.
The differences between the vascular supply of benign and malignant tumors are found in the capillary bed. As noted before, tumor vessels formed by angiogenesis have no muscular layer. Moreover, the total vascular diameter increases as the number of new capillaries increases, reducing the resistance.
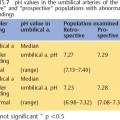
Various working groups have suggested a cutoff level in the RI of <0.7 or 70% to distinguish between benign and malignant tumors. By this measure Doppler ultrasound of the breast has a sensitivity of 84% and specificity is 80%. The positive predictive value is given as 71 % and the negative predictive value as 90% (Peters-Engl et. al. 1995).
However, determining an absolute value for a cutoff level for blood flow does not appear promising, given just the physiological changes in the glandular tissue of the breast and the very varied histological changes in breast tumors that may show varying degrees of differentiation and often very different patterns of vasculari-zation. Moreover, blood flow depends on the size of the lesion. In the evaluation of conventional Doppler findings, a drawback we have previously described several times is that, because of their slow flow rates, it is difficult or impossible to detect the small vessels formed by neovascularization (Sohn and Meyberg 1995).
The characteristics and shape of the Doppler curve provide important criteria for the evaluation of tumor perfusion. Mostly, when the changes in the breast are benign, systole is relatively high, and by comparison diastole is low. Systole can clearly be distinguished from diastole. Whether the resistance is high or low can be concluded from the shape of the curve. An early diastolic notch in the Doppler flow curve suggests high vascular resistance. This characteristic blood flow curve defines vessels with a flexible muscular layer, such as run through normal glandular tissue and benign lesions (Fig. 22.7).
In the case of malignant breast tumors the height of systole is relatively low and that of diastole by comparison relatively high. Often it is impossible to distinguish between systole and diastole. The curve declines from systole continuously to the end of diastole. The low resistance generated by the formation of vessels without a muscular layer in malignant changes of the breast can often be demonstrated by the absence of a notch (Fig. 22.8).
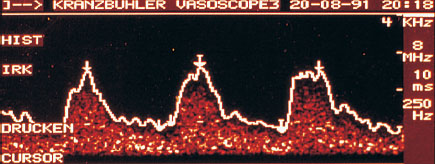
Fig. 22.7 Characteristic Doppler flow curve of a benign breast lesion.
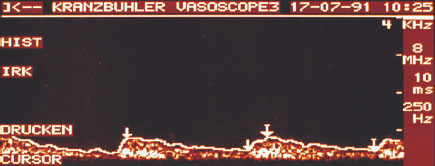
Fig. 22.8 Characteristic Doppler flow curve of a malignant breast lesion.
However, the fact that very small capillaries without a muscular layer also occur in normal organs and benign tissue changes must be taken into account. Therefore, in the eyes of an experienced examiner, low resistance is only suggestive. The relative height of systole and diastole can also be unremarkable, and an early diastolic notch only poorly developed. Moreover, the evaluation of the shape of the Doppler flow curve depends solely on the subjective impression of the examiner. The curve cannot be reproduced objectively and its assessment depends greatly on the examiner’s experience. The results of one study suggest that a comparison of the blood flow in the affected and the normal breast of the same patient can be used for the differential diagnosis between benign and malignant lesions (Blohmer et al. 1984). In this study the Doppler flow parameters in the lesion were compared to those in an artery in the corresponding quadrant of the contralateral breast. There was a distinct difference between the maximal systolic, end-diastolic, and mean velocities in the vessels of the malignant and the comparison breast. In the case of the malignant tumor the velocities in the vessels are typically higher. Attempts to explain these findings suggest that afferent vessels are usually located in the biologically active periphery of the tumor. The vessels in the tumor itself grow into irregular shapes and arrangements. The arteries are twisted into corkscrews and their caliber manifests considerable variations. Flow inside such arteries is turbulent with high flow rates (Kurjack et al. 1992). In addition, arteriovenous shunts form, in which flow rates are high (Bouck 1994).
No significant differences in the Doppler flow parameters RI and PI have been determined between tumor vessels and the corresponding vessels in the contralateral breast (Konishi 1992, Madjar et al. 1992). By using new, very sensitive color techniques it may be possible in the future to display more clearly the flow in the terminal vascular bed that characterizes the tumor more precisely. To date it has only been possible to use these newer techniques, such as angio mode, for the analysis of single color pixels or color surfaces. These are evaluated subjectively according to their intensity, size, and number. Currently computer programs are being developed to quantify blood flow displayed by color Doppler. Here the colored area is compared to the whole B-mode image. Additionally, the intensity of the color surfaces will be taken into account.
In conclusion, we should say that sonographic tumor staging develops from the sum of a number of separate pieces of information. When a lesion shows signs of malignancy on the B-mode image or cannot be clearly shown to be benign, and if in a color Doppler examination blood flow can be demonstrated, safety demands that the lesion must be identified histologically.
Advanced Topics in Obstetrics and Gynecological Doppler Ultrasound: References
Doppler Ultrasound and the Cardiotocogram
Jouppila P., Kirkinen P. Blood velocity waveforms of the fetal aorta in normal and hypertensive pregnancies. Obstet. Gynecol. 67 (1986) 856–860.
Krebs MB, Petres, RE. Clinical application of a scoring system for antepartum fetal heart rate monitoring. Am. J. Obstet. Gynecol. 130 (1978) 765–772.
Related posts:
 Diagnosis of the Uterine Tube by Transvaginal Sonography
 Doppler Sonography in Obstetrics—Screening At-Risk Populations
 Doppler Ultrasound and the Cardiotocogram
 Doppler Ultrasound in the Diagnosis of Fetal Anomalies
 Vascular Supply of the Uteroplacentofetal Unit and Techniques for the Examination of Individual Vessels
Stay updated, free articles. Join our Telegram channel

Full access? Get Clinical Tree


