(1)
The parameters in Eq. (1) define the dimensions and regulate the shape of the superquadrics fit. For each valve, there are two surface meshes denoting the Atrial and Ventricular sides of the MV leaflets. The Levenberg–Marquardt non-linear programming algorithm [20] was employed to determine the superquadratic fits. The objective function used for optimization is denoted by Eq. (2).


(2)
Fine-scale features are defined as normal residual field of the difference between the actual point cloud data and fitted surface. The residual scalar field is analyzed by discrete Fourier transform with low-pass filtering. Conformal Fourier Transform (CFT) method [21] using Non-Uniform Fourier Transform (NUFFT) technique [22] is used to accommodate irregular boundaries and non-uniform data structure. To reduce artifacts of spectral distortion due to the irregular sampling, iterative NUFFT approach is utilized [23]. The final leaflet surfaces are reconstructed by inverse Fourier transform of the filtered spectrum onto a resampled regularized mesh on the superquadric surface. In addition to volumetric representation of the leaflet tissue, this approach also allows to reconstruct the leaflet midsurface with superimposed thickness scalar field.
2.4 Modeling of Chordae Tendineae
The geometry of chordae tendineae is modeled using the medial axis approach. Skeletonization of the chordal structure provides a natural way to reconstruct the chordae tendineae geometry, and facilitates the characterization of their tubular topology. We model chordal structure by employing the concept of spatio-structural graphs used by Alhashim et al. [24]. The general topology of chordae tendineae is described by performing statistical analysis of the spatial distribution of origin and insertion points, development of distribution functions of lengthwise cross-sectional variations, and density of branching, and lengths of branches. By combining the statistical representation of the chordae structure with structural graph, we can perform averaging and consistent reconstruction of not only chordae structure, but also leaflet-chordae attachments. The latter is achieved by applying the Boolean operation on the reconstructed leaflet and chordae geometries with calibrated flaring parameter to avoid sharp corners in the transition zone. The distribution of origin points on the PM is analyzed in the context of PM classification introduced by [25]. This allows us to distinguish statistical variations in position vs. anatomical differences in the structure of PMs. Note that in contrast to the leaflet geometric model, the chordae are analyzed using the stochastic representation (vs. deterministic descriptors) due to the irregular topology of these MV components.
3 Results
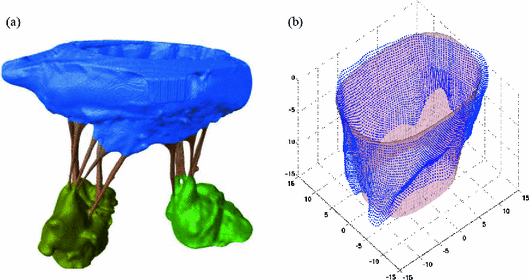
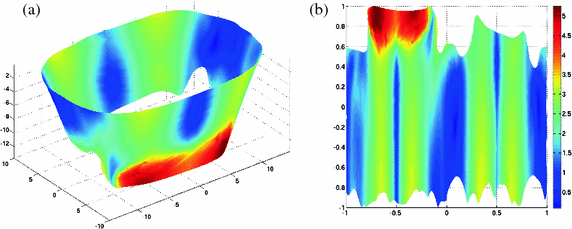
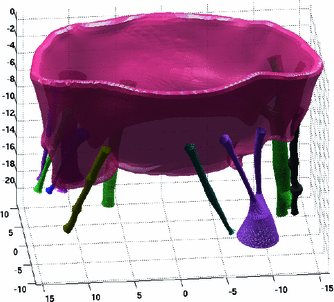
In this section, the proposed modeling framework is used to analyze one of the considered ovine MV datasets. The 3D rendered representation of the segmented µCT images is depicted in Fig. 1a. Prior to segmentation, the image quality was enhanced with curvature flow smoothing filter. The major constituent parts of the MV apparatus (leaflets, chordae, PMs) are labeled with different colors. The markers placed on MV sample prior the imaging were used to capture the MV annulus shape in the reconstructed 3D image. The average of two fitted superquadric surfaces (leaflet midsurface) is illustrated in Fig. 1b, and corresponds to the large-scale model of the studied MV leaflets. The superimposed colormap (Fig. 2a) represents the absolute values of normal residuals prior to spectral filtering. Figure 2b indicates the projection of the filtered residual field (after Fourier analysis) onto the superquadric surface unfolded along the axis of revolution. The reconstructed MV geometry (prior to Boolean union operation) of both leaflets and chordae are illustrated in Fig. 3.


Fig. 1.
(a) Labeled 3D representation of the segmented MV geometry. (b) Midsurface representation of the lealfets is shown as blue points on the superquadrics fit.

Fig. 2.
(a) The residual field representing normal distance of midsurface from superquadrics fit. (b) Residual map unfolded onto the superquadrics natural parameterization space.

Fig. 3.
The entire MV apparatus reconstructed by augmenting superquadrics surface with fine-scale features. Chordae tendineae are modeled using the medial axis approach.
4 Discussions
Geometric models play a critical role in any computational simulation. In the context of cardiovascular biomechanics, the accuracy of geometric models directly affects the ability of the simulation to provide realistic predictions of MV behavior. In this paper, we propose a multi-scale approach for characterization of the MV geometry and decomposing the geometrical features is a systematic approach. The proposed framework allows to not only quantify and accurately capture the intra-patient variations in geometry, but also to develop a representative population-averaged model of MV in a consistent manner. The methodology is independent of imaging modality and requires a limited set of parameters to quantify the geometry of full MV apparatus. In addition to deterministic population-averaged geometric model, this method allows to generate several realizations of the average model by modifying distributions of the stochastic parameters: spectral phases of leaflets and spatial characteristics of chordae. The reconstructed geometry can be easily imported in the mesh generation software packages to build Finite Element (FE) computational meshes with adjustable level of mesh discretization. Even though ex vivo and in vitro models provide high resolution and allow to incorporate fine details of the MVs, these models are not adequately precise for treatment planning simulations [26]. We are currently testing this methodology on human heart data to develop a human population-averaged model. Our goal is to extend the proposed framework to allow multi-modal modeling, which uses high-resolution ex vivo data to augment in vivo imaging and enable high-fidelity computational models of patient-specific MVs in clinical applications.
Stay updated, free articles. Join our Telegram channel

Full access? Get Clinical Tree


