Introduction
Ultrasound and magnetic resonance imaging (MRI) are the preferred modalities when evaluating patients with suspected gynecologic pathology. Computed tomography (CT), however, continues to have an important role in imaging female patients and is commonly done when evaluating patients with abdominal and pelvic pain. CT also provides important information in patients with gynecologic malignancies, for both initial staging and further management of the disease. This chapter describes the CT anatomy of the normal female pelvis, which is necessary to ensure accurate evaluation of pelvic abnormalities.
Description of Technical Requirements
During the past 10 years, CT technology has developed significantly with the introduction of multidetector CT (MDCT) scanners. Compared with single-slice scanners, MDCT scanners have multiple detectors in the scanning direction, allowing for acquisition of more than one image per x-ray tube rotation. The major improvements of MDCT technology include the ability to reconstruct an image at various thicknesses different from the thickness set during image acquisition, decrease in scanning time, and wider scan coverage. MDCT can acquire isotropic scan data that allow reformatting images in any plane with spatial resolution identical to the original scanning plane.
Normal Anatomy
Uterus
Size, shape, and position of the uterus depend on age, hormonal status, pregnancy, and the degree of the bladder distention. In women of reproductive age, the uterus is 6 to 9 cm long ( Figure 3-1 ). After menopause the size of the uterus significantly decreases ( Figure 3-2 ). When the uterus is anteverted ( Figure 3-3 ), it is visualized posterior and superior to the bladder, whereas the retroverted uterus projects into the cul-de-sac. The uterus is divided into the body and cervix. The cervix is typically located in the midline with the uterine body often deviating to one side of the pelvis. Although it is often difficult to clearly distinguish the uterus from the cervix, the two can be separated from one another by their configurations because the uterus is somewhat triangular in shape, whereas the cervix has a more rounded appearance. The cervix enhances to a lesser degree compared with the uterus and often appears hypodense (see Figure 3-1 ).


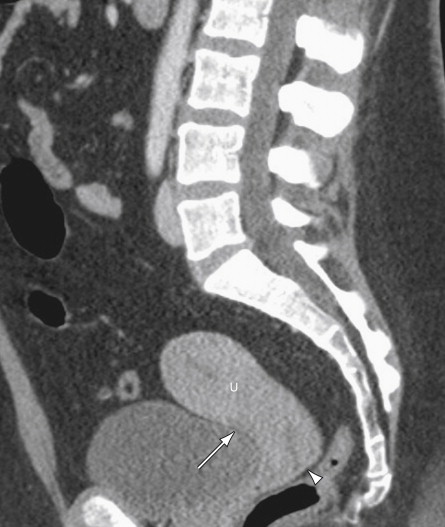
The uterus is covered by peritoneum that anteriorly becomes separate from it at the level of the cervix, forming the vesicouterine pouch that lies between the uterus and bladder (see Figure 3-3 ). Posteriorly the peritoneum covers the surface of the uterus to the level of the dorsal vaginal fornix and then ascends along the anterior surface of the rectum, creating the rectouterine pouch (pouch of Douglas or cul-de-sac) (see Figure 3-3 ).
The endometrium is often seen as a central hypodensity, most commonly ovoid or triangular in shape, better delineated on contrast-enhanced images. The lower attenuation of the endometrium relative to the myometrium is normal for premenopausal patients and should not be mistaken for fluid ( Figure 3-4 ). This appearance is likely related to a less rich vascular supply of the endometrium relative to the myometrium. Although there are no currently established CT criteria to assess the endometrium, it has been shown that CT is relatively insensitive for detecting mild endometrial thickening but is better at detecting gross thickening. Additionally, review of CT often leads to a false-positive conclusion for true endometrial thickening; therefore transvaginal sonography should always be used to confirm the CT findings. Occasionally, because of anteversion or retroversion, the uterus is imaged along its true coronal plane on axial CT images. In these cases, the normal endometrium has a triangular shape on axial CT images ( Figure 3-5 , A ) and can be misinterpreted as thickened. When such a finding is seen, sagittal reconstruction images should be interpreted in addition to the axial images because they can typically confirm the absence of true endometrial thickening (see Figure 3-5 , B ).


On postcontrast images the uterus can have different enhancement patterns that depend on individual variables, most importantly the patient’s age and menopausal status. Enhancement patterns are transitory and most commonly occur on images obtained 30 to 120 seconds after contrast administration, with the uterus becoming homogeneous on more delayed imaging. Zonal patterns of enhancement that have been described include subendometrial ( Figure 3-6 ), peripheral myometrial ( Figure 3-7 ), and faint diffuse myometrial enhancement (see Figure 3-2 ). Knowledge of these normal findings is helpful when unusual uterine enhancement is seen during routine studies.


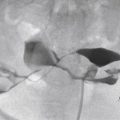
The main blood supply to the uterus is through the uterine artery , a branch of the internal iliac artery. The uterine artery reaches the uterus through the cardinal ligament and then divides into an ascending and a descending branch ( Figure 3-8 ). The uterine artery gives off multiple branches to the uterus as it courses between the layers of broad ligament, before anastomosing with the uterine branch of the ovarian artery. The uterine artery also gives off branches to the cervix, vagina, fallopian tubes, and ovary.

Congenital uterine anomalies, also known as müllerian duct anomalies, result from nondevelopment or partial or complete nonfusion of müllerian ducts resulting in various abnormalities involving the uterus, cervix, and vagina. The prevalence of these congenital anomalies is estimated to be up to 1%. MRI and three-dimensional (3D) ultrasound are currently imaging modalities of choice because of their high sensitivity in detection and high specificity in characterization of müllerian duct anomalies. Occasionally the diagnosis can be made on CT images, usually seen as incidental finding ( Figure 3-9 ). CT can detect the abnormal external contour of the uterus, which is present in the bicornuate ( Figure 3-10 ) or didelphys uterus.


Cervix
Understanding the normal CT appearance of the cervix and parametria is essential when assessing cervical pathology. Although no strict criteria for the size of cervix have been established, the cervix is generally 2 cm long and less than 3 cm in diameter. The size of the cervix, however, is variable, depending on many factors, including hormonal status and pregnancy. Younger patients can have a normal cervix that is larger than 4 cm in diameter ( Figure 3-11 ). Similar to the uterus, the enhancement pattern of cervix can be zonal, although the cervix typically enhances more slowly compared with the uterus, and this finding should not be misinterpreted as abnormal (see Figure 3-1 ). The cervix consists of two parts, the supravaginal and pars vaginalis, a lower portion that protrudes into vaginal canal. When a tampon is present high in the vagina, it can be displaced to one side within the pars vaginalis, and this normal appearance should not be mistaken for a cervical or vaginal mass ( Figure 3-12 ). Small amounts of gas can occasionally be seen in the endocervical canal, likely secondary to voiding. Inclusion cysts of the cervix (nabothian cysts) can also be seen in the cervix, particularly if they are larger than 1 cm.


The lateral margins of the cervix are outlined by the parametria. The parametria ( Figure 3-13 ) are diamond-shaped regions just lateral to the cervix. The parametria are composed of connective tissue that contains fatty elements and are located between the leaves of the broad ligament. Medially the parametria are contiguous with the uterus, cervix, and proximal vagina, and inferiorly with the cardinal ligament. Laterally they extend to the pelvic sidewalls. The parametria normally contain thin strands of soft tissue that likely represent small blood vessels, lymphatics, and fibrous tissue. These should be differentiated from stranding caused by malignant extension, which are typically thicker than 3 to 4 mm in diameter.

Ovaries
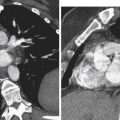
The ovaries are ovoid parenchymal structures that most commonly contain soft tissue stroma with small cystic areas that represent normal follicles. Their appearance varies with age and hormonal status. In women of childbearing age, the average ovarian volume is 9.8 cm 3 ; in postmenopausal women, 5.8 cm 3 ; and in the premenarchal group, 3.0 cm 3 . In menstruating women, the normal ovary can be identified on CT in most instances ( Figure 3-14 ). Postmenopausal ovaries may be difficult to detect on CT because of their small size and lack of cysts ( Figure 3-15 ). Ovaries are intraperitoneal structures and are always located within the peritoneum. In nulliparous women, they are typically located within the ovarian fossa, a shallow peritoneal depression, which is bounded anterolaterally by the external iliac arteries and posteriorly by the pelvic ureter (see Figure 3-14 ). The position of the ovaries is variable due to laxity of the ovarian and suspensory ligaments, which anchor the ovary. Normal ovaries may be seen in the cul-de-sac, pelvic inlet, iliac fossa, and lower abdomen ( Figure 3-16 ). During the first pregnancy, the ovaries are displaced superiorly in the abdomen because of the enlarging uterus. After the delivery, the ovaries often do not return to their original position.


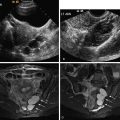
Although the ovaries often contain small cysts, larger benign ovarian cysts are also commonly seen in premenopausal women, which in most instances represent physiologic changes. In premenopausal women a common finding is a corpus luteal cyst. These cysts are normal physiologic ovarian structures that form in the dominant follicle after ovulation. Corpus luteal cysts are typically smaller than 3 cm and have a thick, crenulated, and hyperenhancing wall (see Figures 3-1 and 3-17 ). It is important to be familiar with a normal CT appearance of the corpus luteal cysts to prevent inaccurate diagnosis and unnecessary further workup. If a cyst appears complex on CT, further characterization by ultrasound should be performed to better assess internal complexity and to exclude a cystic ovarian neoplasm.