Fig. 4.1
Examples of images of histological stained tissues. (a) HE, (b) Masson’s trichrome (special stain), and (c) IHC
4.2 Digital Imaging Technology in Diagnostic Pathology
4.2.1 Evolution of WSI Technology
The introduction of digital imaging technology started with telepathology (Weinstein et al. 2009). A remote pathologists support clinicians through network by observing the digital image in telepathology. A pathologist can also be supported by another pathologist at remote site with different specialty, and double-check can be performed in efficient manner by employing telepathology system. There have been different types of telepathology systems used—store-forward, video, robotic, and WSI. The development of telepathology system has greatly contributed to the advancement of pathology imaging technology.
The research and development of WSI have been made since late 1990s, but practical deployment was difficult because it needs to deal with huge amount of data. The pixel pitch should be smaller than 1 μm or even 0.3 μm, and the size of a specimen is typically 20~30 mm, that is, the image size becomes 20,000×20,000 ~ 100,000×100,000 pixels. Then the corresponding data amount is 1.2 GB~30 GB per image in uncompressed case. The scanning time, data transfer, and interactive display as well as image quality were difficult problems for practical use. Nevertheless, now the technologies for WSI scanner and viewer have been greatly evolved, such as the systems of optics, mechanical controlling, digital image interface, and fast computing. Advanced scanner system now enables the scan of a single slide in 1 minute and comfortable interactive display. Figure 4.2 shows the schematic drawing of WSI technology. In this example shown in Fig. 4.2b, the area in 25.2 mm × 22.7 mm was scanned with 0.23 μm pixel pitch, and an image in 110,592×99,840 pixels was obtained.
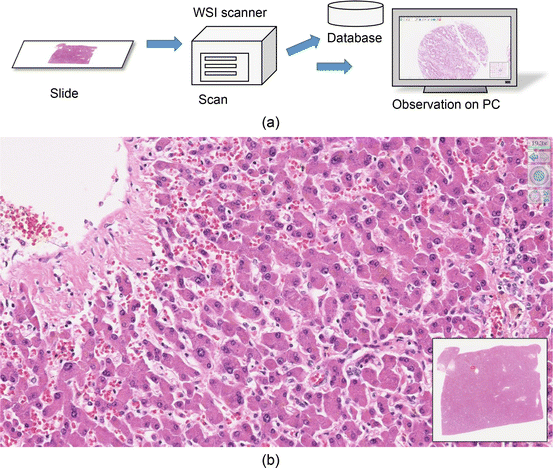

Fig. 4.2
(a) The concept of WSI system. Tissue specimen on a glass slide is digitized by a WSI scanner, and the image is reproduced on a monitor. (b) An example of observation. The whole specimen is shown in the window at bottom right, and the image scanned with using a 40x objective lens is displayed on the entire screen
Still it is expected to address some issues related to image quality and focusing. Since a tissue sample on a glass slide is not completely flat, it is necessary to adjust the focus of the objective lens depending on the location on the specimen, but the autofocusing occasionally fails. In addition, when the tissue section is relatively thick, or in the case of cytology samples, the focus position needs to be changed during observation. The images of different focus positions can be acquired by state-of-the-art scanners, called “z-stack.” However, much larger amount of data and longer acquisition time are required, and z-stack is currently used in limited cases. As an effort related to the image quality control, some techniques (Hashimoto et al. 2012) are developed for automatic detection of the area suffered by image blur due to focusing error as well as strong noise generated during the scanning process. The detected areas are re-scanned so that good quality WSI can be obtained.
So far, WSI has been used in practice mainly in telepathology, education, conference, and research applications. Moreover, it is being also adopted to primary diagnosis and clinical use (Pantanowitz et al. 2011; Gilbertson et al. 2006). WSI technology will significantly contribute to the introduction of information technology in pathology division, the connection and integration with PACS or EMR, and the deployment of pathology CAD based on digital image analysis.
The lineup of WSI apparatus includes a small-scale research-purpose device and a large-scale system suitable for hospital clinical use that automatically process a large number of slides. This practical WSI technology promotes the revolution of pathology field, referred to as “digital pathology.” The Food and Drug Administration (FDA) of the USA established a WSI working group, and the issues toward clinical use are discussed in the working group (Center for Devices and Radiological Health 2016).
In pathology department, traditionally the diagnostic workflow is based on the exchange of tissue block or biopsy samples taken from lesion, or specimens on glass slides. If all pathological specimens are digitized and managed as digital data, the need of handling “things” like tissue samples is minimum, and overall workflow of pathology department can be integrated into a computerized management system. It will promote more efficient diagnosis process; thereby the diagnosis results will be informed sooner to the patient, and the patient treatment will start earlier. Besides, the management of “things” will also be improved, e.g., reducing the risk of mixing-up samples and shortening turnaround time. The discipline on this subject is recognized as pathology informatics, and digital pathology is a key technology in this field.
4.2.2 Application of Image Analysis Technology
Since the diagnosis in pathology is carried out by visual observation of the tissue morphology, cell arrangement, and color, it is sometimes pointed out that there is a problem in the observer variability and reproducibility. In some cases, the morphological feature is represented by several levels of numbers, but it is based on visual determination and said to be qualitative or semiquantitative diagnosis rather than quantitative. Although counting the number of IHC stained cells is done as well, the manual counting is inaccurate and troublesome.
The progress of digital image analysis, pattern recognition, and machine learning is remarkable, such as face recognition. By measuring the image features by applying such a digital image analysis technology, it becomes possible to quantify the morphological features of tissue specimen. Then it will enable more detailed lesion classification, accuracy improvement in the determination of the degree of malignancy, and better diagnostic report which is more useful for clinicians. Under this background, active research is being carried out on the application of image analysis technology to the pathology diagnosis.
Tissue architecture and cell morphology have been studied long regarding the relation between the morphological features and the type of disease or the degree of malignancy. It is known as pathological morphology or morphometry, and computerized analysis has been also applied (Meijer et al. 1997). For example, the shape features of cell nuclei are measured, such as the diameter, area, and circularity, or the nuclear-cytoplasmic ratio (N/C ratio). Those morphological features are compared with other pathological indices, clinical course, or prognostic indications. However, even though using a computer, the measurement is based on manual process using general-purpose image processing software, and the results are rather affected by the operator judgment. Then it is still considered as “semiquantitative.” Moreover, as it requires labor and time, full application to routine practice is difficult, and the use has been limited mainly for research purpose.
Recently, the development of molecular-targeted therapy is remarkable in cancer treatment. The effectiveness of such therapy is completely different depending on the target molecule expression, and the determination of applicability is extremely important. The image analysis technology of IHC-stained tissue is getting attention as a tool for the objective assessment of applicability and the improved accuracy and efficiency (Gurcan et al. 2009; Irshad et al. 2014). The molecular expression is also important in subtype classification and evaluation of tumor grade. It is evaluated by IHC-stained samples and more recently fluorescent staining. Some examples of image analysis for molecular expression are introduced in the Sect. 4.3.2.
On the other hand, HE staining which is a routine staining technique has long history, and pathologists acquire considerable information from the observation of HE-stained samples. Thus it is promising to apply computerized image analysis to HE-stained samples. Although there have been many reports on the image analysis of HE-stained tissue specimen, most of them need manual process as mentioned above (Meijer et al. 1997). The region of interest is determined manually; the tissue elements such as nuclei are extracted with adjusting threshold, or the contour is traced by hand; then morphological features are measured; and statistical analysis is applied. As it needs laborious process, it is difficult to be employed in routine diagnosis. But the emergence of WSI is changing the situation. A completely automated system is developed for the analysis of HE-stained specimens, in which the WSI data is processed without human interaction, and the malignant regions are automatically detected (Gurcan et al. 2009; Wienert et al. 2012; Kiyuna et al. 2008). The system has been put into practice in laboratory test company for quality control and quality assurance by double-check. It is a CAD in pathology field and is expected to be applied to the system that will provide more useful information for pathologists and clinical practice.
4.3 Examples of Computer-Aided Analysis
4.3.1 Analysis of HE-Stained Image
Cancer cells have features such as nuclear enlargement, chromatin increase, cell atypia, and cell disarrangement. Since cell nuclei are stained with hematoxylin and observed clearly in HE-stained tissue, most of the techniques first extract cell nuclei, and the morphological features are calculated using extracted nuclei (Gurcan et al. 2009; Atupelage et al. 2014; Cataldo et al. 2012). Figure 4.3a shows an example color image of HE-stained tissue of the liver, where the nuclei and cytoplasm are stained in blue and pink, respectively. The spectral absorption coefficients of hematoxylin and eosin are shown in Fig. 4.4. The hematoxylin absorbs light in 550~650 nm wavelength range, and the eosin has strong absorption peak around 530 nm. Therefore, in a color image consisting of red, green, and blue (R, G, and B) components, the R channel image holds the information of hematoxylin absorption, and the contrast of nuclei is high. Thus an approach to extract nuclei is thresholding R channel image as shown in Fig. 4.3b, but binarization is not enough for nucleus identification, since there is density variation inside a nucleus because of the chromatin distribution and nucleolus. For identifying each nucleus, image processing technique based on mathematical morphology is often applied, such as opening and closing, or distance transformation, and local maximum can be considered as the candidate of the nucleus location. When the nuclear density is high and adjacent cells are attached, they are separated by some image processing technique such as mathematical morphology. Besides, since the nuclei are often circular, it is advantageous to combine pattern matching technique such as normalized cross correlation using disk-shaped template.


Fig. 4.3
Nuclei detection from a color image of HE-stained liver tissue. (a) Original color image; (b) after thresholding R channel component; (c) detected nuclei are marked with circles

Fig. 4.4
Spectral absorbance of hematoxylin and eosin
In HE staining, lymphocytes are also stained in blue in addition to the nuclei of parenchymal and stromal cells and need to be removed from the extracted nuclei. Using the features of lymphocytes, e.g., darker than other nuclei, smaller, and circular, lymphocytes are identified and removed from the nucleus list detected in the previous step. Figure 4.3c is an example of nuclear detection. After the extraction of nuclei, the contour of nucleus is derived, and morphological features of cell nuclei are calculated using the contour shape and other parameters of the nucleus.
As the feature that represents nuclear shape, following indices are often used: area, perimeter, circularity, and long/short axis (after ellipse fitting). The N/C ratio mentioned before is also used commonly in morphometry. Moreover, as the chromatin texture is related to cell proliferation, the texture features inside a nucleus are often evaluated, e.g., mean and standard deviation of pixel values inside nucleus region, textural features derived from gray-level co-occurrence function, Gabor features, wavelet, and fractal/multifractal and contour complexity (Atupelage et al. 2014; Doyle et al. 2012; Yamashita et al. 2014). These indices are calculated for each nucleus, and the feature index for each tissue is obtained as statistics such as mean, standard deviation, median, or percentiles. Then various studies using those morphological indices have been reported. For example, the discriminability of benign and malignant tissue from a certain set of features is evaluated, or the feature set that has correlation with prognostic outcome indicators is investigated.
Using the locations of extracted nuclei and connecting neighboring nuclei, graph-based analysis is also applied (Sharma et al. 2015). Region partitioning is also utilized, and the tissue structure is characterized using the areas or perimeters of the partitioned regions. In intestinal organs, breast, or prostate, the gland structure is important, and nuclear arrangement is also useful to analyze the gland structure.
For the automatic detection or grading of cancer, multivariate analysis or machine learning techniques are employed. Discriminant analysis, neural network, support vector machine (SVM), random forest, and deep learning techniques are common examples that can be exploited to detection or classification (Gurcan et al. 2009; Saito et al. 2013; Kothari et al. 2013; Kayser et al. 2009).
In histopathology diagnosis of breast cancer, nuclear grade is usually used for characterizing the tumor. The nuclear grade is determined based on nuclear atypia and mitotic activity. For the assessment of nuclear atypia, nuclei are firstly detected, and the features related to the size and shape of each nucleus are measured (Petushi et al. 2006; Veta et al. 2014; Dong et al. 2014). Then mean or median of those features represents the regularity of nuclei in the tissue, and their standard deviation shows the uniformity of the same features. In addition, the detection of mitotic nuclei is important. From the texture inside the nuclei, the mitotic cells are discriminated. The count of mitosis cells in a certain view field is an important index that signifies the aggressiveness of the cancer. It is also reported that the computer image analysis enables the differentiation of malignant tumor such as noninvasive ductal carcinoma in situ (DCIS) from a benign, low-risk lesion, such as usual ductal hyperplasia. DCIS is considered to be preinvasive malignant type and should be treated rapidly. The differentiation is difficult even in visual observation, and computer analysis can provide valuable information for differentiation.
Researches are also conducted for prostate cancer application (Wienert et al. 2012; Wetzel et al. 1999; Tabesh et al. 2007; Mosquera-Lopez et al. 2015). In prostate biopsy examination, firstly cancer regions that have characteristic gland formation must be detected from the tissue, and Gleason score, which is widely used to assess the aggressiveness of the cancer, is determined. The score strongly connected to the selection of treatment. The treatment options include surgery, external or internal radiation, hormone therapy, and follow-up. Accurate classification allows patients better treatment selection for superior quality of life. In conventional visual diagnosis, two most predominant cancer regions are selected, and the gland pattern is classified into five-level grades. The classification is performed with structure or texture analysis. The Gleason score is the sum of the grades for two regions. Automated grading techniques for prostate cancer have been studied long, but most of them were using single microscopic field and determined the grade for the given image. Most recently, using WSI data, full automation is being explored by implementing two steps, cancer detection and grading (Wienert et al. 2012). The computer analysis will facilitate more accurate and quantitative grading system rather than old scoring system which is limited by visual observation.
CAD tool for lymphoma has been also developed (Sertel et al. 2010; Belkacem-Boussaid et al. 2011; Kornaropoulos et al. 2014). Follicular lymphoma is one type of slowly glowing non-Hodgkin lymphoma, and its treatment is selected from some options, i.e., radiation therapy, chemotherapy or immunotherapy that includes molecular-targeted medicine, and follow-up. It is important to distinguish indolent case, and histopathological observation plays a crucial part of the differentiation. In the diagnosis, the number of centroblast cells must be counted in high-magnification image. It is pointed out that the number obtained through visual observation is affected by some factors related to human operation, such as the limited selection of test fields, fatigue, and observer variation. The CAD system first identifies the follicles from the tissue in WSI. To count centroblasts, the technique similar to nuclear detection is used, and the discrimination of centroblast and non-centroblast follows.
4.3.2 Image Analysis of IHC-Stained Tissue
IHC staining technique visualizes the expression of specific antigen in the tissue. In breast cancer, the subtype classification is done based on the presence of estrogen receptor ER), progesterone receptor (PR), human epidermal growth factor 2 (HER2), and Ki-67 protein, and they are assessed by IHC-stained specimen. Most of IHC test is done by using 3,3′-diaminobenzodine (DAB) staining, in which positively stained region appeared in brown, and hematoxylin is used as counterstain, and the negative nuclei becomes blue.
Stay updated, free articles. Join our Telegram channel

Full access? Get Clinical Tree


