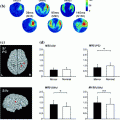
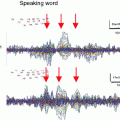
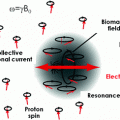
Fig. 1
EEG and fMRI are each primarily sensitive to synaptic activity. The factors that contribute to the non-overlap between EEG and fMRI are listed on top
The aggregate window on brain activity provided by EEG and fMRI likely contributes to their utility in understanding cognition and perception. For example, cognition and perception are thought to emerge from the dynamic interactions between multiple brain areas (Siegel et al. 2012; Varela et al. 2001). These dynamic interactions likely overlap within the timescales of EEG, in the sense that the timescale of changes in our perceptual experience overlaps well with the timescales of fluctuations in EEG. EEG, for example, can separate the early visual response to sensory inputs from the subsequent visual response to the same input following reciprocal interactions with other brain areas (Lamme and Roelfsema 2000). FMRI provides a limited picture of these aspects of neural dynamics. However, fMRI is capable of measuring neural responses throughout the whole brain, providing a window on the brain areas that integrate together over second-by-second time scales.
Synchronization directly contributes to EEG and likely comprises synaptic integration processes that contribute to fMRI. The sensitivity of each measure to synaptic integration suggests that they also provide an aggregate measure of neural excitability, since neural excitability appears to coincide with the phase of synchronous activity (Klimesch et al. 2007). These coordinated bursts of activity help ensure that neurons influence other brain areas in a coordinated, efficient manner. Thus, the spatiotemporal scales and neural sensitivities of EEG and fMRI appear relevant to understand the brain’s integrative processes guiding cognition and perception.
3 Approaches to EEG-fMRI Integration
We now turn our focus to different approaches that have been utilized to integrate EEG and fMRI, and review the findings revealed through each approach. Associations between the two modalities time courses are considered, as examined by correlation or general linear modeling (GLM) of the time courses, by deconvolution of the EEG and fMRI time courses, or by independent component analysis (ICA) of multi-subject EEG and fMRI datasets. These approaches are insensitive to whether there is a direct causal relationship between EEG and fMRI. Thus, there is no implicit assumption that EEG reflects a measure of the neural activity that contributes directly to the BOLD fMRI response.
3.1 Overview of Correlation and GLM Based Findings
The most straightforward approach to integrating concurrent EEG and fMRI is by either correlating the time courses or by including the EEG time course as a predictor in a general linear model (GLM) analysis. In either case, the EEG time course is divided into non-overlapping epochs and converted to its frequency representation (e.g. by Fourier analysis), returning complex valued coefficients for each frequency and epoch. The coefficients are absolute valued, returning the amplitude of each frequency within a given epoch. The EEG epochs are chosen such that each amplitude value (within a given frequency) corresponds in time to a concurrently recorded fMRI acquisition. Broadly, this approach examines whether fluctuations within a given EEG frequency are related to fluctuations within a given fMRI voxel.
Temporal delays between the EEG and fMRI time courses are not directly accounted for in traditional correlation or general linear model (GLM) analysis, since they focus on the instantaneous relationship between variables. Therefore, the delay in the hemodynamic response must be accounted for prior to analysis. The characteristics of the hemodynamic delay are well described by the hemodynamic response function (HRF) (for review see Buxton et al. 2004). The assumption is that the BOLD fMRI response reflects a low-pass delayed representation of the underlying neural activity. The characteristics of the filter are incorporated within the HRF shape. For example, the HRF peaks at a delay of ~6 s, which reflects the delayed increase in blood oxygenation following neural/metabolic events. The low-pass characteristic of the filter incorporates the temporal smearing that results from sluggish hemodynamics. These properties are accounted for by either convolving the EEG time course with the canonical HRF, or by deconvolving the fMRI time course with the canonical HRF.
The initial EEG-fMRI studies focused on correlations between individual fMRI voxel time courses and the amplitude time course of EEG frequencies. This approach can generate an unmanageable number of statistical comparisons if univariate tests are conducted separately for each of thousands of fMRI voxels and for dozens of EEG electrodes and frequency bands. The number of statistical comparisons is typically reduced by focusing a priori on a subset of EEG frequency bands and/or on a subset of fMRI regions of interest (i.e. ROIs). Data decomposition approaches have also been quite successful at reducing the data to a few underlying sources (Eichele et al. 2009).
Initial EEG-fMRI studies focused on fMRI responses associated with the EEG alpha band (e.g. 8–12 Hz). The emphasis on the alpha band was motivated by its robust presence in individual recordings; alpha activity can be observed by an untrained experimenter in unprocessed EEG. The robust presence of alpha activity is particularly important in concurrent EEG-fMRI since the scanner environment introduces substantial artifacts in the EEG (for review see Ritter and Villringer 2006). The salience of alpha activity in EEG recordings likely contributes to their “salience” in the EEG literature, as decades of research have been conducted on the generators and characteristics of the EEG alpha rhythm. It was appropriate that the first EEG-fMRI studies focused on the alpha band as well.
Alpha oscillations appear predominantly over occipital electrodes and demonstrate a robust increase when individuals close their eyes, are drowsy, or engage in mental arithmetic (Klimesch et al. 2007). These tasks involve a lesser degree of visual cortical activity, thus, increased occipital alpha activity is thought to reflect cortical inactivity. This inactivity reduces the ability of visual areas to influence areas of the brain that support current cognitions or tasks. For example, increases in alpha activity are associated with reduced resting-state connectivity between early visual areas and the rest of the brain (Scheeringa et al. 2012). Increased visual inactivity is also synonymous with increased synchrony across visual areas, increased dependence across areas, and an overall reduction in visual complexity (Edelman and Tononi 2000). These processes are also likely associated with reduced cortical metabolism, and the sensitivity of BOLD fMRI to metabolic processes allowed the unique ability to test this theory.
Early EEG-fMRI studies have indeed demonstrated negative relationships between alpha activity and occipital, parietal, temporal, and fontal fMRI responses (Bridwell et al. 2013; de Munck et al. 2009; Goldman et al. 2002; Laufs et al. 2003; Sadaghiani et al. 2010; Scheeringa et al. 2011), and positive relationships between alpha and the thalamus (Bridwell et al. 2013; de Munck et al. 2009; Goldman et al. 2002). The negative correlation is consistent with the idea that increased alpha activity reflects reduced cortical metabolism and a subsequent reduction in the BOLD fMRI response. Equivalently, increased metabolism is associated with increased fMRI responses and a reduction in alpha. This interpretation was further supported by Moosmann et al. (2003) by demonstrating a negative relationship between changes in deoxy hemoglobin (measured by near-infrared spectroscopy (NIRS)) and alpha EEG. The main findings from selected “resting-state” EEG-fMRI studies are demonstrated in Table 1. The majority of studies demonstrate a negative relationship between fMRI and EEG alpha activity. Thus, this finding is one of the most consistent and reproduced findings in the EEG-fMRI literature. It can serve as a useful “sanity check” in EEG-fMRI.
Table 1
Main findings from select EEG-fMRI studies
Study | Rest | Frequencies examined (Hz) | Source separation | Main findings |
|---|---|---|---|---|
Goldman et al. (2002) | Yes (EC: eyes closed) | Alpha (8–12) | No (fMRI) | − with alpha (occipital, temporal, frontal) |
No (EEG) | + with alpha (thalamus) | |||
Laufs et al. (2003) | Yes (EC) | Alpha (8–12) | No (fMRI) | − with alpha (parietal and frontal) |
Beta (17–23) | No (EEG) | + with beta | ||
Mantini et al. (2007) | Yes (EC) | Delta (1–4) | Yes (fMRI) | + with multiple frequencies |
Theta (4–8) | No (EEG) | |||
Alpha (8–13) | ||||
Beta (13–30) | ||||
Gamma (30–50) | ||||
Sammer et al. (2007) | No (mental arithmetic) | Theta (3.5–7.5) | No (fMRI) | + with theta |
Yes (EEG) | ||||
Scheeringa et al. (2008) | Yes (EO: eyes open) | Delta | No (fMRI) | − with delta/theta (“resting state networks”) |
Theta | Yes (EEG) | |||
de Munck et al. (2009) | Yes (EC) | Delta (0.1–4) | No (fMRI) | − with alpha (occipital, parietal) |
Theta (4.5–8) | No (EEG) | + with alpha (thalamic) | ||
Alpha (8.5–12) | ||||
Beta (12.5–36) | ||||
Gamma (36.5–100) | ||||
Sadaghiani et al. (2010) | Yes | All (1–30) | No (fMRI) | − with alpha1 and beta1 (dorsal attn. network) |
No (EEG) | + with alpha2 and beta2 (alertness network) | |||
Scheeringa et al. (2011) | No (attention task) | All (2.5–120) | No (fMRI) | − with alpha and beta |
Yes (EEG) | + With gamma | |||
Bridwell et al. (2013) | Yes (EO+EC) | All (1–35) | Yes (fMRI) | − with alpha3, alpha4, beta1 |
Yes (EEG) | + with delta, theta, beta2, gamma |
3.2 Background and Advantages of ICA in EEG-fMRI
One of the most difficult challenges in multimodal integration is extracting meaningful information from high dimensional datasets. BOLD fMRI responses are obtained within tens of thousands of voxels and each EEG epoch contains information within multiple frequency bands over dozens of electrodes. Integrating the EEG channel by frequency information with the fMRI voxel information with the traditional correlation or GLM approach ignores the rich structure within each dataset, is computationally demanding, and generates an unmanageable number of statistical comparisons. These limitations can be alleviated with blind source separation (BSS) approaches such as spectral ICA (Bridwell et al. 2013; Wu et al. 2010), principle component analysis (PCA), and temporal ICA (for a review see Makeig et al. 2004), as well as semi-BSS approaches such as functional source separation (FSS) (Porcaro et al. 2010, 2011). These approaches decompose each observation as the linear sum of a small number of underlying sources.
Among the data decomposition techniques described above, spatial ICA has demonstrated to be particularly informative and useful in fMRI analysis. For example, ICA (implemented with the Infomax algorithm) can emphasize sparse independent spatial fMRI maps, which aligns with the assumption that cognitive activation is sparse and distributed, and with the sparse and spatially specific nature of cardiac and motion artifacts (McKeown et al. 1998). Temporal ICA is commonly utilized for EEG data, and the assumptions for temporal ICA align well with the theoretical generation of EEG. For example, the decomposition of a time course as a linear sum of independent temporal sources aligns well with the assumption that the response at a single electrode reflects a linear mixture of independent scalp sources3 (for review see Makeig et al. 2004). ICA can also be conducted on EEG spectra, revealing spectral sources that peak within characteristic EEG frequency bands (Bridwell et al. 2013).
BSS approaches are particularly advantageous when EEG and/or fMRI are measured in the absence of an explicit task. For example, BSS algorithms such as ICA utilize the inherent structure in the data to extract underlying spatiotemporal activity patterns. These coherent patterns of activity likely result from activity within somewhat distinct brain modes or sources. The coherent nature of unique modes or sources suggests that they may also be described as distinct brain networks. The unique networks observed with ICA may demonstrate functionally distinct properties. For example, “resting-state” ICA can reveal sources which overlap with brain areas with greater activation during “internal” mental states (e.g. the so-called “default mode” areas). Other sources overlap with brain areas with greater activation during “external” attentive states (Corbetta et al. 2008). Of course, it is difficult or impossible to infer the functional role of networks that are present in the absence of explicit tasks since the individuals’ cognitions are unknown to the experimenter.
ICA is routinely used to extract independent spatial fMRI sources to link with concurrent EEG (for a review see Eichele et al. 2009). EEG is then associated with temporal fluctuations in fMRI spatial sources, rather than individual voxels or clusters. This is advantageous since it separates the voxel response at each point in time by the separate contribution of multiple independent sources. However, only a few EEG-fMRI studies have additionally conducted ICA on the EEG (Bridwell et al. 2013; Eichele et al. 2009; Wu et al. 2010). Thus, BOLD fMRI sources are often linked with EEG spectral information that potentially contains the combined contribution of multiple sources with overlapping frequency bands and spatial locations. A spectral EEG decomposition (with ICA) may reveal sources with distinct peaks that correspond to the traditional EEG frequency bands. This data-driven approach can validate the presence of distinct EEG frequency bands, improving the ability to link fMRI with EEG activity within each band.
It can be particularly important to decompose EEG spectra within the alpha band, as previous studies demonstrate that it contains the combined contribution of multiple distinct networks which may overlap spectrally and/or spatially. The 8–12 Hz alpha band has been subdivided by its upper and lower frequencies, and overlaps in frequency with the central mu rhythm. These different alpha sources demonstrate distinct spatial topographies, spectral peaks, and/or sensitivities to experimental manipulation (Niedermeyer 1997; Nunez et al. 2001), and the average 8–12 Hz activity represents the combined contribution of these multiple independent sources. The presence of multiple sources with overlapping spectral characteristics is also suggested by the difficulty indentifying the boundaries between EEG frequency bands within the average EEG spectrum and the presence of high correlations between the different frequency bands (de Munck et al. 2009; Mantini et al. 2007).
Conducting an independent group ICA within each modality can provide an improved measure of fMRI or EEG network activity while also helping to incorporate as much information as possible within each modality. The approach reduces the need to restrict the analysis to only a subset of fMRI networks (e.g. the default mode), or to restrict analysis to a subset of EEG electrodes or frequencies. An important consequence of this restriction is that it helps guarantee the frequency specificity of the results. Consider the negative relationship between alpha EEG and fMRI as an example. The demonstration of this relationship can be strengthened by demonstrating that similar relationships do not exist for other EEG frequency bands. For example, fluctuations in the alpha band likely reflect both broad fluctuations in the EEG spectral baseline, as well as fluctuations specific to the alpha band. This possibility can be directly addressed by including additional frequencies as covariates in a GLM (de Munck et al. 2009) or multiple linear regression (e.g. PPI) (Scheeringa et al. 2012), by reporting results obtained separately for multiple frequencies, and/or by extracting frequency specific sources with blind source separation (Bridwell et al. 2013; Scheeringa et al. 2008, 2011). In either case, considering multiple frequency bands helps acknowledge the full constellation of fMRI and EEG networks that may be present at any given moment (Mantini et al. 2007; Siegel et al. 2012).
3.3 Multi-subject Extensions of ICA
ICA can extract spatiotemporal patterns within EEG or fMRI data when individuals are not engaged in an explicit task (i.e. “during rest”). Generalization of these results across subjects can be more challenging with ICA than a traditional GLM analysis. For example, GLM analysis can be conducted on fMRI data for each individual subject and the beta weight associated with the experimental time course is utilized as an independent observation in the second level group analysis. Generalization across subjects is straightforward since beta weights can correspond to the same experimental condition across all subjects. ICA decomposes the multivariate fMRI data into a set of independent spatial sources and their associated time courses. Thus, ICA essentially estimates the unknown time courses of functionally distinct spatial maps (in accordance with the assumptions of the ICA algorithm) (Fig. 2). Researchers are then faced with the challenge of pairing up common sources across individuals. This problem can be addressed by incorporating information from multiple subjects within a single ICA decomposition, and then examining the subject specific parts (Beckmann and Smith 2005; Calhoun et al. 2001; Esposito et al. 2005


Stay updated, free articles. Join our Telegram channel

Full access? Get Clinical Tree


