Fig. 22.1
Principle of confocal microscopy using point illumination and pinhole detection
Confocal microscopy that was initially used in gastroenterology utilized a miniaturized scan head located on the distal end of the endoscope. Such scopes need to be stabilized to obtain distinct images that are free of motion artifacts because of a slow scan rate of 1 frame per second. A prototype for pulmonary application with such a distal scan head has an external diameter of 6.6 mm, requires rigid bronchoscopy for airway insertion, and visualizes only the central airways. Distal airway imaging is precluded by the size of the scope. White-light bronchoscopy is also unavailable in this prototype. The advantage of the distal scan head is that it allows adjustment of depth of focus (z-depth) and facilitates imaging of epithelium down to submucosal vasculature (200 μm). Much of the current experience with pulmonary confocal microscopy has been with a proximal scanning system that houses the light source and photodetectors outside the bronchoscope. A miniprobe comprising optical fibers is inserted via the working channel of a flexible bronchoscope to transmit signals to and from the probe to the proximal scanning unit. These miniprobes have faster scan rates of 12 frames per second that reduce motion artifacts. The disadvantage of the proximal, fiber-based system is that focal point of the microscope cannot be adjusted. Therefore, the z-depth is fixed at 50 μm below the contact surface.
The fiber-based confocal microscopy system (Mauna Kea Technologies, Paris, France) that is currently available comprises four components: (1) the flexible miniprobe, (2) argonlaser illumination source with an excitation wavelength of 488 nm, (3) monopixel photodetection system, and (4) image management software (Fig. 22.2). The miniprobe has an outer diameter of 1.4 mm and a length of 3 m. This makes the probes compatible with the working channel of standard flexible bronchoscopes. There are 30,000 optic fibers arranged in a hexagonal pattern that serve as a link between the microscope objective and the proximal scanning unit. The core diameter of each fiber is 1.9 μm with an intercore distance of 3.3 μm. The resultant images comprise 30,000 pixels in a field of view of 600 by 500 μm with a lateral resolution of 3.5 μm.
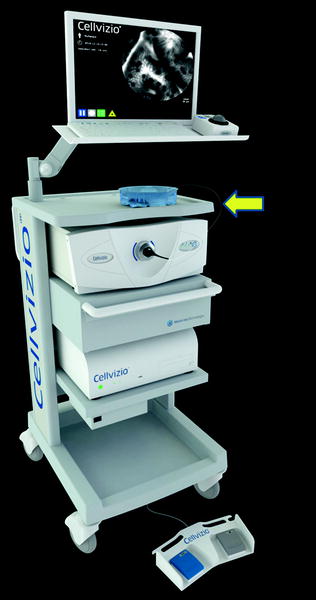
Fig. 22.2
Fiber-based, proximal confocal microscopy system with an arrow indicating the miniprobe that is inserted via the working channel of a flexible bronchoscope
Each fiber serves as both the light delivery system and its own pinhole. These fibers are scanned sequentially by the laser, and in order to generate a two-dimensional image, the sample is scanned in both lateral dimensions. This is achieved by two rapidly moving (4 Hz) mirrors that scan across the fiber bundle in a raster or grid-like fashion (Fig. 22.1). The photodetection bandwidth ranges from 500 to 650 nm in wavelength. The numerical aperture of the objective lens coupled with this photodetection bandwidth and the optical properties of certain tissue also enable profiling of surfaces with three-dimensional images. Numerical aperture refers to the range of angles over which a system emits or accepts light.
Each fiber samples only a single point on the tissue, and image processing builds a mapping based on all these point sources of data. Stored data can later be reviewed using viewer software to make measurements. Fluorescence intensity as measured by the median pixel intensity over a selected image area can also be calculated. Further processing of video sequences is possible with a mosaicing algorithm that recovers a consistent alignment of input frames and utilizes data-fitting to “stitch” together a mosaic. This algorithm combines successive images, as well as cancels movementinduced artifacts before reconstituting a larger static image with a widened field of view. The image area is then increased two- to fourfold. This mosaic processing provides endoscopists with a more complete representation of the targeted region that can be comparable to standard histopathology.
The current limitation of mosaicing is that it is performed post procedure and provides neither real-time information nor direct feedback to the operator on the quality of image acquisition. Dynamic processes such as respiratory motion and blood flow are also not captured. In imaging the lung periphery, miniprobe manipulation is restrained by the size of distal airways, and acquisition of a larger field of view is possible in only half of all bronchopulmonary segments examined. Mosaic stitching of images may be further limited when alveolar fluorescence is reduced, for example, in young individuals with faint septal lines. The reduced fluorescence diminishes signal data available for mosaic “stitching.” In proximal airways, even when miniprobe manipulation is not restrained, the smooth scanning required to generate mosaics is challenging with respiratory movements and coughing. Good imaging also requires perpendicular en-face scanning of the airway walls that can pose ergonomic difficulties.
Image Acquisition in the Lungs
Imaging depends on the fluorescence of the targeted tissue which in turn is determined by the concentration of endogenous cellular and extracellular fluorophores. The predominant fluorescence emission in the lungs after excitation with light at 488 nm originates from elastin as demonstrated by microspectrometer data. On the other hand, collagen and intracellular flavins do not contribute to imaging because they emit an extremely weak signal. Elastin is a major component of the basement membrane of the airways (Fig. 22.3) and the axial scaffolding of pulmonary acini (Fig. 22.4). These fibers function to bear the stress of airway distension and facilitate lung recoil. They are concentrated at the alveolar duct rims, as well as the alveolar ring entrances. Elastin is also part of the external sheath of microvessels in the lung parenchyma. The intensity of elastin fluorescence increases with age, presumably related to cross-linking modifications that occur with time. Sometimes bright specks that are about 3 μm in size are also seen in the alveoli. The cause and significance of this finding has yet to be established.
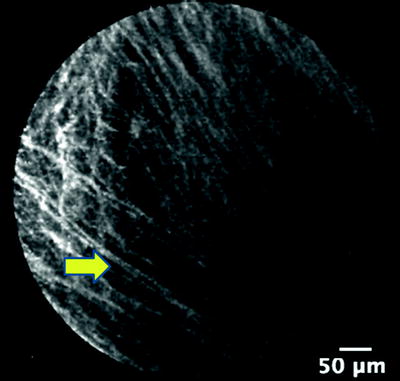
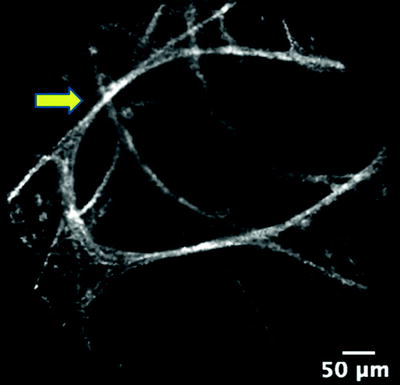
Fig. 22.3
Elastin fibers (arrow) of the basement membrane of bronchi
Fig. 22.4
Elastin fibers (arrow) of the axial scaffolding of pulmonary acini
Endogenous fluorescence is seen in the cells that infiltrate the alveoli of smokers (Fig. 22.5). Bronchoalveolar lavage analysis has confirmed that these cells are alveolar macrophages. The number, size, and mobility of these fluorescent macrophages are directly correlated to the number of cigarettes smoked per day reflecting the degree of macrophage alveolitis. In vitro evidence shows that the fluorescence is attributed to the particulate fraction of cigarette smoke especially tobacco tar. There is similar data using exposure to oil fly ash to explain why nonsmokers have a dim, less distinct macrophage fluorescence caused by the inhalation of air pollution.
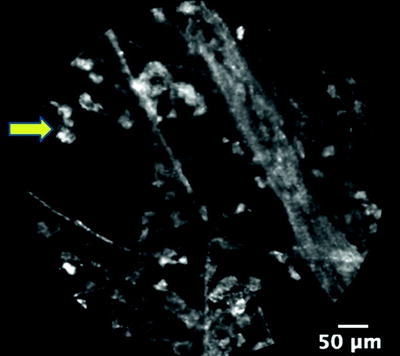
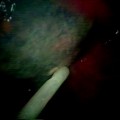
Fig. 22.5
Mobile, fluorescent macrophages (arrow) in the alveoli of a current smoker
Exogenous fluorophores that are not toxic have been utilized to enhance imaging on confocal microscopy. Intravenous agents such as fluorescein as well as topical agents such as cresyl violet or methylene blue have shown potential in this area. The use of intravenous fluorescein as a contrast agent has been established in ophthalmology for more than 30 years and has FDA approval for such indications. Although it does not stain nuclear structures, in confocal microscopy of the gastrointestinal tract, fluorescein enhances the imaging of epithelial cells. The peak excitation is with light of 494 nm in wavelength that makes it compatible with the current laser source. The quick diffusion of fluorescein will allow images to be seen 30 s after injection and effects last up to 30 min with an optimal image quality at 8–10 min. This is compatible with bronchoscopic procedures. Typically, 10 ml of 0.25% fluorescein sodium solution is injected via a peripheral venous catheter, and bronchoscopic evaluation is performed 1 min after injection. Side effects include nausea and vomiting that are reported in 2.2% as well as temporary yellow discoloration of the eyes and skin. Rare adverse events include anaphylaxis, seizures, thrombophlebitis, and arterial ischemia. Fluorescein should be used with caution in patients on β-blockers because of the risk of anaphylaxis as well as anyone with renal dysfunction or a recent ischemic cardiac event.
Fluorescein-enhanced confocal microscopy of normal alveoli clearly reveals a foam-like picture with the identification of dark air bubbles. It is hypothesized that the air-liquid interface at the tip of the miniprobe creates these bubble-like structures that can also be seen faintly in imaging unenhanced by fluorescein. What is uncertain is whether this fluid is only surfactant or airway secretions that have been brought in during the placement of the miniprobe. Fluorescein is secreted in large amounts into the intrapulmonary fluid of distal airways and enhances the bubble foam that is superimposed on imaging of alveoli. In malignant and inflammatory disease, cellular infiltration appears to remove surfactant and obliterate the formation of bubble foam. Instead images of dark cell-like structures may be seen adjacent to alveolar walls.
In the proximal airways, fluorescein disappointingly does not stain epithelial cells and consequently does not aid imaging. Even when large endobronchial lesions were directly imaged with the miniprobe, tumor cells were not seen. This is in direct contrast to gastrointestinal imaging where fluorescein enhances the epithelium. A differential absorption of the stain by mucosa in the respiratory tract compared to the gastrointestinal tract is suggested, possibly secondary to differential perfusion. Another reason for the poor results with fluorescein in the bronchi is the fact that miniprobes used for the gastrointestinal tract utilize light at a wavelength of 660 nm and consequently have a different focal plane.
Methylene blue is a potent topical fluorophore that enters cells and reversibly binds with DNA in the nuclei. However, the maximum excitation is with light of wavelength 664 nm which necessitates the use of the 660-nm miniprobe. When used in clinical practice, the targeted airways are initially scanned with the pulmonary 488-nm probe before topical instillation of 0.5 ml of diluted methylene blue and rescanning with the 660-nm gastrointestinal miniprobe. In the proximal airways, it has been possible to image the epithelial surface of the bronchi. If peripheral lung lesions are targeted, then methylene blue is instilled via an extended working channel, and cellular details of tumor cells in lung nodules can be seen. Methylene blue is contraindicated in patients with glucose-6-phosphate dehydrogenase deficiency because of the risk of oxidative stress-induced hemolysis. Physiological pH cresyl violet (excitation maximum at 591 nm and emission maximum at 628 nm) is being developed as another topical fluorophore. It is an organic compound that is used as a common stain in white-light microscopy. The advantage of this stain is that the 488-nm excitation light can be utilized, making any change of miniprobe unnecessary.
Clinical Potential of Confocal Imaging
Probe-based confocal imaging is usually performed using flexible bronchoscopy necessitating only moderate sedation. The tiny field of view makes systematic examination of the entire airways impractical. Therefore, white-light bronchoscopic examination is first performed before an area of interest is scanned with the microscope. Optical biopsy images are obtained by perpendicular application of the probe directly against the bronchi. A mosaic is then created by gently drawing the probe across the target. To obtain optimal images, secretions must be suctioned out and the airways adequately anesthetized with topical lidocaine.
Examination of distal bronchopulmonary segments is ideally performed with a small bronchoscope (outer diameter 4.4 mm) to facilitate navigation in the smaller bronchi. Usually up to eight segments are scanned based on preprocedure CT analysis, and only unilateral examination is performed because of the potential for pneumothorax. For subsequent correlation with radiology, rigorous documentation of which segment that is entered is necessary. Scanning of the apical and posterior segment of the upper lobes is not possible because of the inherent stiffness of the miniprobe.
Once the bronchoscope is placed in the smallest accessible bronchus, the miniprobe is gently advanced until images of the pulmonary acini are seen. The orthogonal branching of the airways and the size of the probe relative to distal airspaces presume that the probe passes through bronchiolar walls and peribronchial connective tissue before being stabilized in the acini. Hence, respiratory bronchioles are regularly bypassed in scanning. Typically, en-face images are obtained, but images at various angles providing various perspectives can be seen as well. Once the alveoli are reached, there is a compression effect that is caused by the probe pressing on more distal structures. This visualizes the background planes that are beyond the 50-μm focus, creating a three-dimensional effect. Best results are obtained by withdrawing the probe once acini are seen and analyzing the last image before contact is lost (Fig. 22.4). At this point, deformation is minimized and reproducible measurement of alveolar structures is possible.
In practice, video segments of confocal scanning of up to 30 s are recorded in each segment once clear and consistent images are seen. Then, mosaic images are stitched together, and representative still pictures are obtained. The viewer software facilitates measurement of both structure dimensions and fluorescence intensity. Intraobserver and intrapatient reliability have been proven to be excellent. Interobserver agreement between blinded reviewers on the brightness of images has been shown to be high with an intraclass correlation coefficient (ICC) ranging from 0.53 to 0.99 (p < 0.001). However, the agreement on fiber thickness in the respiratory bronchioles is poor with an ICC of 0.12 (p < 0.05) and in the alveoli is fair with an ICC of 0.37–0.42 (p


Related posts:


Stay updated, free articles. Join our Telegram channel
Full access? Get Clinical Tree
