Systolic dysfunction
Dilated cardiomyopathies
Ischemic cardiomyopathy
Valvular disease
Hypertension
Hypertrophic cardiomyopathy
High-output cardiomyopathy
Tachycardia-mediated cardiomyopathy
Thyrotoxicosis
Nutritional deficiencies
Left to right shunt lesions
Anemia
Diastolic dysfunction
Hypertrophic cardiomyopathy
Hypertension
Valvular disease
Restrictive cardiomyopathies
Pericardial disease
Constriction
Incidence of myocardial infarction increases with advancing age, and changes in the heart increase the risk of ischemic heart disease. Decreased nitric oxide synthase activity with age leads to decline in endothelial vasodilation. Endothelial vasodilation increases coronary blood flow in response to increased myocardial oxygen demands; thus, maximal coronary blood flow declines with age. Endothelial dysfunction results in progression of coronary artery disease and a greater risk of developing ischemia. Aging is also associated with a decrease in capillary density and coronary reserve, leading to myocardial ischemia (Shih et al. 2011). While some patients have clear myocardial infarctions, HF due to left ventricular systolic dysfunction (LVSD) associated with myocardial ischemia may occur insidiously in elderly persons. The wealth of interventions available to treat ischemia means that it is important to identify both LVSD and viable myocardium for which treatment would improve left ventricular function.
Therapeutic interventions for LVSD are based on evidence that they improve function, quality of life, and longevity. Interventions include medications as well as devices such as cardiac resynchronization therapy (CRT). Data do not support these same interventions in HF with normal or preserved ejection fraction (HFnEF or HFPEF); thus, assessment of left ventricular function and an exploration of HF etiology is fundamental to management of HF in the elderly.
Hypertension can lead to LVSD, but in elderly persons it is also commonly associated with HFnEF due to stiff vasculature and ventricles that fill poorly in diastole (diastolic dysfunction). Normal aging is associated with progressive increase in ventricular stiffness and impaired relaxation, so documenting diastolic dysfunction in an elderly patient does not make a diagnosis of HF. The diagnosis of HF is based on the presence of the HF syndrome; although objective measurement of diastolic function can confirm the diagnosis, it is not necessary (Zile et al. 2001). In the absence of HF, even mild diastolic dysfunction is associated with an increase in all-cause mortality (Redfield et al. 2003).
11.2 Echocardiography
11.2.1 Introduction
Echocardiography has been the mainstay of imaging for initial assessment, diagnosis, and treatment of HF. Transthoracic echocardiogram is a key tool for establishment of diagnosis and tracking of function in HF. Transthoracic echocardiography is a class I diagnostic test for management of HF, as described by the American College of Cardiology/American Heart Association, and serves as a basis for comparison when there is a change in clinical status or to determine the impact of medical treatment. Underuse of transthoracic echocardiography is associated with reduced survival (Senni et al. 1999). Numerous important diagnostic measures obtained by echocardiography assist with treatment: left ventricular dimensions, left ventricular function, diastolic function, secondary valvular dysfunction, tissue characterization, pulmonary hypertension, as well as right ventricular dysfunction and dilation. This discussion focuses on left ventricular function.
11.2.2 Left Ventricular Volumes, Ejection Fraction, and Systolic Function
Treatment of all dilated cardiomyopathies targets myocardial remodeling. Cardiomyopathy management is based on formal assessment that demonstrates systolic dysfunction and left ventricular dilation.
Initial single linear measurements of ventricular function and volume are measured along the minor axis of the heart using Teichholz M-mode echocardiography as shown by Fig. 11.1. Measurements are made during diastole and systole with further calculation of ventricular shortening to determine function. Single segment measurement leads to geometric assumptions that a single recording represents the ventricular function as a whole (Teichholz et al. 1976).
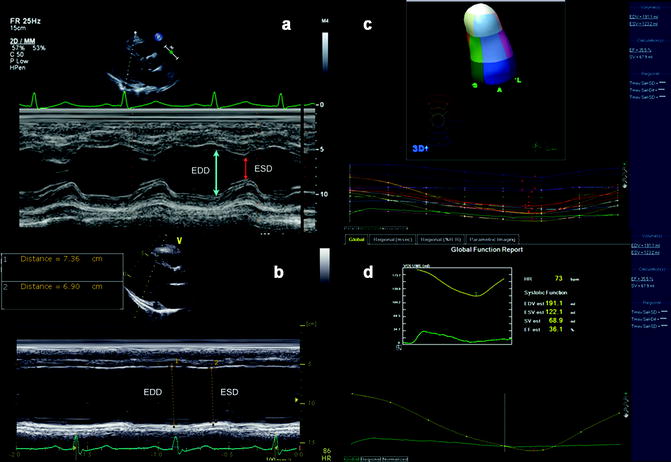
Fig. 11.1
(a) Two-dimensional M-mode identifying both septal and posterior wall thickness as well as LV end diastolic and LV end systolic dimensions that are used to calculate ejection fraction in the setting of preserved ejection fraction. (b) M-mode recording of patient with significant systolic dysfunction and left ventricular dilation. (c) Reconstructed 3D assessment of left ventricle as subdivided into 17 segments (left) and graphed instantaneous volumetric changes in the defined segments (below) in a 3D echocardiography. (d) Graphic reconstruction of global ejection fraction from 3-dimensional echocardiography
Two-dimensional echocardiography has largely replaced M-mode for evaluation of left ventricular volume and function. One common method for measurement of left ventricular volume is the Simpson biplane method, for which the transducer must be at true apex to obtain four- and/or two-chamber views. Simpson calculation is measured by dividing the ventricle into a series of equal disks per its long axis. Volume is then calculated from the total of all disk volumes. This method can underestimate left ventricular volume and overestimate ejection fraction if the transducer is positioned tangentially and not at the true apex. Additionally, the borders of the ventricle are outlined prior to calculation but can be difficult to determine due to the boundaries of the trabeculae.
Contrast echocardiography is routinely used and can further delineate endocardial borders and improve assessment of ventricular volume and wall motion abnormalities (Kasprzak et al. 1999; Konstam et al. 2011; Mulvagh et al. 2000). Expanding on this modality with harmonic enhanced contrast imaging with echocardiogram is an alternative for assessment of ventricular volumes (Kasprzak et al. 1999).
Tissue Doppler imaging assesses left ventricular function, by using the time velocity integral (TVI) of the left ventricular outflow tract, which is generally assessed via the apical view. The TVI is obtained by determining the cross-sectional area of flow multiplied by the mean velocity of flow. TVI then correlates to the volumetric flow for a single heart beat and corresponds to stroke volume. Limitations of this method include the use of only one beat for overall cardiac output, which may not be accurate. Additionally, the use of circular dimensions to calculate the area of the left ventricular outflow tract can lead to error because the outflow tract is not perfectly circular. Time velocity integral calculation can be used to assess flow across valves.
Three-dimensional echocardiogram gives a geometric assessment of left ventricular function and shape independent of plane (see Fig. 11.1c, d). It is more accurate in assessment of left ventricular volume, shape, and function than 2D echocardiography and comparable to cardiac MRI (Chuang et al. 2000). Three-dimensional echocardiography is rising in use and availability, but has not fully replaced 2D echocardiogram techniques.
Newer echocardiographic methods for evaluation of left ventricular function include the use of Doppler and speckle for assessment of strain. These imaging modalities are able to quantify ventricular shape, mechanics, and deformation using strain techniques (Helle-Valle et al. 2005; Urheim et al. 2000). Strain refers to myocardial stress and can be determined by the change in length between points. Strain rate refers to changes in flow velocities between points (Helle-Valle et al. 2005; Urheim et al. 2000). Strain and strain rate are used to formally calculate left ventricular function and tissue deformation, but are not used in routine management of HF.
11.2.3 Diastolic Function
Approximately 50 % of HF patients have HFnEF with diastolic dysfunction as the primary pathophysiology (Vasan et al. 1995). Several different pathological processes lead to diastolic dysfunction, defined as ventricular stiffness and impaired ventricular relaxation (Paulus et al. 2007). Most patients with LVSD have diastolic dysfunction. Older patients may have diastolic dysfunction or “age-related changes” identified on echocardiogram, without HF.
Diastolic function is evaluated with pressure gradients, velocities, and volumes using Doppler transthoracic echocardiogram. No single echocardiographic parameter defines the severity of diastolic dysfunction. Flow velocities are quantified from pulsed wave Doppler in an apical four-chamber view. Mitral inflow velocity in early diastolic filling, when most left ventricular filling is completed, is referred to as E velocity. The E velocity reflects pressure between the left atrium and left ventricle, compliance, and rate and level ventricular relaxation. As pressures equalize the filling slows in diastasis, the velocity of flow across the mitral valve decreases; the time over which this occurs is referred as deceleration time. Movement of the mitral valve annulus with left ventricular filling is characterized with Doppler echo with its velocity of movement E′ and considered a measurement of relaxation. Late filling flow velocity occurs with atrial systole and is referred to as A velocity. Normally, early mitral velocity (E) is greater than late mitral velocity (A) so the ratio E/A >1 (Kasner et al. 2007; Rokey et al. 1985). Left ventricular filling pressure can be predicted by using early mitral flow velocity and mitral annulus velocity as calculated by E/E′ which has been well correlated to measurements of mean capillary wedge pressures (PCWP) (Bruch et al. 2007; Nagueh et al. 2009). Additional common measurements that assist with characterization of diastolic function include the isovolumetric relaxation time (IVRT) and pulmonary venous flow patterns.
Diastolic dysfunction severity is characterized by stages (see Table 11.2 and Fig. 11.2). Stage I involves impaired relaxation, causing decreased early diastolic filling with subsequent lower E, increased filling with atrial contraction, and prolonged deceleration time (Nishimura and Tajik 1997). There is a reversal of E/A ratio, without an increase in filling pressures or left atrial pressure. This pattern is seen in many elderly patients. Stage I patients are not symptomatic at rest but may develop HF symptoms with exertion or stress.
Parameter | Units | Normal | Impaired relaxation (stage I) | Pseudo normal (stage II) | Reversible restrictive filling (stage III) |
|---|---|---|---|---|---|
E/A ratio | Unitless | 0.9–1.5 | ≤0.8 | 0.8–1.5 | >2 |
E/A ratio with Valsalva | % change | Ratio unchanged | Ratio unchanged | Ratio reverses, E decreases, and A increases | Ratio decreases and >1 |
Deceleration time | ms | 140–240 | Increased | Normal | Decreased |
E′ (cm/s) (septum) | cm/s | >10 | Decreased (|) | Decreased (||) | Decreased (|||) |
E/E′ (average) | cm/s | ≤8 | Normal | Increased (⌈) | Increased (⌈⌈) |
Pulmonary venous flow (systolic (S) to diastolic (D) flow ratio) | Unitless | S≥D | S>D | S≤D | S<<D |
Fig. 11.2
Schematic shows the general patterns often associated with the various stages of diastolic dysfunction. These include left ventricular filling pressure, mitral inflow velocities (E and A), mitral annular velocity (E′ and A′), and pulmonary venous flow (including S, D, and Ar) (Adapted from Nagueh et al. (2009))
Stage II diastolic dysfunction, called “pseudo normalization,” occurs with continued worsening in relaxation and increasing left ventricular stiffness that requires compensatory increase in left atrial pressure and increased pressure across the mitral valve. Early mitral velocity (E) and shortening of deceleration time leads to measurements of E/A ratio and deceleration times within normal ranges (Nishimura and Tajik 1997). The Valsalva maneuver will decrease preload so echocardiographic imaging shows a ≥50 % decrease in E velocity and unchanged A velocity with subsequent decrease in E/A ratio (Hurrell et al. 1997; Nagueh et al. 1997, 2009).
In grade III diastolic dysfunction, the primary deficit is restriction to filling as the ventricular becomes increasingly stiff. At this point it remains very difficult to maintain filling with rising atrial pressures. Flow velocities during this stage show a very high early mitral inflow velocity but concurrently a rapid equalization of atrial to ventricle pressures with shorter deceleration times. Flow continues during diastole with decreased mitral velocity with atrial contraction. The E/A ratio rises (Appleton et al. 1988). Filling pressures rise as documented by rising E/E′ and there is pulmonary flow reversal (Nagueh et al. 2009). Treatment of grade III diastolic function can improve filling pressures and some hemodynamic reversal is possible. However, this can progress to grade IV dysfunction when the hemodynamics associated with further restrictive filling cannot be improved upon.
11.2.4 Determining Etiology of Cardiomyopathy
At initial diagnosis of HF, further characterization of anatomic abnormalities and potential causes is imperative. Echocardiography identifies dilated cardiomyopathy, usually demonstrating biventricular dilation and dysfunction, atrial dilation, secondary valvular regurgitation, diastolic dysfunction, and pulmonary hypertension.
11.2.4.1 Ischemic Cardiomyopathy
Ischemic cardiomyopathy is the leading cause of HF and often progresses to a dilated cardiomyopathy. Two-dimensional echocardiography evaluates regional wall motion and function by separating the left ventricle into a 17-segment model. Numerous views assess the wall motion abnormalities and may help localize culprit coronary artery territories. However, ischemic cardiomyopathy can present with global hypokinesis, in which case additional diagnostic imaging is appropriate to identify ischemia.
11.2.4.2 Non-ischemic Cardiomyopathy
There are numerous causes for dilated cardiomyopathy in the elderly, including alcohol and other toxins, diabetes, hypertension, and less commonly familial or genetic cardiomyopathy. Myocarditis is an uncommon cause for dilated cardiomyopathy in the elderly.
Idiopahtic Dilated Cardiomyopathy
Non-ischemic or idiopathic dilated cardiomyopathy is associated with increased left ventricular volume and reduced systolic function and can include left ventricular hypertrophy on transthoracic echocardiogram and Doppler imaging. Often both the proximal posterior lateral walls have preserved regional function in non-ischemic cardiomyopathies (Bach et al. 1995; Young et al. 2001). Echocardiographic findings in acute myocarditis include left ventricular dysfunction with marked left ventricular dilation and normal wall thickness (Felker et al. 2000).
Hypertrophic Cardiomyopathy
Hypertrophic cardiomyopathy (HCM) is a complex disorder with both genetic and sporadic forms that differ in presentation but all have an inappropriate level of left ventricular hypertrophy. HCM can be defined by left ventricular hypertrophy of >15 mm in absence of other systemic cause. Other characteristics of HCM include diastolic dysfunction, dynamic ventricular outflow obstruction, progression to systolic dysfunction, and increased risk for ventricular arrhythmias (Maron 2002). While HCM mostly occurs in younger individuals, approximately 25 % of HCM cases occur in individuals older than 75 years (Maron 2002; Maron et al. 1999).
Septal to posterior wall thickness on M-mode echocardiogram ≥1.3:1 is nonspecific for HCM but is evidence of inappropriate septal hypertrophy. Flow patterns and degree of ventricular hypertrophy is fully assessed with use of color flow and Doppler. Location of hypertrophy is variable and often asymmetric (Maron et al. 2003). Dynamic left ventricular outflow obstruction in the form of systolic anterior motion (SAM) of the mitral valve occurs with hemodynamic changes or at rest (Luckie and Khattar 2008). M-mode and 2D echocardiography can readily detect SAM (see Figs. 11.3 and 11.4). Mitral regurgitation is commonly found in HCM and can be secondary to structural mitral abnormalities or due to malcoaptation with SAM of the mitral valve (see Fig. 11.5). Further quantification of flow obstruction by gradient can be determined using tissue Doppler imaging and may require physiologic maneuvers to unmask (Fig. 11.6). Newer imaging techniques including Doppler-derived strain and 2D strain imaging can evaluate localized myocardial movement and tissue deformation (Afonso et al. 2008). Three-dimensional echocardiography has shown promise for full geometric assessment of hemodynamics (Afonso et al. 2008).
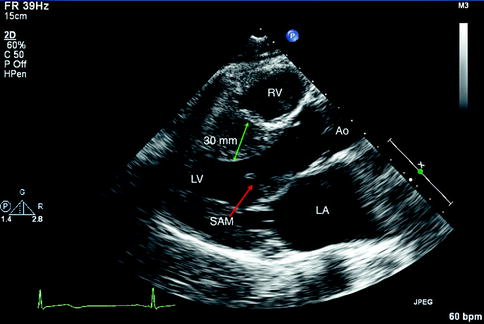
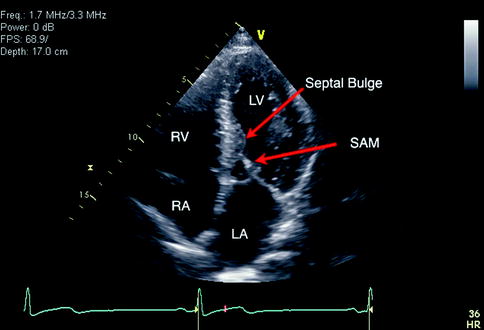
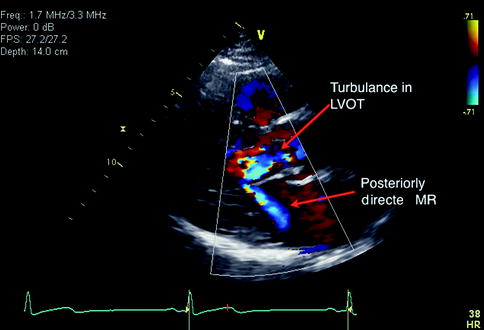
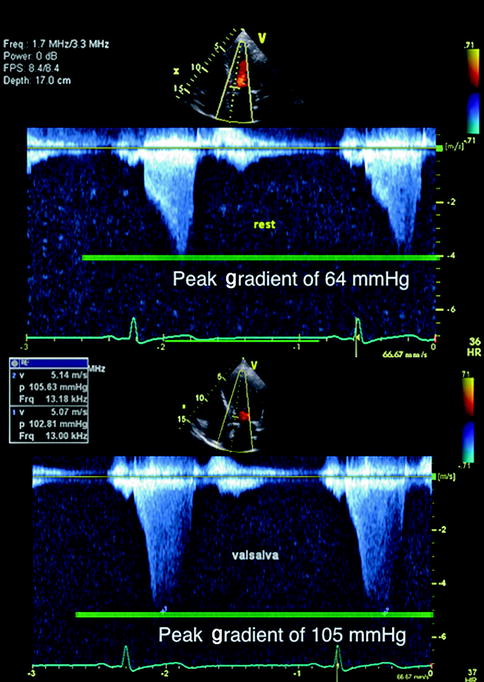
Fig. 11.3
Parasternal long axis view recorded in a patient with hypertrophic cardiomyopathy. There is septal hypertrophy, left ventricular hypertrophy, as well as visualization of the systolic anterior motion (SAM) of the mitral valve leaflet. LV Left Ventricle, RV Right Ventricle, RA Right Atrium, Ao Aorta, LA Left Atrium
Fig. 11.4
Apical four-chamber view in a patient with hypertrophic cardiomyopathy. Features include midventricular septal hypertrophy and a bulge with systolic anterior motion of mitral valve with outflow obstruction. LV Left Ventricle, RV Right Ventricle, RA Right Atrium, SAM Systolic Anterior Movement, LA Left Atrium
Fig. 11.5
Parasternal long axis view with color Doppler imaging in an individual with hypertrophic cardiomyopathy. Systolic anterior motion of the mitral valve leads to turbulent flow in the left ventricular outflow tract (LVOT). This also creates secondary mitral regurgitation with a posteriorly directed jet as shown
Fig. 11.6
Continuous Doppler of left ventricular outflow tract to evaluate quantification of outflow tract obstruction in an individual with hypertrophic cardiomyopathy. It shows characteristic increased late-peaking outflow gradient at rest above with subsequent increase with Valsalva (decreased preload)
Differentiating Restrictive Cardiomyopathy and Pericardial Constriction
Two distinct processes that can be difficult to differentiate at times but can be managed in very different ways are restrictive cardiomyopathy and pericardial constriction. Both processes can occur in elderly populations and no imaging technique is totally reliable for differentiation. Often cardiac catheterization is required to directly measure filling pressures and hemodynamics. Transthoracic echocardiogram is regularly used to characterize some of the differences. See Table 11.3 for a comparison between restriction and constrictive pericarditis.
Table 11.3
Differentiation of restrictive cardiomyopathy from pericardial constriction
Variable | Restriction | Constriction |
|---|---|---|
Atrium | Dilated | Normal |
Left ventricular size | Normal | Normal |
Pericardium | Normal | Thickened |
Septum movement | Normal | Respiratory variation |
E/A ratio | Increased | Increased |
Mitral E velocity | Normal | Respiratory variation |
Deceleration time | Decreased | Decreased |
Annular E′ | Decreased | Increased |
Hepatic Doppler flow | Inspiratory diastolic flow reversal | Expiratory diastolic flow reversal |
The physiologic process that contributes significantly to restrictive cardiomyopathy involves diastolic dysfunction with impaired relaxation, ventricular stiffness, and impaired left ventricular filling. Numerous causes of restrictive cardiomyopathy include amyloidosis, sarcoidosis, hemochromatosis, idiopathic, or even secondary restrictive cardiomyopathy.
Cardiac amyloidosis has unique features on 2D and M-mode echocardiogram, including thickened left ventricular wall, “granular sparkling” of the myocardium, thickened heart valves, and biatrial enlargement (Selvanayagam et al. 2007; Siqueira-Filho et al. 1981). The sparkling tissue appearance is not specific and can be enhanced with harmonic mode on more recent echocardiography scanners (Selvanayagam et al. 2007). Abnormal echocardiographic features in preclinical amyloidosis patients have been found using newer Doppler, strain, and strain rate techniques (Koyama et al. 2003). Figures 11.7 and 11.8 demonstrate some features found in amyloidosis.
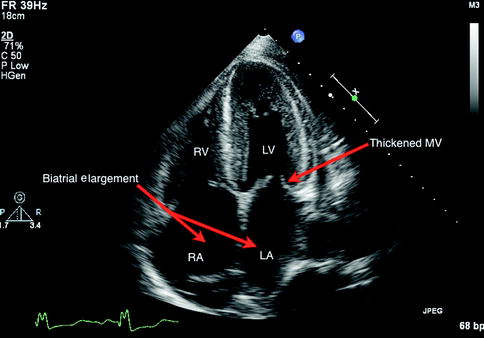
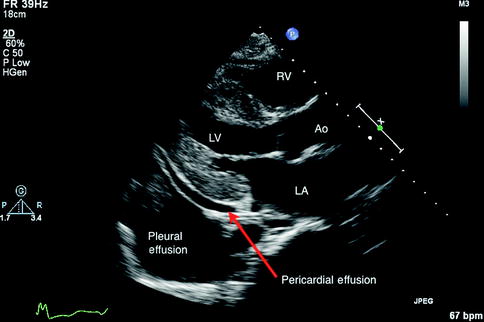
Fig 11.7
Four-chamber apical view in a 2D transthoracic echocardiogram identifying the characteristic features of cardiac amyloidosis including preserved left ventricular size, mitral valve thickening, and biatrial enlargement. LV Left Ventricle, RV Right Ventricle, LA Left Atrium, RA Right Atrium
Fig. 11.8
Parasternal long axis view in a transthoracic echocardiogram of amyloidosis with left atrial dilation as well as other features that may or may not be present, including a small pericardial effusion and pleural effusions RV Right Ventricle, LV Left Ventricle, AO Aorta, LA Left Atrium
General echocardiographic features of restrictive cardiomyopathies include biatrial enlargement, normal ventricular wall thickness, and non-dilated ventricle (Ammash et al. 2000). Hemodynamic changes can exhibit restriction (see Fig. 11.9) with increased mitral E velocity, increased E/A ratio, and shortened deceleration time (Appleton et al. 1988). Impairment in relaxation also is reflected in mitral annulus with decreased E′ measurements in restriction.
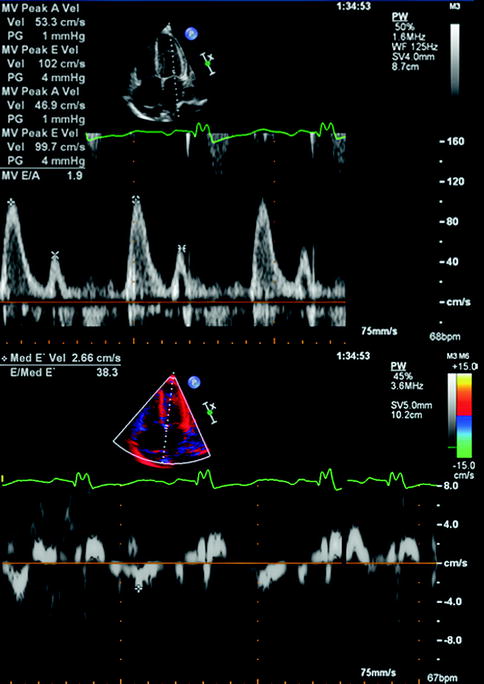
Fig. 11.9
Transthoracic echocardiogram using pulsed Doppler with imaging of mitral inflow as well as annular Doppler tissue imaging in an individual with restrictive cardiomyopathy secondary to amyloidosis. The above recording shows an E/A ratio of 2 with a short deceleration time, which is characteristic of restriction. The mitral annular velocity shown below measures an E/E′ of 38, which correlates with elevated filling pressures in restriction
Pericardial constriction is rare and can present with mixed restriction and constriction physiology. Potential underlying causes include inflammation, neoplasm, or infection. Anatomically constriction is often characterized by a thickened pericardium or effusion. However, at times even chest x-ray or CT scans confirm the presence of calcified pericardium, which is characteristic. Ventricular compliance is decreased in both constrictive pericarditis and restrictive cardiomyopathy but is notably different based on the underlying mechanism of restriction. In pericardial constriction, ventricular compliance is directly related to fixed pericardial restriction, whereas the myocardium is restricted in restrictive cardiomyopathies.
The hemodynamic characteristics of pericardial constriction measured by transthoracic echocardiogram are related to dissociation of normal intracardiac and intrathoracic pressures as well as ventricular interdependence (Hatle et al. 1989). Specific findings can include respiratory variation in left ventricular isovolumetric relaxation time and peak mitral flow velocity (Hatle et al. 1989). Other respiratory conditions can lead to similar respiratory variation in mitral velocities (see Fig. 11.10). Motion of the septum may be abnormal due to competitive filling of the ventricles (see Fig. 11.11). Measurement of hepatic venous flow is also monitored with echocardiogram and can differentiate constriction from restriction. Specifically, there is diastolic flow reversal during expiration in constriction but restriction reverses during inspiration (Oh et al. 1994). Doppler assessment of the mitral annulus reveals rapid early relaxation of the annulus in pericardial constriction and notably reduced mitral annulus velocity (E′) in restriction.
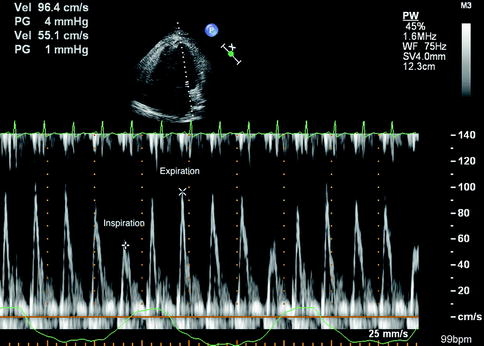
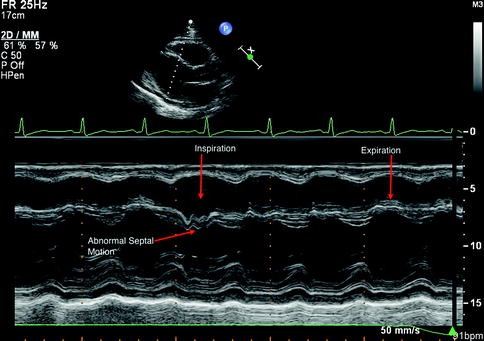
Fig. 11.10
Pulsed Doppler evaluation of mitral inflow in the setting of constrictive pericarditis. There is significant respiratory variation in mitral inflow velocity (E wave), which is characteristic of pericardial restriction
Fig. 11.11
M-mode echocardiography of parasternal long axis assessment of septal movement in an individual with constrictive pericarditis. Paradoxical motion of the ventricular septum toward the left ventricle during inspiration characterizes ventricular interdependence
11.2.5 New Uses: Cardiac Resynchronization Therapy
Medical management of HF can improve clinical symptoms. For patients with dyssynchronous contraction of the left and right ventricle, cardiac resynchronization therapy (CRT) may improve quality of life, ejection fraction, and survival and reduces hospitalization for HF (Cleland et al. 2005).
Echocardiographic measures of dyssynchrony may identify individuals who will respond to CRT. Small single center studies have shown connections between echocardiographic features of dyssynchrony and response to CRT (Hawkins et al. 2009). On the other hand, a multicenter study of 12 measures of dyssynchrony by echocardiogram did not successfully identify patients who would respond to CRT therapy (Chung et al. 2008). The use of echocardiography for cardiac resynchronization is a complex and controversial topic.
11.2.6 Limitations
Transthoracic echocardiogram is widely available, affordable, and safe and can be performed at a patient’s bedside. Table 11.4 reviews the advantages and disadvantages of 2D and 3D echocardiography. Echocardiography requires experienced and expert sonographers as well as echocardiographers. The transducer itself is very sensitive and can easily generate artifacts, which can make interpretation difficult.
Table 11.4
Transthoracic echocardiography comparisons
Advantages | Disadvantages |
|---|---|
2D echocardiography | |