Agent
Manufacturer
Bubble size
Shell
Gas
First generation
Echovist
Schering
8 μm
Galactose
Air
Second generation
Albunex
Mallinckrodt
4.5 μm
Albumin
Air
Levovist
Schering
2–3 μm
Galactose
Air
Myomap
Quadrant
Albumin
Air
Quantison
Quadrant
Albumin
Air
Sonavist
Schering
2 μm
Cyanoacrylate
Air
Third generation
Definity
Bristol-Myers Squibb
2.5 μm
Lipid
Octafluoropropane
Sonazoid
GE Healthcare
3 μm
Lipid
Perfluorocarbon
Imagent
Alliance
5 μm
Lipid
Perfluorohexane
Optison
GE Healthcare
2.25 μm
Albumin
Perfluorobutane
SonoVue
Bracco
2.5 μm
Lipid
Sulfurhexafluoride
PB 127
Point Biomedical
4.0 μm
Polymer
Nitrogen
Fourth generation
Echogen
Sonus
2–5 μm
Colloid
Perfluoropentane
BR 55
Bracco
1.5 μm
Phospholipid
Perfluorobutane/Nitrogen
Contrast agents are generally safe, and adverse reactions are very rarely observed [2, 3]. The main potential risks are US-induced cavitation or anaphylactic shock. The cavitation effect has been demonstrated in vitro with very high UCA concentration and acoustic power. With recommended clinical values, no significant biological effects have been observed. The components of the shell pose a risk of mostly mild allergic reactions.
CEUS Imaging Modalities
In conventional ultrasound (B-mode) imaging, UCAs produce an increase in gray-scale value, which makes blood vessels appear hyperechoic. However, in small vessels the number of microbubbles is low and their signal is easily masked by that of the surrounding tissue.
Power/Color Doppler Imaging
Originally, the development of UCAs was intended to increase the amount of scatterers in the bloodstream to improve Doppler-based imaging of flow velocity in smaller vessels. With Doppler imaging, the echoes received from the moving scatterer (in this case red blood cells in the vessels) are slightly shifted in frequency with the transmitted ultrasound signal. This Doppler shift is related to the velocity of the scatterer. It is therefore possible to generate a map where the velocity and direction at each pixel is coded: color (directional) Doppler. Due to the sensitivity to motion artifacts, the Doppler signal of blood flow may be masked by that of tissue movements. Administering contrast agents to the blood flow increases the number of scatterers and, therefore, the Doppler signal. This is especially suitable for power (nondirectional) Doppler, which integrates the power from all moving scatterers.
Harmonic Imaging
Harmonic imaging exploits the nonlinear behavior of the microbubbles. When microbubbles are insonified with a certain frequency, they oscillate nonlinearly as a result of the shell structure (mechanical behavior) and the gas in the microbubble. The received signals contain multiples of the insonification frequency (so-called harmonics). Separating the harmonic part of the received ultrasound signal and processing this signal alone (either gray scale or Doppler) increases the so-called contrast-to-tissue ratio (CTR), i.e., it suppresses the tissue signal and enhances the UCA signal. Power Doppler in combination with harmonic imaging provides an effective tool for the detection of flow in the smaller vessels. For contrast-specific imaging, other frequency bands, such as subharmonics, ultraharmonics, and superharmonics, can also be used to increase the CTR [4].
Multi-pulse Imaging
The first multi-pulse imaging modality developed is the technique of pulse inversion imaging [5]. In this modality, a sequence of 2 US pulses is transmitted into the tissue. The second pulse is an inverted copy of the first. For a linear medium (e.g., biological tissue) the response to the second pulse is an inverted copy to that of the first pulse. The sum of the two responses is therefore equal to zero. For a nonlinear medium (e.g., microbubbles), the response will not be an exact inverted copy and the sum will therefore not be equal to zero. Different from harmonic imaging, which requires broadband transducers, pulse inversion can be implemented with a standard narrowband transducer. Pulse inversion is already effective at low insonating pressure (low mechanical index), which prolongs the half-life of the microbubbles and allows imaging with continuous transmission. Additional multi-pulse sequences for contrast-specific imaging are power modulation (PM) [6] and power-modulated pulse inversion (PMPI) [7], often referred to as contrast pulse sequencing (CPS). Similar to pulse inversion, CPS employs three low-power ultrasound pulses per image line with varied amplitudes and phases for transmission [7]. The received echoes from the contrast agent and the tissue are then separated using special processing algorithms. This sequence of pulses further suppresses the echoes from the tissue, thus allowing detection of small quantities of microbubbles.
Clinical Applications of CEUS in Interventional Urology
Contrast-enhanced ultrasound is a relatively new imaging technique that has found applications in several areas of interventional urology prior to treatment (diagnosis), after treatment (follow-up), and also during treatment (monitoring/guidance). The most frequent applications of CEUS are in the areas of prostate and renal disorders. Other, less frequent, applications are in the testis, the adrenal gland, and the bladder. Several procedures of utilizing the enhanced ultrasound signal from the contrast agents are in use. The first procedure is destruction-replenishment, a method during which all microbubbles within the ultrasound field are destroyed using acoustic pulses of high mechanical index. After destruction, the replenishment of the tissue with new microbubbles is monitored (Fig. 9.1a). This enables estimation of blood flow velocity and blood volume assuming a continuous infusion of microbubbles [8]. Another procedure is that of maximum intensity projection (MIP) imaging, a procedure in which the maximum intensity at each pixel is continuously mapped during perfusion of the tissue (see Fig. 9.1b). With this approach, each pixel value represents the maximum intensity at that pixel in the imaged area, which enables mapping the vessel trajectory. The third procedure consists of analyzing the intensity in a specific region of interest (ROI) as a function of time from the UCA wash in to the wash out; it is referred to as time intensity curve (TIC) analysis [9]. This technique enables assessment of blood volume and blood flow velocity in the investigated ROI [10]. A recently developed procedure uses these TICs to derive the dispersion of UCAs in the prostatic microvasculature [11], (Fig. 9.2). The dispersion kinetics is thought to reflect aspects of angiogenesis, such as microvessel density (MVD) and tortuosity of the microvessels. CEUS has shown to be a very attractive imaging technique and shows high potential in application prior to treatment, during treatment, and as follow-up after treatment in the field of interventional urology.
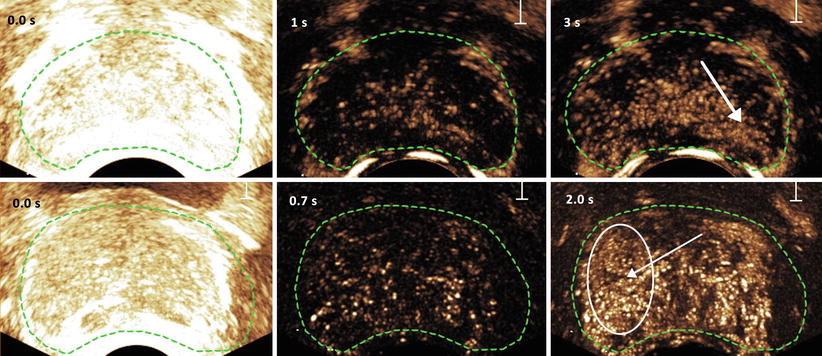

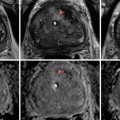
Fig. 9.1
Destruction and replenishment (top) and maximum intensity projection (bottom) imaging of microbubbles in the prostate. At 0 s all microbubbles present are destroyed by a strong acoustic pulse. The suspected areas (confirmed by histology) are indicated with an arrow in the right images
Fig. 9.2
Contrast-ultrasound dispersion imaging (CUDI) of the prostate based on coherence analysis of the TICs (a), dispersion-related time-intensity curve parameter κ (b), and coherence analysis (c). The corresponding histology slice of the excised prostate with carcinoma marked in red is shown in (d)
Prostate Diseases
Prostatitis, benign prostatic hyperplasia, and prostate cancer (PCa) are the three most common types of prostate diseases. In the area of prostate diseases, CEUS has been mainly applied in the diagnosis of PCa by transrectal ultrasound (TRUS). In 1997, Ragde et al. [12] proposed the combination of color Doppler sonography with the admission of a contrast agent (EchoGenTM) for improved imaging of the prostate circulation. They found a clear enhancement of the blood vessels in the prostate and suggested that this might lead to more accurate identification of malignant lesions. This was the first technique used to study the microvasculature of the prostate for cancer detection, and the initial findings were confirmed in various studies [13–15]. The technique made it possible to image the neovasculature (angiogenesis) that supplies the (growing) tumor. It opened the door toward early detection of the aggressive prostate carcinoma. In 2005, Halpern et al. [16] introduced the technique of harmonic imaging for enhancement of the blood flow in the prostate. This technique already showed potential in assessing tumors/metastasis in the human liver [17] and perfusion of the myocardium [18]. In the following years, harmonic imaging has shown its value in various studies [19, 20]. The dispersion kinetics of UCAs in the microvasculature is hypothesized to reflect the underlying vessel architecture and therefore highlight the changes related to cancer angiogenesis [11, 21, 22].
Following the detection of PCa, treatments such as radical prostatectomy, HIFU, and cryotherapy can be used. In the follow-up on the treatments, CEUS is a potential candidate for assessing the treatment effect [23]. CEUS has been applied as a noninvasive method to assess the anastomotic leakage after radical prostatectomy [24, 25]. Sedelaar et al. used CEUS to measure the volume of the affected tissue after HIFU treatment [26]. The latter study was based on the lack of perfusion in the tissue affected by HIFU treatment.
Renal Disorders
One of the first publications on the application of CEUS in the kidney is by Brown et al. [27]. They assessed the utility of an intravenous contrast agent for visualization of visceral perfusion before and after segmental infarction in a canine model and found that the use of a contrast agent improved the evaluation of visceral ischemia. Following this publication, CEUS has been applied in diagnosing renal disorders, such as the detection and characterization of renal masses/cysts [28–31], renal artery stenosis [32, 33], and renal trauma [34] (Fig. 9.3). CEUS has been applied as a guidance/monitoring tool during radiofrequency ablation procedures [35] and the placement of renal allografts [36]. CEUS has also been used in the follow-up of treatments such as radiofrequency ablation [37] and cryoablation [38] and assessing the function of renal allografts [39, 40] after transplantation. In the follow-up after treatment of renal masses and the assessment of the renal allografts, the results were based on perfusion of the renal microvasculature. In the cases of ablation, non-perfusion of the ablated area indicated a successful treatment, whereas in the allografts a successful transplantation was indicated by perfusion of the renal tissue.
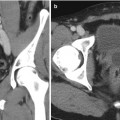
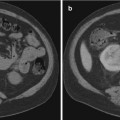
Fig. 9.3
(a) Contrast-enhanced US demonstrating hypervascularity of mass (white arrows) compared with normal renal cortex before cryotherapy. (b) Contrast-enhanced US at 2 weeks after cryoablation demonstrating lack of flow in the tumor (white arrows), consistent with successful cryoablation. The adjacent gray-scale images, however, are very similar (red arrow)
Other Disorders
Other areas of interventional urology where CEUS has been applied are noninvasive detection of bladder carcinoma [41] and differentiation between low- and high-grade bladder carcinoma [42], the assessment of testicular lesions [43], and assessment of female urethral vascularization [44] and diverticulum [45].
Performance of CEUS in Urologic Practice
The most common application of CEUS in urologic surgery is the detection of PCa. When the visualization of prostate adenocarcinoma improves, biopsy can be targeted more precisely with the goal of improving, if not replacing, random biopsy. The reported cancer detection rates of targeted CEUS biopsy ranged from 24.4 to 35 % [16, 46, 47]. Individual targeted CEUS cores were at least twice as likely cancer (OR = 2.0–3.1, p < 0.001) [16, 46, 47]. However, the cancer detection rates of targeted CEUS biopsy alone versus that of systematic sextant biopsy are not significantly different. CEUS alone missed 5–20 % of cancers that were diagnosed on standard sextant biopsy [16, 46, 47].
Several studies have shown that CEUS detects more and clinically significant cancers than standard biopsy. Mitterberger et al. evaluated systematic TRUS biopsy versus CEUS-targeted biopsy for the impact of Gleason grading [48]. They found that Gleason score detected by targeted CEUS cores was higher (mean Gleason score of 6.8) compared to those detected by standard biopsy (mean Gleason score of 5.4). Likewise, the targeted CEUS cores detected higher volume disease, involving ≥50 % core [15]. Roy et al. compared the diagnostic efficiency of CEUS for prostate cancer detection. They found that CEUS improves the sensitivity from 54 to 93 % without compromising the specificity of TRUS biopsy [15].
One significant drawback of CEUS is its poor discriminatory ability for PCa, ROC < 0.65, suggesting that CEUS imaging cannot adequately discriminate benign from malignant areas on prostate US [49]. Overall, even though targeted CEUS prostate biopsy improves the detection rate and diagnostic efficiency of PCa, it should only be used as an adjunct rather than replacement for standard systematic biopsy, even when abnormal vascularity targets are visualized in the prostate.
The renal application of CEUS in the differentiation of surgical versus nonsurgical cystic masses has also been investigated. Ascenti et al. compared the accuracy of CEUS with that of CT in the diagnosis of 31 patients with cystic renal masses. They found that CEUS and CT have similar accuracy (82 %) for diagnosis of malignant renal mass but CEUS is inferior to CT in the diagnosis of benign lesions, 75 % with CEUS and 100 % with CT [50]. Park et al. found CEUS upgraded the Bosniak classification in 26 % of cystic renal lesions [31]. CEUS was shown to be better in solid component in complex renal cysts than CT by providing better visualization of septa number and thickness.
Studies of CEUS in the diagnosis of cystic renal masses have revealed promising future possibilities for the technology. However, at this point, the accuracy of CT is still superior to that of CEUS because CEUS is operator dependent and influenced by lesion location. When there is a contraindication to iodinated contrast or gadolinium, due to renal insufficiency or allergy, CEUS of renal lesions can be helpful to better characterize complex renal masses on initial or follow-up sonographic evaluation.
Elastography
The term elastography has been coined by Ophir et al. in 1991 [51]. They described a new technique for quantitative imaging of stiffness in soft tissues. Elastography is based on the principle that soft tissue deforms more than hard tissue when a force is applied (stress). The change in size and shape (strain) of tissue as a result of the applied force yields an indication of the tissue elasticity. Elasticity of biological tissue is quantified in the Young’s Modulus E (defined as stress/strain) in units of Pascal (Pa). To measure the strain in the tissue, a registration is made before and after the application of stress. From comparison of the pre- and post-deformation registration, local tissue displacements are estimated and strains are derived from these displacements resulting in strain images or elastograms. Lesions in biological tissue can then be identified from elastograms as regions with different strain or stiffness values [52]. This paragraph describes the various techniques of elastographic imaging and their application in interventional urology. Finally, we discuss the performance of these techniques in current urologic practice.
Techniques of Elastographic Imaging
The first step in elastographic imaging is deformation of the tissue by applying a stress to the tissue, either the result of a physiological force (e.g., the contraction of the cardiac muscle), an external applied force (e.g., the ultrasound probe pressing on the tissue), or an acoustic force (acoustic radiation force imaging: ARFI). The second step is estimating the tissue deformation resulting from the applied force. This can be done using ultrasound (US) or magnetic resonance imaging (MRI) and is generally referred to as deformation/strain imaging. When the applied stress is known and the resulting strain in the tissue is estimated, the Young’s modulus of the tissue can be derived: elastographic imaging.
Physiological Deformation
One approach to deforming tissue is that of physiological processes that lead to deformation. An example is that of contraction of the cardiac muscle during the heart cycle. Using US imaging the resulting deformations and strain in the muscle can be estimated. Part of the cardiac muscle that is necrotic because they have been deprived from oxygen for a longer period of time (prolonged ischemia) will be hypokinetic (not contracting), showing poor or no strain. Since the stress applied by the physiological processes is generally not known, we need to rely on strain imaging to assess defects/dysfunction.
(Freehand) Quasi-Static Elastography
With the quasi-static displacement approach, an external force is applied to the tissue, e.g., by the transducer. This can be performed mechanically or manually (freehand). The force is applied for a certain amount of time to ensure that the tissue has reached a new quasi-static state. Displacements of the tissue between this new stabilized state and the previous (original) state are then estimated from the acquired ultrasound images (Fig. 9.4). In general, strain is estimated in the axial direction (along the ultrasound beam). In this direction, the strain estimation is more accurate and robust than in the lateral and elevational direction (both orthogonal to the ultrasound beam). Quasi-static elastography techniques have been implemented by a number of manufacturers such as General Electric (USA), Hitachi (Japan), Philips (The Netherlands), Siemens (Germany), and Toshiba (Japan) and have become commercially available on ultrasound systems in the clinical areas of breast, prostate, and thyroid imaging.
Fig. 9.4
Quasi-static transrectal ultrasound elastography of the prostate. The gray-scale TRUS image is shown in (a) and the corresponding elastogram in (b) with blue representing stiff tissue and red soft tissue. The suspected area is indicated on the gray-scale TRUS image and on the elastogram by white arrows. The suspected area was confirmed by biopsy as cancerous region (Gleason’s score 3 + 4)
Acoustic Radiation Force Impulse (ARFI) Imaging
Acoustic radiation force impulse (ARFI) imaging is a third approach to elastographic imaging. With this technique, short-duration acoustic radiation forces (pushing pulses) are used to induce very local deformation of tissue and the recoil of the tissue is observed with ultrasound (tracking pulses) [53]. An ARFI imaging sequence usually consists of the transmission of one or more pushing pulses to deform the tissue, which is followed by a sequence of tracking pulses. Windowed cross-correlation of these tracking pulses is then used to estimate the displacements in the tissue. This process is repeated at different positions in the tissue to construct a spatial displacement map. This approach distinguishes itself by the highly localized forcing functions and displacement profiles. A disadvantage of ARFI, however, is heating of the tissue as a consequence of the pushing pulses, which places a limit on the resulting displacements [54]. This technique has been implemented clinically by Siemens (Germany) in the form of “Virtual Touch® Tissue Imaging” and “Virtual Touch Tissue Quantification.”
Vibro-Acoustography
Vibro-acoustography is a variant of acoustic radiation force imaging. The foci of two pushing pulses are placed in such a way that the ultrasound beams coincide at a crossover point within the tissue (Fig. 9.5). The two beams have slightly different frequencies (typically 25 kHz) to make the tissue in the focal region fluctuate at this beat frequency. The surrounding tissue in one beam or the other will however not fluctuate. The amplitude of the fluctuation depends on the local stiffness. With an external hydrophone, the acoustic emission at the beat frequency can be detected and used to create a spatial stiffness map when the focal point is moved in a two-dimensional plane. Vibro-acoustography is very sensitive and can measure displacements as small as a few nanometers, whereas other techniques require displacements in the order of micrometers. This technique is implemented on a GE Vivid 7 system [56].
Fig. 9.5
Schematic illustration of the principle of vibro-acoustography (a) and a gray-scale vibro-acoustographic (VA) image of the axial section of an excised prostate (b). The VA image clearly shows the prostate anatomy, including the urethra (arrow) and a malignant lesion with bright and coarse texture in the peripheral zone (dashed circle). (b) The colored VA image and the selected ROI for classification process. (c) The selected ROI after threshold-based processing and boundary removal that identifies the lesion (From Alizad et al. [55], with permission)
Transient Elastography
Transient elastography utilizes a low-frequency short-pulsed excitation to excite the tissue of interest [57]. The mechanical stimulation causes the propagation of a low-frequency shear wave in the tissue with a velocity related to the tissue stiffness. The velocity at which the shear wave travels through tissue can be measured using an ultrasound pulse-echo mode. A spatial stiffness map can then be derived from the estimated propagation speed of the shear wave (Fig. 9.6). A current commercially available implementation of transient elastography is the Fibroscan® system produced by Echosens (France). The Fibroscan® is originally designed for use in the assessment of liver fibrosis by quantifying liver stiffness.
Shear Wave Elastography
Shear wave elastography (SWE) is a technique that does not require compression of the prostatic tissue as with quasi-static elastography. Quasi-plane shear waves are created by successfully focusing a pushing beam at different depths (Fig. 9.7). The resulting shear waves at each depth constructively create two quasi-planar shear waves that propagate in opposite directions. The propagation of these shear waves is then imaged at high frame rates in the order of kilohertz. The propagation speed of the shear waves are related to the local elastic properties. With shear wave elastography quantitative elasticity (expressed by the Young’s modulus), maps of the tissue can be constructed in a few milliseconds. A major advantage of SWE is in that no pressure needs to be applied by the operator for inducing deformation of the tissue. This technique, however, requires an ultrasound scanner that can achieve high frame rates. This technique has been implemented by Supersonic Imagine (France) in their Aixplorer 3D UltraFast® ultrasound system.