A coronary stenosis may be observed during cardiovascular magnetic resonance (CMR) as an area of signal loss caused by turbulent flow, and although both the degree and the extent of signal loss are indicative of the severity of the stenosis, accurate quantification is not possible. However, both phasic coronary artery blood flow and flow velocity may be affected by the presence of stenosis, and the ratio of coronary artery flow under maximal vasodilation to coronary artery flow at rest (coronary flow reserve) is a good indicator of the physiologic significance to the myocardium. This makes the measurement of coronary flow and velocity valuable. Measurements of instantaneous and mean coronary flow parameters are most commonly made using an intracoronary Doppler flow wire, positioned in the arterial lumen during x-ray contrast angiography. However, this is an invasive procedure, with a small but definite risk of complications, and the radiation dose to the patient is relatively high for a diagnostic test. The repeated use of such a technique to monitor disease progression or regression in response to drug therapy or lifestyle changes is therefore not acceptable. In addition, the presence of the Doppler wire may itself affect flow, as may the stress to the patient resulting from the invasive nature of the procedure. Other techniques capable of assessing mean flow parameters include continuous thermodilution and positron emission tomography (PET), the former also requiring placement under x-ray contrast angiography, with the concomitant disadvantages, and the latter being relatively unavailable and expensive.
CMR has the ability to quantify blood flow noninvasively and has the potential to be a useful noninvasive alternative to the intracoronary technique. Since the 1980s, it has been used extensively for the assessment of phasic blood flow velocity and flow in a wide range of cardiovascular applications, and it has the potential to be implemented in coronary flow studies. One of the main problems relating specifically to applying the technique to the coronary arteries is their small size (typically <5 mm in diameter), which, for current levels of in-plane resolution, results in only a few pixels across the vessel. This has implications for the accurate measurement of both vessel cross-sectional area and blood flow velocity. Vessel tortuosity is a further problem, giving rise to difficulties in accurately aligning the vessel so that flow is truly through-plane or in-plane, as required. This is exacerbated by the movement of the arteries with the cardiac and respiratory cycles. In addition, the temporal resolution of the velocity encoding sequence must be sufficiently good to minimize the blurring of the vessel as a result of motion within the period of acquisition and to resolve the phasic velocity profile. The low peak flow velocities in normal arteries at rest (typically <25 cm/s) present a further challenge and require highly sensitive velocity windows, whereas in the presence of stenoses, high velocities are present, together with complex flow, which may lead to signal loss. The combination of these problems is formidable, and it was only in the last 10 to 15 years that CMR techniques started to generate results. This chapter reviews the progress made to date and discusses potential future improvements.
Indirect Assessment of Total Coronary Flow and Flow Reserve
Two indirect approaches for assessing total coronary flow and flow reserve by CMR have been reported, the first from velocity mapping of cardiac venous outflow and the second from velocity mapping in the aortic root.
Coronary Sinus Flow
Velocity mapping of coronary venous outflow is less problematic than velocity mapping in the coronary arteries because the coronary sinus has a much larger diameter (typically 7–10 mm), and also because effects of signal loss are unlikely because flow is less susceptible to turbulence. In the human heart, coronary sinus flow almost equals total coronary flow because approximately 96% of left ventricular (LV) venous blood flow drains into the right atrium via the coronary sinus. van Rossum and colleagues were the first to show that blood flow in the coronary sinus could be measured using CMR. This feasibility study assessed the ability of cine CMR velocity mapping to measure phasic and mean coronary venous outflow in the distal coronary sinus of 24 healthy subjects. The flow profiles were generally biphasic and primarily diastolic, with 37% of subjects showing some reverse flow immediately after the R-wave. The mean volumetric flow over the cardiac cycle was 144 ± 62 mL/min, similar to values reported in normal subjects using continuous thermodilution (122 mL/min). Although phasic blood flow in the sinus may have been expected to be predominantly systolic, as in other venous structures, the authors suggested that the thin, compliant walls of the sinus, together with its drainage into the right atrium, where pressure varies considerably, may be responsible for the predominantly diastolic flow profile. These findings have been supported by other independent studies, both directly, using an ultrasonic transit time technique to measure phasic volumetric coronary sinus flow in conscious dogs, and indirectly, by observing areas of signal void, caused by accelerating and turbulent flow near the entrance of the coronary sinus in the right atrium in early diastole, in conventional cine CMR in healthy subjects.
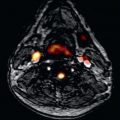
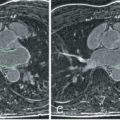
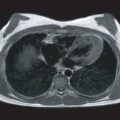
Fig. 25.1 shows the typical image plane orientation for coronary sinus flow measurements together with a typical coronary sinus flow curve.

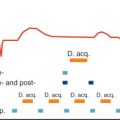
The imaging time for the feasibility study was typically 4 minutes, and this may be inappropriate when assessing sinus flow under pharmacologically induced maximal vasodilation. Kawada and associates assessed the possibility of using a segmented k -space gradient echo CMR approach to the acquisition so that all data could be acquired in <25 seconds. This had the further advantage that the full acquisition could be performed in a single breath-hold, thereby eliminating the effects of respiratory motion. In a study of 9 healthy subjects and 29 patients with hypertrophic cardiomyopathy (HCM), data were acquired from an oblique coronal plane. Four reference and four velocity encoded views were acquired per data segment, giving a segment duration of 120 ms, but the temporal resolution was effectively improved by view sharing, a technique whereby data are generated at intermediate time points from the preceding and following data segments. Hence, depending on the RR interval, velocity maps were obtained at up to 14 phases in the cardiac cycle. The authors observed the same biphasic velocity and flow profiles in both healthy subjects and patients with HCM, with no significant difference noted between the baseline myocardial blood flow (coronary blood flow per unit mass of myocardium) in the two groups (0.74 mL/min per gram vs. 0.62 mL/min per gram). However, after intravenous administration of 0.56 mg/kg dipyridamole, the increase in myocardial blood flow in patients with HCM (0.62 mL/min per gram to 1.03 mL/min per gram) was less than that in the healthy subjects (0.74 to 2.14 mL/min per gram), resulting in significantly different coronary flow reserves for the two groups (1.72 ± 0.49 vs. 3.01 ± 0.75, respectively, P < .01). The authors concluded that, in healthy subjects, myocardial blood flow and coronary flow reserve, as measured by breath-hold phase velocity mapping, were similar to those found by other techniques; in addition, the CMR technique was able to distinguish between healthy subjects and patients with HCM. A more recent study in young HCM patients (22.3 ± 6.4 years) and age-matched subjects at risk of HCM has similarly shown that HCM patients (but not subjects at risk of HCM) have reduced myocardial blood flow response to adenosine-induced hyperemia, even in the absence of diastolic dysfunction or left ventricular outflow tract obstruction. The breath-hold approach has also been used by Kennedy and colleagues to show significant differences in the coronary flow reserve of healthy subjects (4.59 ± 0.58) and heart transplant patients with mild (2.15 ± 0.44, P < .05) and severe (2.21 ± 0.59, P < .05) coronary disease, as determined by posttransplant coronary angiography. It has also been used to show reduced coronary flow reserve in patients with high serum eicosapentaenoic acid (EPA) compared with those with low EPA, and in those with heart failure with preserved ejection fraction compared with those with hypertensive left ventricular hypertrophy and controls. At 3 T, the increased signal-to-noise ratio (SNR) available generally allows imaging of coronary sinus flow with higher spatial resolution or, particularly when used in combination with parallel imaging techniques, reduced breath-hold duration. Imaging at 3 T has been used to determine the feasibility of flow reserve quantification using regadenoson, a relatively new selective adenosine A2A receptor agonist and to investigate the role of aminophylline reversal. It has also been used to show reduced coronary flow reserve in patients with surgically repaired tetralogy of Fallot, compared with healthy volunteers (1.19 ± 0.34 vs. 2.00 ± 0.43, P = .002) and in two similar studies (one at 1.5 T and one at 3 T) to show that, whereas smokers and nonsmokers have similar baseline myocardial blood flows, smokers have a significantly reduced response to cold pressor testing ( Fig. 25.2 ). A spiral k -space coverage phase velocity mapping sequence at 3 T has allowed the acquisition of data with a spatial resolution of 0.8 mm × 0.8 mm in an 11 to 15 s breath-hold with a temporal resolution of 60 to 69 ms and has been used to show myocardial blood flow increases in response to cold pressor testing in asymptomatic women. A validation of the breath-hold approach was reported by Koskenvuo and associates, who compared myocardial blood flow measured by CMR with that measured by PET in both healthy subjects and patients with coronary artery disease (CAD). Good correlations were reported for myocardial blood flow in both subject groups (0.82 and 0.80, respectively), whereas for coronary flow reserve, the correlations were 0.76 and 0.5, respectively.

One issue with the breath-hold approach to measuring coronary sinus flow is that breath-holding changes intrathoracic pressure and affects cardiac output and venous blood flow. Schwitter and coworkers performed a validation of nonbreath-hold velocity mapping against PET. Although taking longer to acquire (typically 4 minutes), the nonbreath-hold technique has the advantages of higher spatial resolution (0.8 × 0.8 mm) and improved SNR through the acquisition of multiple averages. Furthermore, the high temporal resolution that is achievable is better suited for resolving the highly pulsatile flow profile and for minimizing the blurring effects of the extensive in-plane motion of the coronary sinus during the cardiac cycle. Unlike the initial study of van Rossum and coworkers, this free breathing study used retrospective electrocardiogram (ECG) gating, which enables data acquisition throughout the entire cardiac cycle, and respiratory ordered phase encoding, which reduces the effects of respiratory motion. Scans were performed both before and after the administration of 0.56 mg/kg dipyridamole in 16 healthy subjects and 10 orthotopic heart transplant recipients and the results were compared with PET data. The mean difference between coronary flow reserve measured by PET and CMR was 2.2%, with limits of agreement of −27.2% and 31.6%. Correlation between CMR-measured myocardial blood flow (coronary sinus flow divided by myocardial mass) and PET was good ( r = 0.93), although the slope was considerably less than unity (0.73). This underestimation of blood flow measured by CMR results from the fact that a variable part of the inferior and inferior-septal myocardium is drained by the middle cardiac vein, which either enters the coronary sinus just before its orifice or empties directly into the right atrium. If coronary sinus flow is divided instead by the mass of drained myocardium (as measured from a stack of short axis images), the correlation remains good ( r = 0.95), whereas the slope approaches unity (1.05). Fig. 25.3 shows a regression plot of myocardial blood flow (sinus blood flow per unit mass of drained myocardium) measured by CMR and PET, with baseline flows normalized for rate-pressure product, together with a Bland-Altman plot. The mean differences between PET and CMR were 3.4% ± 12.8% at resting baseline and 3.9% ± 20.2% during hyperemia and were not significant. The authors have subsequently used this technique to show that administration of 17β-estradiol over 3 months without progestin coadministration does not improve coronary flow reserve in postmenopausal women. A similar nonbreath-hold technique was used by Moro and colleagues at 3 T to show that women have a higher increase in myocardial blood flow in response to cold pressor testing than men (0.73 ± 0.43 mL/g per minute vs. 0.22 ± 0.19 mL/g per minute, P = .0012).


A validation of nonbreath-hold CMR-measured coronary sinus flow has also been performed against flow probes in dogs by Lund and associates. In this study, the correlation between coronary blood flow (measured as the sum of left anterior descending [LAD] and circumflex [LCX] coronary flow) with flow probes against coronary sinus flow measured with CMR was 0.98, with a nonsignificant mean difference of 3.1 ± 8.5 mL/min. Coronary sinus blood flow per unit mass of myocardium was 0.40 ± 0.09 mL/min per gram (CMR) compared with 0.44 ± 0.08 mL/min per gram (flow probes) and also was not significant. The authors went on to study patients with chronic heart failure and showed that coronary flow reserve was significantly reduced compared with that in healthy subjects (2.3 ± 0.9 vs. 4.2 ± 1.5, P = .01). This has been recently confirmed by Aras and colleagues (coronary flow reserve 1.45 vs. 3 in patients with chronic heart failure and healthy subjects, respectively, P < .001). Similarly, Watzinger and coworkers have shown significantly reduced flow reserve in patients with idiopathic cardiomyopathy compared with healthy subjects (2.19 ± 0.77 vs. 3.51 ± 1.29, P < .05). In all three studies, there were no significant differences in baseline flow between healthy subjects and those with disease (0.52 mL/min per gram vs. 0.46 mL/min per gram, P = not significant [NS]; 0.83 ± 0.26 mL/min per gram vs. 0.85 ± 0.30 mL/min per gram, P = NS; and 0.55 ± 0.19 mL/min per gram vs. 0.48 ± 0.07 mL/min per gram, P = NS).
These studies provide useful results, but have a number of important limitations. Cardiac and respiratory motion results in blurring of the sinus, and the small number of pixels covering the sinus (typically five across the diameter in diastole) results in considerable partial volume averaging in edge pixels, which is problematic for the accurate assessment of sinus cross-sectional area and for the determination of mean sinus flow velocity. As discussed, drainage of a variable part of the inferior and inferior-septal myocardium by the middle cardiac vein results in underestimates of myocardial blood flow measured, and although this estimate is an indicator of total coronary blood flow, no regional assessment of either flow or flow reserve is possible with this technique.
Total Coronary Flow Reserve From Measurements in the Aortic Root
In 1993, it was proposed that coronary flow reserve might be derived from flow measurements made in the ascending aorta, which is less susceptible to cardiac and respiratory motion and partial volume effects than the coronary arteries. Coronary diastolic flow, which represents the bulk of coronary flow, can be estimated as the retrograde flow in the ascending aorta during systole and diastole minus the antegrade flow during diastole. A variable velocity encoding window was implemented to maintain the accuracy of velocity measurements during periods of both high flow in systole (window = 200 cm/s) and low flow in diastole (window = 30 cm/s). Although it was suggested that the assessment of absolute diastolic coronary flow with this technique is inaccurate because of known errors associated with the velocity mapping technique, it was argued that these errors should be the same both pre-vasodilation and postvasodilation and therefore should be eliminated from the assessment of diastolic coronary flow reserve, defined in this instance as the difference (rather than the ratio) between the two measurements. In seven patients with abnormal findings on myocardial perfusion scintigraphy, the diastolic coronary flow reserve was −50 ± 76 mL/min compared with 260 ± 66 mL/min in eight healthy subjects. The principle of this technique was later refined by taking into account the motion of the coronary arteries during the cardiac cycle. A model was developed describing the flow through five transverse parallel aortic slices extending from the base of the aortic valve to above the level of the coronary ostia. This was then solved mathematically, and in five healthy subjects, it was shown that the standard error in the measurement of total coronary artery flow was approximately 90 mL/min, or 30% of total coronary artery flow. The error in coronary flow reserve is higher because the errors in baseline and maximal vasodilation flow are additive. In addition, the assumption that flow is predominantly diastolic, although true in healthy subjects, may not hold in the presence of disease, introducing further unknown errors into the technique. A more recent attempt at measuring coronary artery blood flow in this way likewise found that the technique was compromised by poor reproducibility, although significant changes in coronary blood flow with hormone replacement therapy were observed.
Direct Assessment of Coronary Artery Velocity
The problems associated with the assessment of flow velocity and coronary artery flow were discussed earlier and preclude the application of standard CMR techniques. As for coronary imaging, the major breakthrough for coronary flow techniques was the shortening of sequence duration to the extent that data could be acquired over a single breath-hold, effectively freezing respiratory motion and eliminating the resulting artifact. Further advances with navigator echo monitoring of the diaphragm position have allowed data to be acquired over multiple reproducible breath-holds or during free breathing, enabling increased spatial and temporal resolution and data averaging (resulting in higher SNRs). The following sections describe the approaches used to assess coronary flow velocity and flow.
Bolus Tagging
The first report detailing the imaging of coronary artery flow was made in 1991 in rat and mice hearts with bolus tracking. With this technique, based on one previously implemented in vivo in the aorta and the carotid arteries, a section of blood above the coronary ostia on the aortic root is tagged by the application of a slice-selective presaturation radiofrequency pulse, and imaging is performed after a delay. During this delay period, the tagged volume of blood washes into the coronary artery tree, where it is seen as a signal void. The mean velocity of the tagged blood can be calculated from the degree of tag movement and the wash-in delay time. The technique has also been developed for multibolus tracking using stimulated echoes, and its application was demonstrated in a 3-mm diameter tube with laminar flow and in an isovolumetric perfused rat heart. Using this approach, an image of multiple boluses (typically three), each with a different wash-in time, can be obtained simultaneously to show the coronary artery tree. Again, the extent of the arterial pathway seen depends on the flow velocities in the tagged volumes and on the wash-in delay times, with short delays required for visualization of the proximal portions and longer delays for the mid- and distal portions. By tracking multiple boluses simultaneously in this way, this technique essentially results in images of blood flow.
Echo Planar Time-of-Flight Technique
Echo planar techniques are an attractive option for coronary artery investigations because of their fast imaging times, which reduce the effects of both cardiac and respiratory motion. In 1993, the first report detailing the use of an echo planar single-shot time-of-flight technique for assessing coronary artery flow velocity in 11 healthy subjects was reported. In this study, short axis cardiac slices were acquired with an in-plane pixel size of 1.5 × 3 mm, each taking approximately 95 ms. Before the 90-degree slice selection radio frequency pulse, another 90-degree pulse was applied to saturate a thick band centered on the imaging slice. If increasing time delays are programmed between the saturation and slice select pulses, the signal intensity in the vessel changes as a result of blood wash-in through the slice. The rate at which it changes can be used to calculate the blood velocity at the time of imaging. The average velocity profile for the study group of 11 subjects is shown in Fig. 25.4 and illustrates the expected peak flow in early diastole. Using this technique, a separate breath-hold was required for velocity assessment at each time point in the cardiac cycle and it was not possible to image at time points of <200 ms from the R-wave because this time period is required for the application of saturation delays. This was not considered a problem for normal subjects because left coronary flow is predominantly diastolic. A further restriction of the technique is that the long echo time of the sequence (echo time [TE] 28 ms) may lead to signal loss at sites of turbulent flow. At such sites, there may also be a breakdown in the assumption of laminar flow required for the velocity calculations from the wash-in data. The authors reported that in nine subjects who were imaged during continuous hand and lower extremity exercise, eight showed an increase in diastolic velocity (increase over exercise period = 52 ± 24%). Isometric exercise does not produce a maximal physiologic stress response, and more recently, echo planar time-of-flight coronary flow velocity reserve has been measured using this technique in healthy subjects ( N = 10) after the infusion of 0.56 mg/kg dipyridamole. In these subjects, peak diastolic velocity was observed to increase from 22 ± 7 cm/s to 90 ± 40 cm/s, resulting in a coronary flow velocity reserve of 3.9 ± 1.5, with velocity returning to baseline (23 ± 5 cm/s) after the administration of aminophylline.

In this study, the authors acquired low-resolution, single-shot coronary images rather than using a segmented approach to build up higher-resolution images over a number of cardiac cycles. This was prompted by their observation of considerable variability in the beat-to-beat position of the LAD during both long and short breath-hold periods. This usually corresponded to a downward drift in vessel position as the breath-hold continued and could be as much as 6 mm (i.e., greater than the vessel diameter). It was unclear, however, how much of this movement was caused by poor breath-holding and how much was the result of beat-to-beat variations in cardiac contraction. Regardless of the cause, it would introduce blurring, which is largely avoided in a single-shot image. Beat-to-beat variations in flow, as opposed to spatial position, still have an effect on measured velocity because individual images must be acquired with different saturation delays in consecutive cardiac cycles to generate the wash-in curve. Therefore measured velocity is affected by changes over the breath-hold period. The importance of this study lies in its pioneering and largely successful approach to a previously unsolved problem. It has largely been superseded by phase velocity mapping approaches, as discussed later, which are more robust and have higher availability.
Gradient Echo Phase Velocity Mapping
Breath-Hold Techniques
Using a velocity encoded segmented k -space gradient echo technique, velocity maps may be acquired in a single breath-hold, thereby eliminating respiratory motion artifact. To accomplish this, the segment duration is typically on the order of 100 ms, and to minimize blurring as a result of cardiac motion, the acquisition is best performed in mid diastole, when the heart is relatively stationary. In addition to limiting the temporal resolution of the sequence, the need to perform data acquisition within a single breath-hold also limits the number of phase encoding steps that can be acquired, which in turn limits the spatial resolution and the SNR in the resulting images.
The first diastolic through-plane coronary artery phase velocity maps were reported by Edelman and coworkers in 1993. These were acquired at 1.5 T using a fat-suppressed sequence consisting of a reference velocity compensated gradient waveform followed by a sensitized (velocity window = 150 cm/s) gradient waveform, each repeated four times in a cardiac cycle. TE was 8 ms and repetition time (TR) was 15 ms, resulting in a segment duration of 120 ms. The sequence was validated against a Doppler flow meter in vitro using both constant and mildly pulsatile flow in an 8-mm diameter tube and in vivo against a standard nonsegmented velocity mapping sequence in the descending aorta of three healthy volunteers. Velocity maps were acquired over 24 cardiac cycles with in-plane pixel dimensions of 1.4 × 0.8 mm. In healthy subjects, mean flow velocities at rest in the mid portion of the right and left anterior descending coronary arteries were 9.9 cm/s and 20.5 cm/s, respectively. These values are lower than those found in Doppler flow studies, a finding that is to be expected because the small number of pixels across the vessel results in partial volume averaging of the velocity profile. In four subjects who received intravenous administration of adenosine, velocities increased by at least a factor of four, suggesting that CMR has the potential to assess the hemodynamic significance of a stenosis by measuring the flow response to vasodilation.
Another approach to quantifying the severity of stenosis is to perform in-plane coronary artery velocity mapping with a view to measuring increased velocity at the site of lumen narrowing. In-plane coronary artery velocity mapping was first performed in healthy volunteers by Keegan and associates, using a sequence with TE of 10 ms, TR of 20 ms, and segment duration of 160 ms, which effectively limited acquisitions to the period of relative cardiac diastasis in early diastole. The in-plane resolution was 1.6 × 0.8 mm, and data were acquired over breath-holds of 24 to 32 cardiac cycles. The velocity sensitivity used was 50 cm/s and was achieved by phase map subtraction of two images, one sensitized so that flow velocities of 100 cm/s gave a phase shift of +2pi radians and the other sensitized so that flow velocities of 100 cm/s gave a phase shift of −2pi radians. This was shown to result in fewer blood flow artifacts than subtracting an image sensitized to flow velocities of 50 cm/s from a reference nonsensitized image. Through-plane and in-plane velocities measured with this technique were validated in vitro against a standard nonsegmented velocity mapping sequence in a 5.6 mm diameter tube with pulsatile flow having a maximum velocity of 30 cm/s and a maximum rate of change of velocity of 126 cm/s 2 , comparable with the values expected in normal human coronary arteries at rest. Phantom work was also carried out to show the ability of the technique to measure a velocity increase at the sites of mild, moderate, and severe area-reducing stenoses and hence to quantify severity. However, although velocity increases at the sites of area-reducing stenoses have been observed with this approach, the tortuous pathways and small caliber of the coronary vessels result in partial-volume-type effects being more problematic for in-plane than for through-plane velocity mapping. Furthermore, in-plane studies require a high degree of reproducibility in the breath-holding position, which is difficult to achieve without techniques such as navigator echo monitoring.
Navigator Techniques
The studies discussed earlier used breath-holding as a means of respiratory motion control, limiting the sequence parameters to allow the entire dataset to be acquired within the duration of a single breath-hold and requiring a high degree of patient cooperation, which is not always forthcoming. In addition, intervariations and intravariations in the breath-hold position may be problematic, and hemodynamic changes occurring secondary to breath-holding, such as increases in intrathoracic pressure and heart rate, may themselves alter the blood flow being measured. A navigator echo approach under either prospective or retrospective control would enable data to be acquired during free breathing and would avoid these problems. Furthermore, temporal resolution of the sequence could be improved by reducing the segment duration, albeit at the expense of prolonged scan time.
The influence of temporal resolution was studied by Hofman and colleagues, who compared the use of a segmented breath-hold technique (segment duration of 126 ms) with a retrospective respiratory gated technique (reference and velocity sensitized view pair duration of 32 ms) for the assessment of flow velocity, vessel cross-sectional area, and volume flow in the right coronary arteries of six healthy subjects. Eight data averages were acquired, and the data were reconstructed with retrospective gating. The residual displacement of diaphragm positions in the reconstructed data was 3.9 mm. In-plane spatial resolution was 0.8 × 1.6 mm, and velocity sensitivity was ±25 cm/s. Vessel regions of interest were obtained semiautomatically from the magnitude images of the velocity compensated dataset by means of a seed growing algorithm and a 50% threshold. Velocity profiles generated from the retrospectively gated data for all six subjects (uncorrected for through-plane velocity of the vessel itself) are shown in Fig. 25.5A and show a sharp peak in systole, a minimum at end-systole, and a second peak in early diastole. The in-plane displacements of the vessels are shown in Fig. 25.5B and typically show peaks in systole and early diastole, with minimal displacement in mid to end-diastole. The authors have since reported a similar pattern of movement for the LAD. During times of peak vessel displacement, motion blurring of the artery occurs and the breath-hold segmented images are consequently of poorer quality than those acquired with the retrospective respiratory gated short segment duration sequence ( Fig. 25.6B ). In diastole, however, when in-plane displacement of the vessel is low, the two techniques generate images of comparable quality (see Fig. 25.6A ). This results in the breath-hold segmented k -space gradient echo sequence overestimating the instantaneous vessel cross-sectional area by as much as a factor of four, with an average increase in the time-averaged cross-sectional area of 90%. Based on this work, the authors suggest that, for acceptable levels of blurring throughout the cardiac cycle, the acquisition window for studies of the left and right coronary arteries (RCAs) should be <90 ms and <25 ms, respectively. This is similar to the values derived by Marcus and coworkers, who suggested an acquisition window of <58 ms and <23 ms for the left and right arteries, respectively.


A comparison between segmented k -space gradient echo phase velocity mapping and Doppler flow wire techniques has been performed in 26 angiographically normal coronary artery segments. Both breath-holding and real-time slice-followed navigator echo controlled free breathing CMR techniques (temporal resolution of 140 ms and 46 ms, respectively) were performed within 24 hours of the invasive procedure and the maximal coronary flow velocities in a 2 × 2 mm pixel region of interest determined. Both CMR techniques were found to significantly underestimate flow velocity, although the correlations with invasive measurements were strong ( r = 0.70 and r = 0.86, respectively). The navigator echo controlled technique was significantly more accurate than the breath-hold technique ( P < .02), although this was at the expense of prolonged acquisition time. The underestimation of blood flow velocity by both techniques is largely caused by partial volume averaging of the spatial flow profile in the CMR studies, together with insufficient sampling of the temporal flow profile. The decreased accuracy of the breath-hold technique compared with the navigator echo-free breathing technique is likely to be caused by a combination of the longer acquisition window of the former, together with hemodynamic changes resulting from the breath-holding procedure itself. Fig. 25.7 shows an example of the results obtained. Although still underestimating flow velocities, the significantly improved accuracy of the navigator echo-free breathing technique compared with the breath-hold technique provides a further step toward CMR assessment of coronary flow parameters, albeit at the expense of prolonged acquisition times. A navigator gated phase velocity mapping sequence has also been developed at 3 T and validated in a realistic flow phantom (4 mm diameter, mean flow velocity 15–20 cm/s) with simulated respiratory motion. Using this technique, measured velocities were within 15% of actual velocities in vitro and subsequent in vivo studies in 9 healthy volunteers resulted in time-averaged flow velocities of 6.8 ± 4.3 cm/s in the left anterior descending artery, 8.0 ± 3.8 cm/s in the left circumflex artery and 6.0 ± 1.0 cm/s in the right coronary artery.

Related posts:
 Use of Navigator Echoes in Cardiovascular Magnetic Resonance and Factors Affecting Their Implementation
 Clinical Cardiovascular Magnetic Resonance Imaging Techniques
 Atherosclerotic Plaque Imaging: Aorta and Carotid
 Cardiac Iron Loading and Myocardial T2*
 Pulmonary Vein and Left Atrial Imaging
 Noncardiac Pathology
Stay updated, free articles. Join our Telegram channel

Full access? Get Clinical Tree


