Fig. 14.1
Different types of atherosclerotic plaque. The leftmost image in Panel is a three-dimensional drawing of a normal vessel. The accumulation of macrophages and lipids can lead to large lipid cores and thin fibrous caps (further images in Panel A) and finally the rupture of the plaque cap and luminal clot formation (rightmost image in Panel A). The first image in Panel B show erosion-prone plaque with proteoglycan matrix in a smooth muscle cell-rich lesion. This can lead to plaque erosion and subocclusive thrombus formation (second image in Panel B). Intraplaque hemorrhage secondary to leaking vasa vasorum is shown in the plaque in the middle image in Panel B. The aforementioned plaque will be noncalcified on CT. Calcified nodules that only protrude into the lumen in the beginning can grow and become chronically stenotic plaques with severe calcification and old thrombus, resulting in an eccentric lumen (last two images in Panel B) (Adapted from Naghavi et al. Circulation 2003)
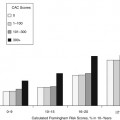
There are extensive evidence-based data in support of calcium scoring, in particular in asymptomatic, intermediate-risk populations, documenting that the amount of calcium predicts the risk of future events (Chap. 11).
The identification of noncalcified plaque and the assessment of the overall plaque burden are more complex and require outlining the lumen with contrast. Preclinical CT plaque imaging of ex-vivo arteries after static filling or perfusion of the lumen with contrast medium and in-vivo imaging of animal models with subsequent histologic verification have been performed for validation of plaque imaging. Plaque imaging using standard clinical contrast-enhanced CT protocols has been validated against IVUS. These studies have demonstrated reliable identification of calcified and noncalcified plaque (Table 14.1).
Table 14.1
Accuracy of plaque detection with CT in comparison to IVUS
Study | Scanner type | N | Sensitivity (%) | Specificity (%) |
|---|---|---|---|---|
Achenbach et al. Circulation 2004 | 16-row | 22 | 94 | 86 |
Leber et al. JACC 2004 | 16-row | 58 | 85 | 92 |
Leber et al. JACC 2006 | 64-row | 20 | 92 | 94 |
Sun et al. AJR 2008 | 64-row | 26 | 96 | 90 |
Petranovic et al. JCCT 2009 | 64-row | 11 | 96 | 89 |
14.2.2 Plaque Characterization
Characterization of plaque components based on tissue attenuation in Hounsfield units (HU) allows differentiation into broad groups of noncalcified, mixed, and calcified plaque types (Figs. 14.2, 14.3, 14.4, and 14.5). Comparison of the plaque types differentiated by CT with IVUS plaque characterization has revealed a correlation between IVUS echodensity and HU values, but significant overlap of attenuation values between the different noncalcified plaque types, in particular between lipid-rich and fibrous plaque components (Table 14.2). In addition, CT studies demonstrate that the attenuation of plaques is influenced by contrast density in the lumen and by contrast enhancement of the vessel wall itself. Furthermore, the visualization of relatively small HU differences between different plaque components is probably affected by the imaging technique used. The impact of low-dose CTA acquisition including imaging with lower tube voltage (kV), tube current (mA), and novel reconstruction algorithms, such as iterative reconstruction, on plaque imaging is incompletely understood. Importantly, it should be noted that IVUS echodensity has limited value as a reference standard because it correlates only modestly with histology.
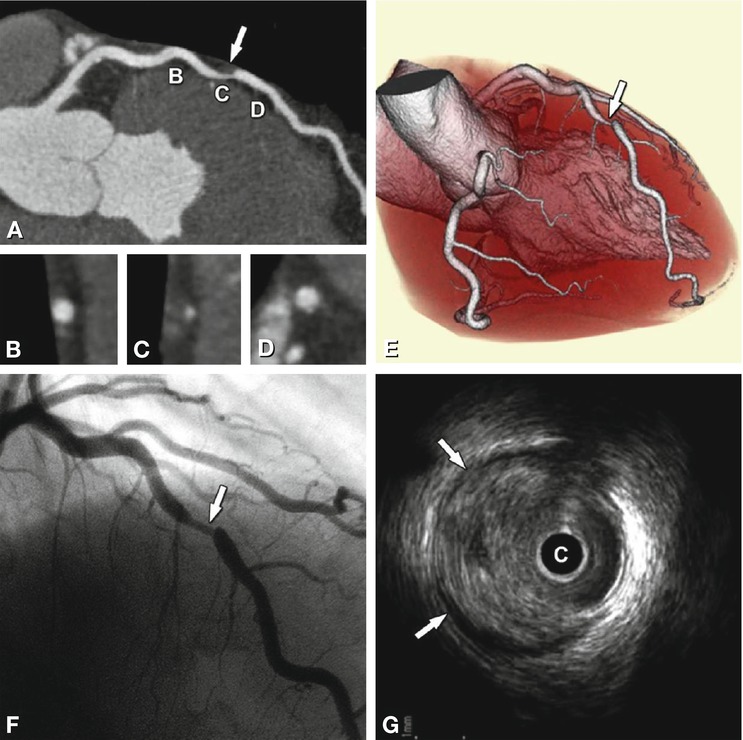
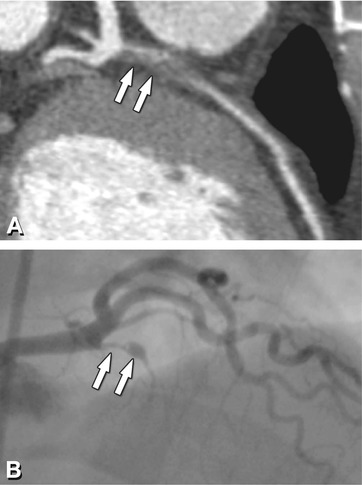
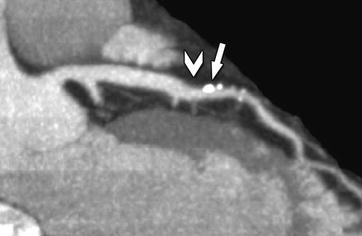
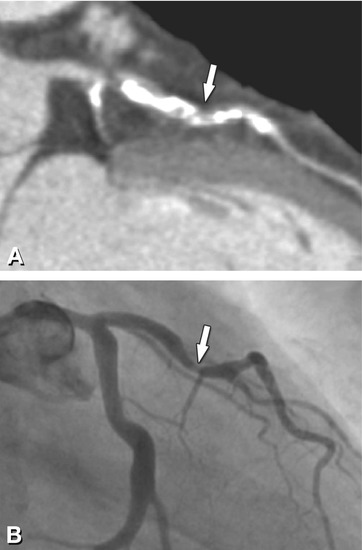
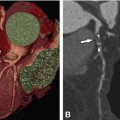
Fig. 14.2
Noncalcified plaque (arrow) in the proximal left anterior descending coronary artery associated with significant luminal stenosis in a 65-year-old male patient. Panel A shows a curved multiplanar reformation with cross-sections along the vessel in Panels B–D, and Panel E is a volume-rendered three-dimensional reconstruction of CT. Panel F is the conventional coronary angiography of this plaque, which resulted in a 70% diameter stenosis. Panel G is the intravascular ultrasound confirming the eccentric noncalcified plaque (arrows). C intravascular ultrasound catheter
Fig. 14.3
Noncalcified plaque (arrows) of the proximal left anterior descending coronary artery associated with (subtotal) occlusion in a 48-year-old male patient presenting with a vague history of recent episodes of chest pain. Panel A shows a curved multiplanar reformation of CT. Panel B shows the corresponding conventional coronary angiogram
Fig. 14.4
Mixed plaque with calcified (arrow) and noncalcified components (arrowhead) in the mid left anterior descending coronary artery associated with mild luminal narrowing in a 55-year-old female patient presenting with atypical angina pectoris. The image shown here is a maximum-intensity projection along the vessel
Fig. 14.5
Densely calcified plaque in the proximal and mid left anterior descending coronary artery (arrow) in a 65-year-old female patient presenting with chronic angina pectoris. Panel A shows a curved multiplanar reformation, while the corresponding conventional coronary angiogram (Panel B) shows a hazy stenotic lesion (75% diameter stenosis) in the mid part of the calcified plaque. Importantly, the densely calcified plaques in the proximal and distal segment show no evidence of significant angiographic stenosis
Table 14.2
Plaque characterization by CT in comparison to IVUS
Study | Lipid-rich (HU) | Fibrous (HU) | Calcified (HU) |
|---|---|---|---|
Schroeder et al. JACC 2001 | 14 ± 26 | 91 ± 21 | 419 ± 194 |
Leber et al. JACC 2004 | 49 ± 22 | 91 ± 22 | 391 ± 156 |
Becker et al. Eur Radiol 2006 | 47 ± 9 | 104 ± 28 | |
Carrascosa et al. AJC 2006 | 72 ± 32 | 116 ± 36 | 383 ± 186 |
Pohle et al. Atherosclerosis 2007 | 58 ±43 | 121 ± 34 | |
Motoyama et al. JACC 2007 | 11 ± 12 | 78 ± 21 | 516 ± 198 |
Sun et al. AJR 2008 | 79 ± 34 | 90 ± 27 | 772 ± 251 |
Petranovic et al. JCCT 2009 | 100 ± 28 | 77 ± 39 | 608 ± 217 |
14.2.3 Arterial Remodeling
The assessment of arterial remodeling is an important aspect of plaque identification and quantification. As described above, early atherosclerotic plaque accumulation is typically associated with expansion of the vessel wall, mitigating development of luminal narrowing. It is now well established that remodeling is related to plaque stability, with outward/positive remodeling constituting a marker of vulnerability. Remodeling is described by relating the vessel size at the lesion site to that at the adjacent reference site. The remodeling index is a quantitative measure calculated by dividing the vessel diameter at the lesion site by that at the adjacent normal reference site. Values higher than 1 or 1.05 indicate outward (positive) remodeling. While remodeling can be assessed with CT (Table 14.3), assessment of remodeling in clinical routine is limited by the focal nature of plaque and the fact that it is dependent on the definition of the lesion and reference site.
Table 14.3
Assessment of arterial remodeling
Study | Scanner | N | Definition of remodeling |
|---|---|---|---|
Schoenhagen et al. Coronary Artery Disease 2003 | 16-row | 14 | Qualitative assessment |
Achenbach et al. JACC 2004 | 16-row | 44 | Quantitative |
Remodeling index | |||
Imazeki et al. Circ J 2004 | 4-row | 57 | Quantitative |
Remodeling index | |||
Motoyama et al. JACC 2007; 2009 | 16- and 64-row | 71 | Quantitative |
Remodeling index | |||
Meijs et al. Am J Cardiol 2009 | 64-row | 114 | Quantitative |
Remodeling index |
14.2.4 Plaque Quantification
Quantification of overall plaque burden and its components with CT requires outlining the lumen/vessel wall and vessel wall/adventitia borders for segmentation of the wall, including atherosclerotic plaque. Segmentation allows quantification of plaque area or volume, and in a second step, the vessel wall and plaque contained between these borders can be characterized based on HU (Fig. 14.6 and 14.7).
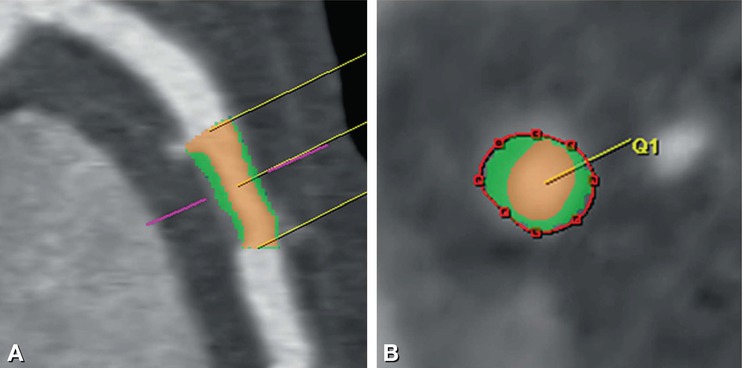
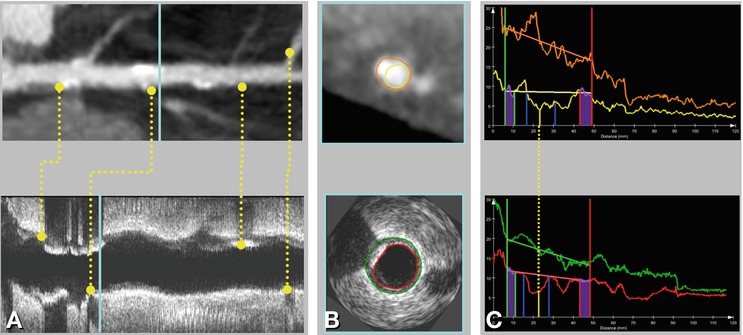
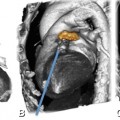
Fig. 14.6
Noncalcified plaque without significant diameter loss in the left anterior descending coronary artery in a 42-year-old male patient presenting with atypical angina pectoris. Panel A is a curved multiplanar reformation and Panel B is a corresponding cross-section. The semiautomated analysis of this noncalcified plaque is shown as a color overlay with the plaque colored in green and the lumen in orange, while a red line traces the endothelial-adventitial border
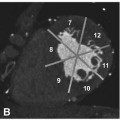
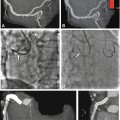
Fig. 14.7
Overview of validation setup for CTA plaque quantification using IVUS data. Panel A shows common landmarks (for example bifurcations and calcified plaques) in both CTA and IVUS data, which are used to register IVUS slices with slices from a stretched multiplanar reformation in CTA. Panel B presents an example of matched slices showing contours in both CTA and IVUS. Panel C presents matched quantification graphs of CTA and IVUS for the whole vessel. Lesion definitions obtained with both modalities can be compared this way. Software package QAngioCT Research Edition, Medis Medical Imaging Systems; Leiden, The Netherlands (With permission from Boogers et al. Eur Heart J 2012)
Limitations are the lower spatial resolution relative to IVUS and optical coherence tomography (>0.4 mm for each voxel edge with CT) and difficulties in defining intimal and adventitial borders. Clinical experience with CT in comparison to histology and IVUS for quantification of coronary artery plaque (Table 14.4), including reproducibility of plaque volume quantification is accumulating (Table 14.5). Figure 14.8 outlines a systematic approach to plaque identification and semiquantitative grading.
Table 14.4
Plaque quantification