Fig. 13.1
Overview of different coronary stents using ex-vivo CT. Stent lumen visibility and artifacts differ greatly for the currently available coronary artery stents. This is mainly due to differences in material, strut size, and design. The visibility of the lumen of the Magic stent (asterisk), which is made of magnesium (plus less than 5% of zirconium, yttrium, and rare earth metals each), is far superior to that of tantalum-coated stents (strut thickness of 58 and 84 mm) with pronounced artificial lumen narrowing (arrowheads) (Modified and used with permission from Maintz et al. Eur Radiol 2009)
In CT, any kind of metal will cause typical artifacts resulting from the pronounced attenuation due to its very high density. The severity of metal artifacts in the final image is determined by spatial resolution on the one hand and the use of noise filters and special reconstruction algorithms on the other. Residual motion artifacts due to high heart rates, irregular beats, or paradoxical ventricular motion patterns – conditions likely to be met in patients with manifest CAD – enhance the artifacts caused by the metal stents. Furthermore, decreased cardiac output, also common in patients with CAD, influences individual contrast dynamics.
13.3 Beam Hardening, Blooming, and Artificial Lumen Narrowing
13.3.1 Beam Hardening
Beam hardening refers to a shift in the X-ray spectrum to higher energy photons caused by absorption of lower energy photons within very dense structures such as metallic material. It may lead to a virtual loss of CT density in surrounding soft tissue (i.e., it may look “darker” than it should and black streaks may occur). This is because higher energy photons are less sensitive to soft tissue and iodine attenuation. Figure 13.2 shows beam hardening with corresponding tissue or filling defects caused by high density contrast agent or metal. Dedicated image reconstruction algorithms (see below) may correct or even overcorrect for this effect and may thus eventually even exaggerate soft tissue densities.
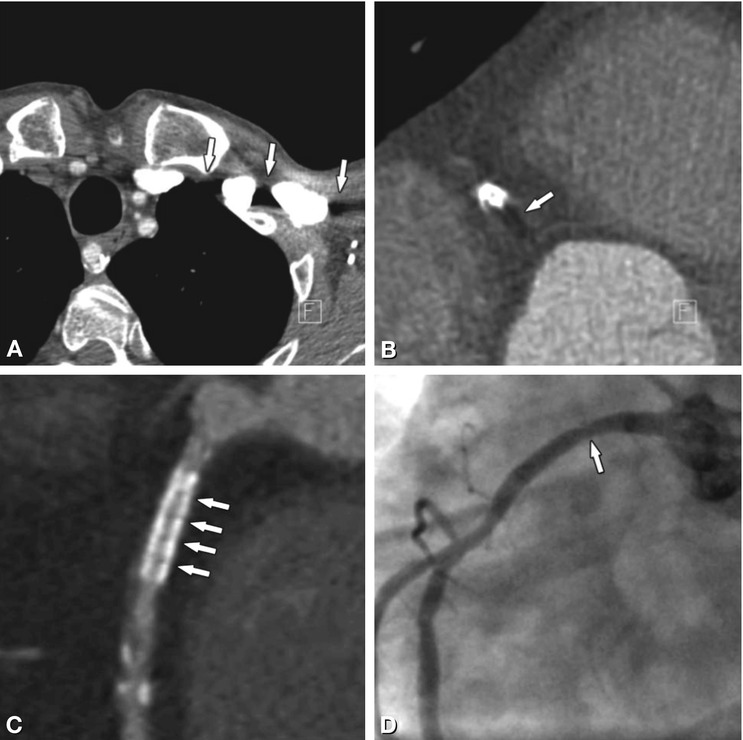
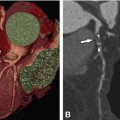
Fig. 13.2
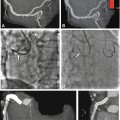
Beam-hardening effects as caused by undiluted contrast agent (Panel A) or metal (Panels B, C). Next to high-density inflowing contrast agent, the relative increase in X-ray energy decreases the visualization of low-density soft tissue, causing black streaks and artificial tissue defects (arrows in Panel A). The same effect can be witnessed in surrounding tissue next to coronary stents (arrow in Panel B). Within the stent, beam hardening artifacts depend on the individual stent structure and may look like repeated dark spots inside the stent lumen (arrows in Panel C). They preclude rule-out of in-stent restenosis in this 56-year-old male patient, which thus had to be excluded by conventional coronary angiography. The corresponding angiogram in Panel D shows only mild focal wasting (arrow) but no relevant stenosis
13.3.2 Blooming and Artificial Lumen Narrowing
So-called blooming of stent struts is an apparent increase in strut size in x-, y-, and z-direction and is mainly caused by partial volume effects. Its magnitude is influenced by the reconstruction algorithm used for image computation. Whenever a voxel includes two different densities (e.g., parts of stent struts as well as lumen), the average density of the two will be displayed. As CT density values of metal are extremely high, those average values will always be way above those of body tissue and – in the window-level settings used in CT angiography – will rather resemble those of the stent struts. Thus the better spatial resolution gets, which means the smaller the voxels are, the fewer partial volume effects will be seen. However, even state-of-the-art high-end CT scanners do not provide a spatial resolution equivalent to current stent strut size (0.07–0.15 mm). One of the most bothersome effects of blooming is artificial lumen narrowing. The in-stent lumen is systematically underestimated in CT: artificial narrowing ranges from 20 to 100% depending on stent material. When using current 64-row CT with smaller slice thickness and dedicated reconstruction kernels, artificial narrowing is reduced (Fig. 13.3) but still considerable at about 30–40%.
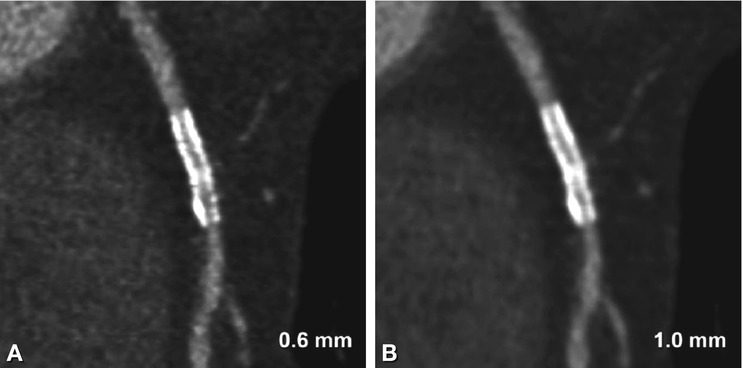
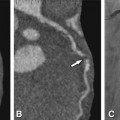
Fig. 13.3
Illustration of the effect of slice thickness on visibility of in-stent lumina. Curved multiplanar reformations of a 3.0-mm stent in the right coronary artery using a slice thickness of 0.6-mm (Panel A) and 1.0 mm (Panel B). The improved resolution shows greater detail, but also increases noise (Panel A), whereas there is pronounced blooming and reduced lumen visibility with thicker slices (Panel B). Both datasets were reconstructed at a slice increment equal to two thirds of the slice thickness (0.4 and 0.7 mm) with an intermediate sharp reconstruction kernel and are displayed with identical window-level settings (1,500/300)
13.4 Data Acquisition and Image Reconstruction
13.4.1 Temporal Resolution
Considering the general challenges of cardiac CT (motion) and the special challenges of imaging coronary artery stents (metal artifacts enhanced by motion), individualized contrast timing and premedication (e.g., beta blocker and nitroglycerin) as well as a fast gantry rotation speed and the use of the scanner’s best possible temporal resolution are important. Please be reminded that a scanner’s temporal resolution is best at the center of the scan field since the influence of the fan angle increases in off-center positions. So try to ensure optimal positioning of the heart by adjusting table height and patient position on the table accordingly (Chap. 9).
13.4.2 Spatial Resolution: Scanning
The scanner’s detector size (e.g., 0.5 mm) determines the thinnest possible reconstructed slice thickness and thus spatial resolution in Z-direction. Coronary artery stent imaging demands submillimeter collimation. Yet, smaller detector elements will result in images with higher noise. Unfortunately, increased image noise degrades the depiction of fine details. Thus, the X-ray input needs to be increased when the smallest possible detector collimation is to be used, especially in larger individuals.
13.4.3 Spatial Resolution: Image Reconstruction
The reconstruction field of view determines pixel size within the axial image. For coronary stent evaluation, the field of view should be just large enough to contain the entire heart, but small enough to take advantage of its 512 × 512 matrix (Chap. 9). Of course, a second reconstruction with a larger field of view to cover possible noncoronary findings is also needed.
The reconstruction algorithms used for image calculation from raw data can manipulate the original data in several ways. They can smoothen the overall image impression by stretching the transition between different tissues/densities over several voxels or emphasize tissue differences by sharpening the delineation of neighboring CT attenuation values. Unless confounded by additional filtering or iteration loops, smoothing algorithms will decrease and edge-enhancing filters will enhance background image noise. The different image impressions resulting from use of a soft vs. intermediate reconstruction kernel with identical window-level settings are shown in Fig. 13.4. The recommended reconstruction kernels for the evaluation of coronary artery stents are frequently identical to those used in the presence of heavy coronary calcifications. Table 13.1 gives an overview of the reconstruction algorithms recommended for coronary artery stent imaging.
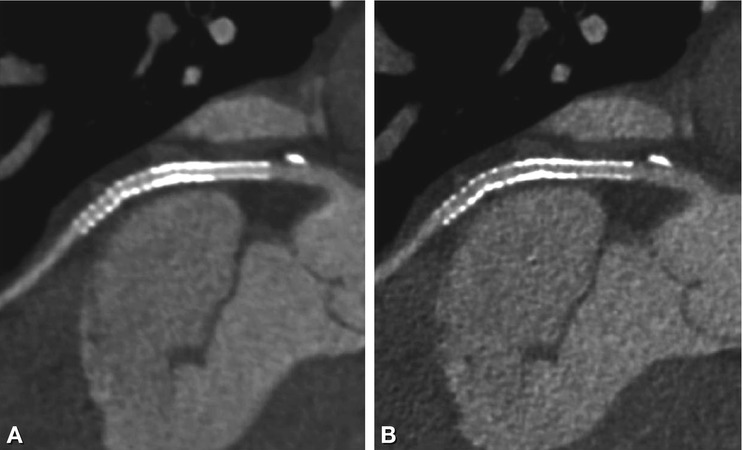
Fig. 13.4
Effect of reconstruction kernels on stent visibility. Curved multiplanar reformations (0.75 mm slice thickness) of a 3-mm stent in the left circumflex coronary artery using soft (Panel A) and intermediate sharp reconstruction kernels (Panel B). There is a smooth impression, but reduced stent lumen visibility using the soft kernel (Panel A) compared to the grainy appearance (higher image noise) of the sharper kernel in Panel B, which however allows better in-stent lumen assessment. Identical window-level settings (1,500/300) were used
Table 13.1
Vendor-specific reconstructions kernels for coronary CT angiography
CT vendor | Reconstruction kernel recommended for routine coronary CT angiography | Reconstruction kernel recommended for calcium/coronary stents |
|---|---|---|
GE | SOFT | Detail (DTL), Bone C2 |
Philips | CA | CD (calcium: CC) |
Siemens | B26f(B30f) | B46f |
Toshiba | Cardiac CTA (FC 3) | Cardiac stent (FC 5) |
In addition, reconstruction algorithms may contain corrections for local artifacts such as beam hardening or weakening in the vicinity of high-density material. An increase in Hounsfield unit (HU) values within the stent lumen compared to lumen attenuation proximal and distal to the stented segment may result from both limited spatial resolution and overcorrection of the algorithm used. False-high in-stent densities can be reduced by using dedicated sharp reconstruction algorithms for coronary stent visualization (Fig. 13.5).
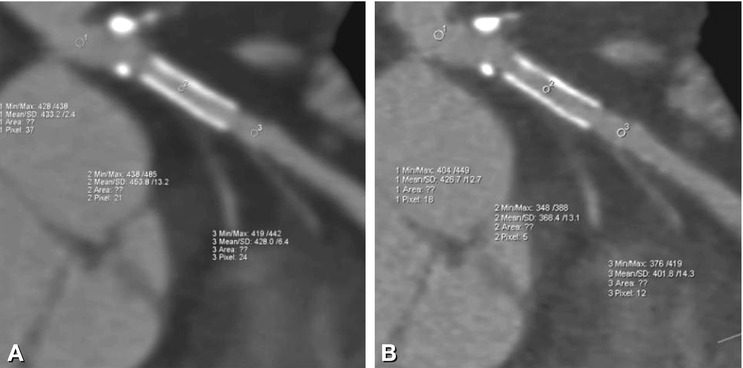
Fig. 13.5
Decrease of false-high in-stent HU values (Panel A) when using sharp reconstruction kernels (Panel B). A decrease in partial volume effects and different filtering techniques included in recommended reconstruction kernels lead to different in-stent HU values in the same LAD stent reconstructed with a soft (B26f) (Panel A) vs. a sharp (B46f) (Panel B) reconstruction kernel. Whereas in Panel A, in-stent values exceed those measured before and after the stent (mean of about 454 HU versus 433 and 428 HU), in-stent HU values in Panel B are not higher but slightly lower than those in the adjacent nonstented vessel (about 368 HU versus 427 and 402 HU). Of course, standard deviation as a surrogate of image noise shows higher values in Panel B
With increasing computational power of recent CT systems, so-called iterative reconstruction algorithms have become available in clinical practice. Unlike so-called weighted filtered back projection (WFBP) used in standard reconstruction algorithms, iterative reconstruction algorithms perform repeated calculations from raw data to image data and back (= iteration loops), generating retransferred raw data sets, which are compared with the originally scanned data in order to identify differences caused by noise. This can be repeated several times, as predefined by the user (two or more iteration steps) and finally be used to reduce noise without losing spatial resolution. Resulting images appear smoothened, yet detailed. However, as anything in life, iterative reconstruction can be overdone as well: as the number of iteration loops is increased (5 or more), the more the visual impression of our images deviates from what we are used to and deteriorates again (Fig. 13.6


Related posts:

Stay updated, free articles. Join our Telegram channel
Full access? Get Clinical Tree
