36 Correlative Imaging
Arteriography
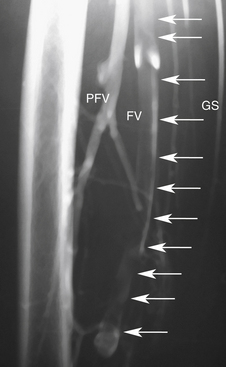
Imaging of vascular structures is dependent on producing x-rays, filling the vessels of interest with iodinated contrast, and recording the images generated (Figure 36-1).
Equipment and Principles
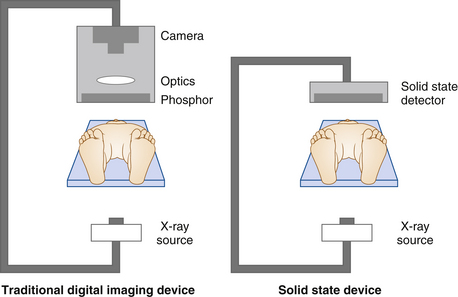
A large space is required to comfortably hold the equipment and personnel needed for patient care during the procedure. The room is usually based around the x-ray tube, a patient table, and an x-ray detector. Most digital imaging systems have a C-arm configuration with the x-ray tube coupled to the x-ray detector by a C-shaped bracket. The patient lies on a table situated between the tube and the detector (Figure 36-2). Imaging device configuration varies considerably in sophistication, from small portable systems to table-mounted systems equipped with moving tables for the performance of runoff arteriography.
Digital Imaging
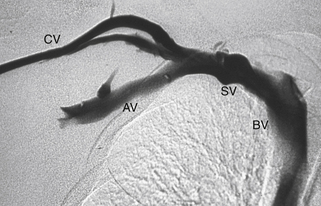
Digital subtraction builds on digital imaging by obtaining one or several “mask” images before radiographic contrast injection. The mask image is then subtracted digitally from the images with contrast to display the areas containing contrast only (Figure 36-3). Patient movement during injection causes an imaging “mismatch,”, as does respiratory excursion. Full patient cooperation remains necessary for high-quality imaging. Digital subtraction techniques can result in reduction of the amount of contrast agent needed by twofold to threefold.
General Principles: Arterial
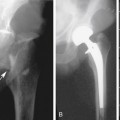
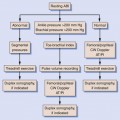
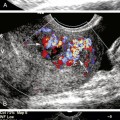
Vascular access sites are determined by the pattern of disease. Standard arterial access is the common femoral artery because it is a large vessel and has low complication rates historically. The axillary artery has a smaller caliber than the common femoral artery, but with the brachial plexus intimately wrapped around it in the brachial fascia, nerve-related complications are possible (0.4%-9.5%). Because of the risk for nerve injury, low brachial artery punctures, at midarm and performed under ultrasound guidance, are preferred. Direct popliteal artery punctures can also be performed but are limited by the increased rate of complications and are reserved for highly specific indications by experienced angiographers and not commonly used.
Accuracy and Reproducibility
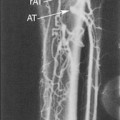
In the lower extremity arteries, opacification of the peripheral runoff vessels in the leg and foot is sometimes not possible. The use of “on-table” arteriograms in the operative suite while the patient is under anesthesia has been suggested as a possible way of circumventing this problem in some patients.
Computed Tomography Angiography
Equipment
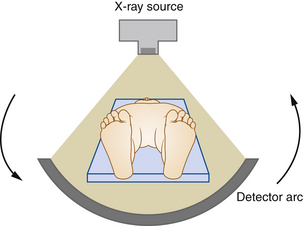
CT scanners have evolved continuously since their introduction in 1979. The first multidetector (four-slice) scanner was used in 1998. Currently, state-of-the-art scanners use a fan-shaped x-ray beam and an arc of x-ray detectors opposite the beam, both mounted on a ring surrounding the patient (Figure 36-4). This rotates to encompass a 360-degree circle around the patient. Rotation times are now shorter than half a second. Fast table speeds and thin slice width allow submillimeter (isotropic) resolution.
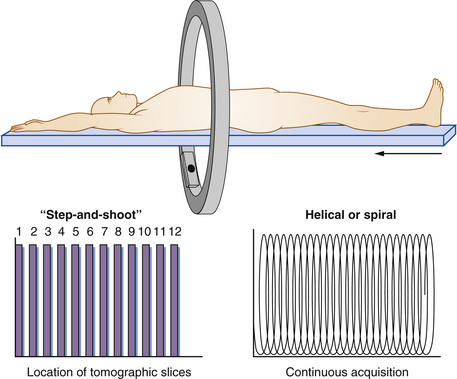
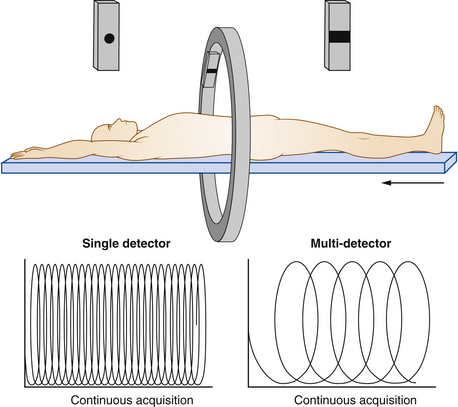
CT was originally performed as a “step-and-shoot” approach: one image was obtained during a 360-degree rotation of the detector, and then the patient table moved to the next position for the next image acquisition. The current approach is to use helical or spiral imaging (Figure 36-5). Rather than sequentially acquiring data at fixed distances, these devices continuously acquire data as the patient is moved at a constant rate through the scanner. The addition of multiple detectors, currently 16 and often 64 or more, permits coverage of larger distances with each rotation of the detector (Figure 36-6). For example, if a 64-detector array scans over a 40-mm-long segment, each rotation of the gantry can cover a slice thickness of 40 mm with an effective slice thickness less than 1 mm.
Physical Principles
The x-ray detectors are used to measure the attenuated x-ray beam after it has passed through the patient. These data are digitally manipulated to calculate a cross-sectional image. Images are displayed with a gray scale of -1000 Hounsfield units (air) to over 1000 Hounsfield units (bone), on a television monitor, normally with a format of 512 × 512 pixels.
Technique
In CTA, the x-ray data are continuously acquired during a single breath hold while the patient is moved through the x-ray beam of the gantry. Iodinated contrast is simultaneously injected intravenously to enhance vessels at a rate of 3 to 5 mL/sec depending on the application. The acquired data are reconstructed to produce multiple slices of preselected thicknesses. The data are then reconstructed and displayed as axial slices or rendered in a 3D format. A display of vascular structures can be achieved when a maximum intensity projection (MIP) algorithm is applied. This projects only the brightest pixel along each ray path. The image data set can also be manipulated and displayed in a format resembling the multiple projections used in conventional angiography or in selected coronal and sagittal planes.
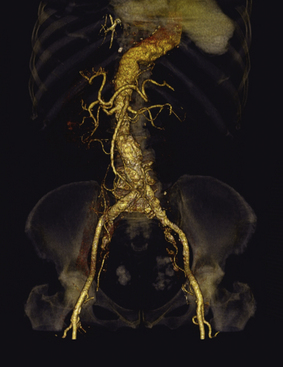
CTA can be used to carefully evaluate the soft tissues. In this, it is superior to angiography. A simple example is the evaluation of abdominal aortic aneurysm. The CT angiogram can depict the extent of thrombus deposition in the aorta, an evaluation that is not possible by arteriography. CT spiral angiograms can record abdominal vessels to the third-order branches from the aorta (Figure 36-7). The limited spatial resolution restricts visualizing smaller arterial branches. Constraints in the amount of contrast that can be injected make it difficult to follow long vessels such as those found in the extremities.
Complications
Related posts:
 Normal Cerebrovascular Anatomy and Collateral Pathways
 Controversies in Venous Ultrasound
 Nonimaging Physiologic Tests for Assessment of Lower Extremity Arterial Disease
 Arterial Anatomy of the Extremities
 Duplex Ultrasound Evaluation of the Uterus and Ovaries
 Extremity Venous Anatomy and Technique for Ultrasound Examination
Stay updated, free articles. Join our Telegram channel

Full access? Get Clinical Tree


