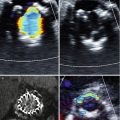
Fig. 13.1
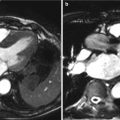
3D standardized views of the aortic valve using multiplanar reformation (MPR). Panel (a) Left sagittal oblique (3-chamber view); (b): left coronal oblique; (c): short-axis view of the aortic valve during systole enabling sizing of the aortic valve orifice area (AVA). The displayed short-axis plane of panel (c) is indicated as white line in panel (b). The smallest AVA must be selected
Reconstructing the Aortic Valve by CT
Given the volumetric acquisition of the aortic valve by a single CT examination, it becomes possible to review the valve morphology and function by several different methods. These include multiplanar reformations (MPR), maximal intensity projections (MIP), minimum intensity projections (MinIP), and volume rendering techniques (VRT) (Box 13.1). Each of these has benefits and limitations and is herein discussed.
MPR visualization of the aortic valve on advanced 3D post-processing workstations or thin-client server-based solutions are a prerequisite for aortic valve assessment. The aortic valve should be reviewed on thin-slices MPR (0.5–1 mm slice width) and reconstructed in three different views shown as listed below in Table 13.1 and shown at Figure 13.1. This technique enables visualization of the valve in true long- and short-axis reformats, thereby generating accurate assessments of the aortic valve areas (AVA) over the cardiac cycle.
Table 13.1
Standardized imaging planes for aortic valve assessment using multiplanar reformat images
Left coronal oblique |
Left sagittal oblique (similar to echocardiographic three-chamber view) |
Short axis (cross-sectional left ventricular outflow tract) requires multiple views from tip of leaflet to annulus |
MIP views project the maximally dense structures within a voxel (typically calcium) and are not recommended as first-line post-processing technique for evaluation of the aortic valve morphology or sizing the AVA. MIP views are less reliable than MPR, because the thin valve leaflets may appear smaller or falsely interrupted caused by surrounding hyperattenuation due to artifactual enlargement afforded by “blooming” or partial volume artifacts. In contrast, for delineation of AVA, MinIP views, which project the minimally dense structures (and thereby reduce the calcium blooming), may be more accurate for measuring AVA although this method has not been tested against MPR or MIP in large-scale studies.
VRT methods of evaluation are useful to demonstrate the location, severity, and shape of valvular calcification at one glance (Fig. 13.2). Such 3D VRT visualization of aortic valve calcium can be useful for presentation to the TAVR team during interdisciplinary review. Protruding and/or excessive calcification—particularly at the aortic annulus or left ventricular outflow tract—may lead to complications during TAVR, such as aortic rupture or hematoma. Four-dimensional cine loop imaging of the valve in this view may also allow for assessment of mobile components of valve calcium, which may predispose an individual to embolization. Finally, VRT methods are also particularly well suited to illustrate the valve leaflets and allow for differentiation between tricuspid and bicuspid valves (Figs. 13.2 and 13.3).
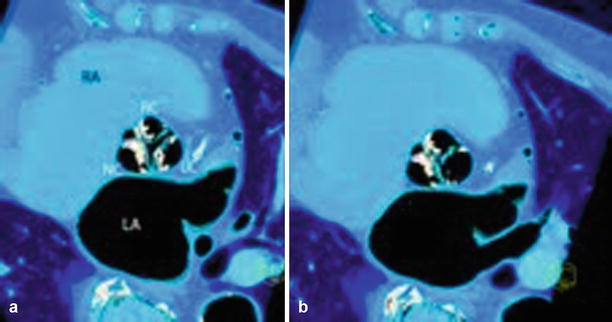
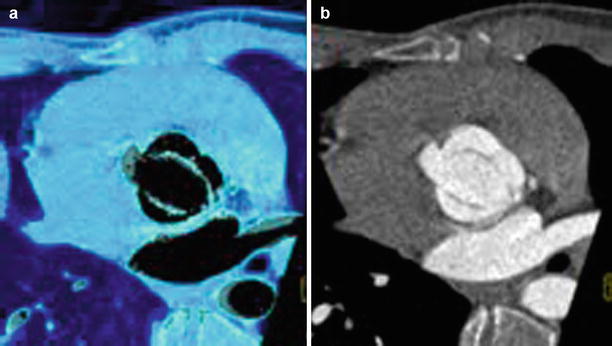

Fig. 13.2
Tricuspid aortic valve, systole versus diastole using 3D VRT. Three-dimensional VRT reconstruction shows severe aortic valve calcification in aortic stenosis during systole (Panel a) with open valve orifice. During end diastole (Panel b), the “Mercedes star” feature of tricuspid valve is shown (note a small central leakage indicating aortic valve regurgitation was found). RC Right coronary sinus, LC left coronary sinus, NC noncoronary sinus of Valsalva, LA left atrium, RA right atrium, axial oblique view

Fig. 13.3
Congenital bicuspid valve. Characteristic “fish-mouth” opening during systole illustrated on a 3D VRT (Panel a) and short-axis multiplanar reformation (Panel b). Note congenital bicuspid valve with fused left and right coronary cusp
Box 13.1 CT Post-processing Methods for Evaluation of Aortic Stenosis
4D cine loop imaging: allows for short axis planimetry of aortic valve and assessment of mobile components of valve calcification
Maximal intensity projection: not recommended as first-line technique due to partial volume artifacts
Minimum intensity projection: projection of minimally dense structures reduces calcification artifact
Multiplanar reformat: enables visualization review on thin slices in true long- and short-axis planes
Volume rendered techniques: demonstrates location, severity and shape of valvular calcification in one view; enables easy differentiation between bicuspid and tricuspid aortic valve
CT for Assessment of Valve Morphology: Bicuspid Versus Tricuspid
CT has a high accuracy [13, 14] for identification of bicuspid valves, with a sensitivity of 94 % and specificity of 100 % [13]. The presence or absence of a raphe (85 and 15 %, respectively [13].) can be directly identified on CT images. The characteristic diagnostic criterion for a bicuspid valve is the “fish-mouth”-like orifice widening during systole (Fig. 13.3). Importantly, congenital primary bicuspid valves with or without raphe must be differentiated from secondary degenerative bicuspid valves. The latter arise from an originally tricuspid valve, with fusion of leaflets that can occur in the context of degenerative, rheumatic, and/or inflammatory aortic valve disease. In extremely rare cases, a quadricuspid aortic valve [15], consisting of four leaflets with an estimated incidence of 0.003–0.043 % of all congenital heart disease, may be found. For patients being considered for TAVR, a definite exclusion of bicuspid valve morphology is required as this valve type is currently considered a relative contraindication for TAVR owing to its distinct geometry.
Diagnosis of Aortic Stenosis by CT
The systolic anatomic aortic valve orifice area (AVA) is the key parameter to establish the diagnosis of aortic stenosis severity (Table 13.2), apart from a transvalvular pressure gradient. The dedicated CT reconstruction path for AVA sizing is illustrated in Fig. 13.1. A “best phase” with optimal image quality showing the phase with the maximal orifice area should be choosen [16]. Usually, the mid-systolic phases (15–35 % of R-R interval) are the most suitable; however, dependent upon a given patient’s individual heart rate, all systolic phases of the R-R interval should be reviewed. The “best phase” for sizing should entail a careful review of all of the information available—including a combination of the best image quality (with no or minimal artifacts) and the largest AVA during systole. Most importantly, all short-axis views of the aortic valve from the tip of the leaflets caudally towards the annulus should be reviewed, in order to select the smallest AVA during this maximal opening.
Table 13.2
Aortic stenosis severity by CT
AVA (cm2) | |
|---|---|
Mild | >1.5 |
Moderate | 1.0–1.5 |
Severe | <1.0 |
Severe, critical | <0.7 |
Numerous studies [16–28] published over the past years have shown high diagnostic accuracy of CT for measuring the AVA in comparison to other modalities. These comparisons of CT to other clinical modalities—such as transesophageal echocardiograph (TEE), transthoracic echocardiography (TTE), magnetic resonance tomography (MRT), and invasive catheterization—are summarized in Table 13.3. One meta-analysis pooling 9 studies [18] with 175 women and 262 men revealed a good agreement for determining the AVA by TTE and CT (mean Pearson correlation coefficient, r = 0.89), mean difference of +0.03 cm2, and an even higher agreement of CT with TEE (r = 0.99) in 95 subjects. Similarly, another meta-analysis [19] of 14 studies with 470 subjects revealed a mean variance of +0.08 cm2 AVA overestimation by CT, indicating a generally high intermodality agreement.
Table 13.3
Studies comparing AVA sizing by CT compared to other imaging modalities
N | Reference modality | CT scanner detector rows | R value (sensitivity, specificity) | |
|---|---|---|---|---|
Alkadhi (2005) [17] | 20 | TTE | 16 | 0.95 |
Feuchtner (2005) [16] | 46 | TTE | 16 | 0.89 |
Bouvier et al. (2006) [25] | 103 | TTE | 16 | n/a, good agreement |
Pouleur (2007) [21] | 48 | TTE, TEE, MRI | 40 | 0.92 |
Habis et al. (2007) [26] | 52 | TTE | 64 | 0.76 |
Laissy et al. (2007) [30] | 50 | TTE | 16 | 0.77 |
Leborgne et al. (2009) [23] | 33 | TTE | 16 | 0.89 |
Feuchtner et al. (2007) [22] | 36 | TTE | 64 | 0.88 |
TEE | 0.99 | |||
Tanaka et al. (2007) [24] | 29 | TTE | n/a | 0.96 |
Lembcke (2008) [20] | 32 | TTE | 40 | 0.86 |
CATH | 0.90 | |||
La Bounty et al. (2009) [27] | 56a | TEE | 64 | (sensitivity 100 %, specificity 96 %) |
Ropers et al. (2009) [28] | 50 | TEE | DSCT | 0.93 |
CATH | 0.97 | |||
Lembcke (2009) [44] | 36 | TTE | 64 | 0.91 |
TEE | 0.82 | |||
CATH | 0.91 | |||
Li et al. (2009) [29] | 40 | TTE | DSCT | 0.79 (sensitivity 91 %, specificity 100 %) |
Total | 647 | 0.89 |

