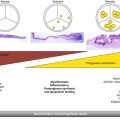
Fig. 31.1
(a) Balloon-expandable Edwards Sapien (Edwards Lifesciences, California, USA) and (b) self-expanding CoreValve (Medtronic, Minnesota, USA) transcatheter valves with optimal implantation depth where half to two-thirds (Edwards Sapien) and 4–8 mm (CoreValve) of the stented prosthesis rests on the ventricular side of the aortic annulus (red line)
Complications related to TAVR can occur if the aortic prosthesis deployment is either too high or too low. High implantation can lead to aortic injury, paravalvular regurgitation, coronary occlusion due to either the stented valve or impingement by the native aortic leaflets, or embolization of the transcatheter valve into the aorta. Low implantation is associated with conduction abnormalities, paravalvular regurgitation, embolization of the transcatheter valve into the left ventricle, or mitral valve dysfunction including regurgitation, perforation, or restricted motion of the anterior mitral leaflet.
Fusion imaging provides the operator with added information to confirm appropriate transcatheter valve sizing, aids in valve positioning and deployment, and improves intra-procedural assessment to help guide the need further for further management. For the balloon-expandable valve, further management may include post-balloon dilatation and/or valve-in-valve placement. For the self-expanding valve, high valve implantation necessitates retrieval of the prosthesis assuming it is still attached to the delivery system or valve-in-valve placement once released. Conversely, low implantation requires pulling the prosthesis back if still attached to the delivery system or, when released, snaring and pulling of the valve. Valve-in-valve placement can also be used.
Fundamentals of Fusion Imaging
There are three essential components to fusion imaging: segmentation, registration, and live guidance (Box 31.1). Segmentation, or “post-processing,” involves the 3D reconstruction of axial CTA data using volume-rendering techniques. Anatomic structures of the heart are identified on the 3D image, and appropriate landmarks are labeled and measured. Registration entails the adjustment of the 3D CTA images to match the position and the scale of the overlaid fluoroscopic view. This can be performed using either automatic intensity or manual visual matching of the 3D image to 2D fluoroscopy in multiple planes.
Finally, live guidance utilizes the 3D-rendered CT data and displays it in the same perspective as the X-ray system. Rotation of the X-ray camera or movement of the table produces an equivalent movement in the registered overlay projection. Any landmarks placed on the segmented CTA image are fused with live fluoroscopy to assist the operator during the procedure. Segmentation, along with any measurements and planning, can occur prior to the procedure. The remaining components are carried out in the catheterization laboratory.
Box 31.1 Steps to Fusion Imaging for TAVR
Segmentation (Post-processing) | 3D reconstruction of axial CT data using volume rendered techniques |
Anatomic structures of heart identified on 3D image and appropriate landmarks labeled and measured | |
Registration | Adjustment of 3D CT images to match position and scale of overlaid fluoroscopic view |
Live Guidance | Utilization of 3D CT data with display in same perspective as x-ray system |
Rotation of x-ray camera or movement of table produces an equivalent movement in registered overlay position |
Computed Tomography in TAVR
Pre-procedural MDCT is performed with any available contemporary single- or dual-source multidetector scanner [2, 3] The protocol for image acquisition varies depending on the scanner but all with the goal of acquiring high-resolution, ECG-gated datasets with the best possible opacification of the thoracic aorta including the aortic valve and coronary arteries. A dedicated protocol, similar to that utilized for coronary computed tomography angiography (CTA), can be employed and modified according to patient size. Collimation is usually submillimeter (0.5–1.0 mm) and at a 0.2–0.35 pitch. Gantry rotation ranges from 0.26 to 0.4 s with the highest rotations speed providing improved temporal resolution with reduced cardiac motion artifact. Tube current ranges from 450 to 800 mA and tube voltage from 80 to 120 kVp, depending on patient size.
Heart rate reduction with beta blockade is not mandatory as compared with coronary CTA. Nonionic contrast media injection of 60–90 mL, depending on patient size, and at a rate of 5–6 mL/s rate provides optimal images. The injection site most commonly used is the antecubital vein, using an 18-gauge angiocath. The timing between the injection of contrast and the beginning of image acquisition should be determined with the aim of peak contrast concentration in the aortic root.
Retrospective ECG gating is predominately used at our institution for acquisition, which provides the entire dataset of images throughout the cardiac cycle. Three-dimensional images are reconstructed using volume-rendering techniques with any available standard reconstruction software (Fig. 31.2a). Adding time, 4D reconstruction is possible when multiple phases are used, typically 10–20 phases with 5–6 % R-R interval increments. Analysis of multiphase data allows for functional cardiac analysis and direct aortic planimetry (Fig. 31.2b). Scrolling through the systolic phases from 20 to 45 % can determine the point of maximal aortic valve opening and the largest aortic valve area.
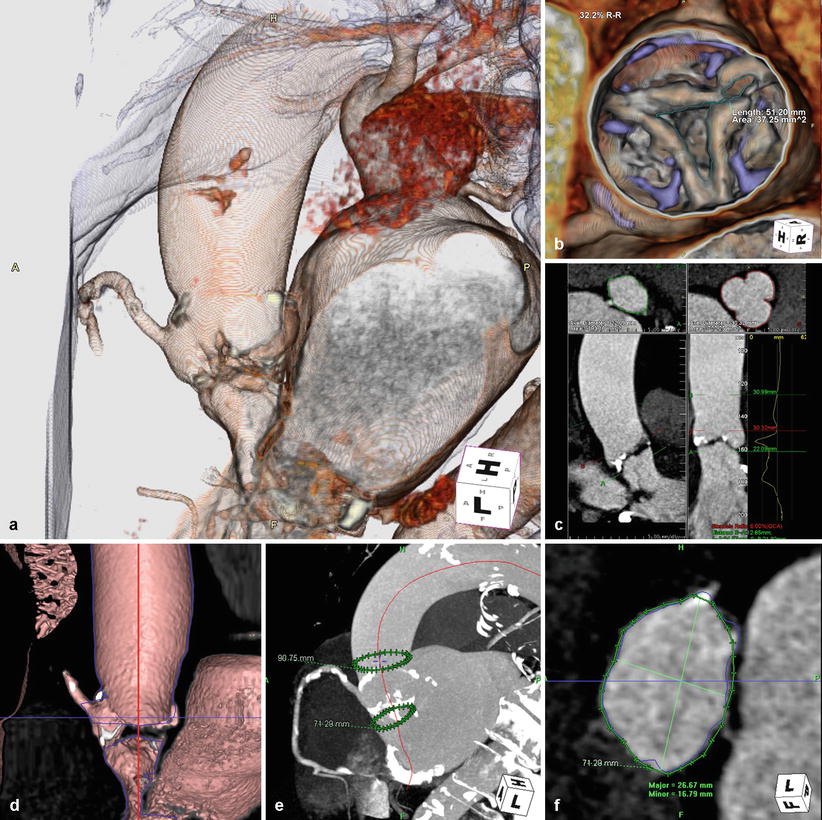
Fig. 31.2
Reconstruction. (a) 3D/4D cardiac reconstruction using volume-rendering techniques. (b) Direct aortic planimetry at point of maximal aortic valve excursion. (c, d) Curved multiplanar reconstructions (MPR) performed by tracing a centerline (red) through the center of the left ventricular outflow tract, aortic annulus, and ascending aorta. (e) The annular plane or basal ring (lower green circle in e) formed by the nadir of the three aortic cusps, perpendicular to the curved MPR line. (f) Measurements of the annular plane can be performed with the appropriate valve size determined (HeartNavigator, Philips Heathcare, Best, Netherlands)
Curved multiplanar reconstructions (MPR) are performed by tracing a line through the center point of the left ventricular outflow tract, aortic annulus, and proximal ascending aorta, known as the centerline (Fig. 31.2c, d). The annular plane, also termed basal ring, is created by the nadir of the three aortic cusps, perpendicular to the curved MPR line on the ventricular side (Fig. 31.2e). An alternative method to define the basal ring and provide TAVR measurements includes the reconstruction of a double oblique transverse image of the basal ring [2]. Measurements of the short and long axis diameter, mean diameter, area-derived diameter, and perimeter can be obtained and the appropriate respective valve size determined, with the intention of oversizing the valve by 10–20 % [3] (Fig. 31.2f). Additional measurements include the distance from annular plane to the coronary ostia, height and width of the aortic sinuses, and ascending aortic diameter.
MDCT can also be used to determine the optimal C-arm position for valve deployment. Transcatheter valves need to be deployed in a projection that is perpendicular to the native aortic annulus, ensuring coaxial stent position along the centerline. Rotating the 3D volume-rendered reconstructions such that the basal ring becomes a straight line confirms perpendicular projection to the X-ray beam. Multiple appropriate angles can be determined and a “line of perpendicularity” for each patient can be generated along a right anterior oblique (RAO) and caudal to left anterior oblique (LAO) and cranial direction [2].
Rotational Angiography
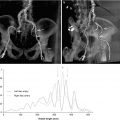
Intraprocedural 2D rotational angiography can be performed with any image intensifier or flat detector system [4]. The large C-arm sweeps through a wide rotation angle acquiring cine-angiographic images with timed contrast injection. The duration of rotation and trajectory vary depending on the fluoroscopic system utilized. The setup requires first isocentering the patient by visualizing the location of the aortic root in frontal and lateral angulations, with the aortic root brought to the center of the field of view. Contrast injection is performed using a pigtail catheter positioned in the nadir of the noncoronary sinus. The injection rate and volume of contrast varies based on rotational scan duration. The use of diluted contrast of 20–25 mL total injected at a rate of 15–20 mL/s has been reported [4–6]. This reduced contrast volume, compared with CTA, due to local administration may be important in the TAVR population with increased rates of renal insufficiency.
Gantry rotation covers approximately 200° from RAO 100° to LAO 100° at 40° per second. Breath hold and rapid ventricular pacing are utilized to minimize motion of the ascending aorta and reduce flow across the aortic valve during acquisition. X-ray tube voltage, current, and pulse duration are set to provide optimal contrast between the aorta and background structures and to reconstruct the contrast-filled aortic structures. 3D and 4D reconstruction using associated software is then performed with volume-rendering techniques; important structures of interest include the aortic arch, aortic valve leaflets, and the coronary ostia. Because the C-arm performs a much slower rotation than CTA, retrospective ECG gating is used to select the X-ray images acquired during a desired cardiac phase. With fewer images, the potential for more artifacts is possible. Rotational angiography in TAVR can be used for aortic annular anatomic assessment, quantitative analysis using MPR, and procedural guidance, potentially replacing the role of pre-procedural CTA [7].
MDCT/Fluoroscopy Fusion
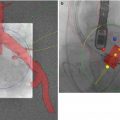
The HeartNavigator system (Philips Heathcare, Best, Netherlands) is a proprietary software available for MDCT/fluoroscopy fusion imaging in TAVR and utilizes the pre-procedural cardiac CT images [8]. Pre-procedural 2D images are 3D volume-rendered and automatically segmented to identify the aortic root, coronary ostia, the aortic valve, the left ventricle, and the valve plane running through the bottom of the three cusps [9–11] (Fig. 31.3). Segmentation can be manually optimized if necessary. After segmentation, the required X-ray projections are planned by positioning a simulated X-ray view based on 3D-rendered images with the same perspective as that of the C-arm. Views are selected such that the fluoroscopic image is in line with the valve plane. The planned views, typically RAO caudal or LAO cranial, are then stored for use during the procedure. Manual measurements are performed using the automatic detection of the valve plane, which ensures that the measurements are performed without foreshortening (Fig. 31.4).
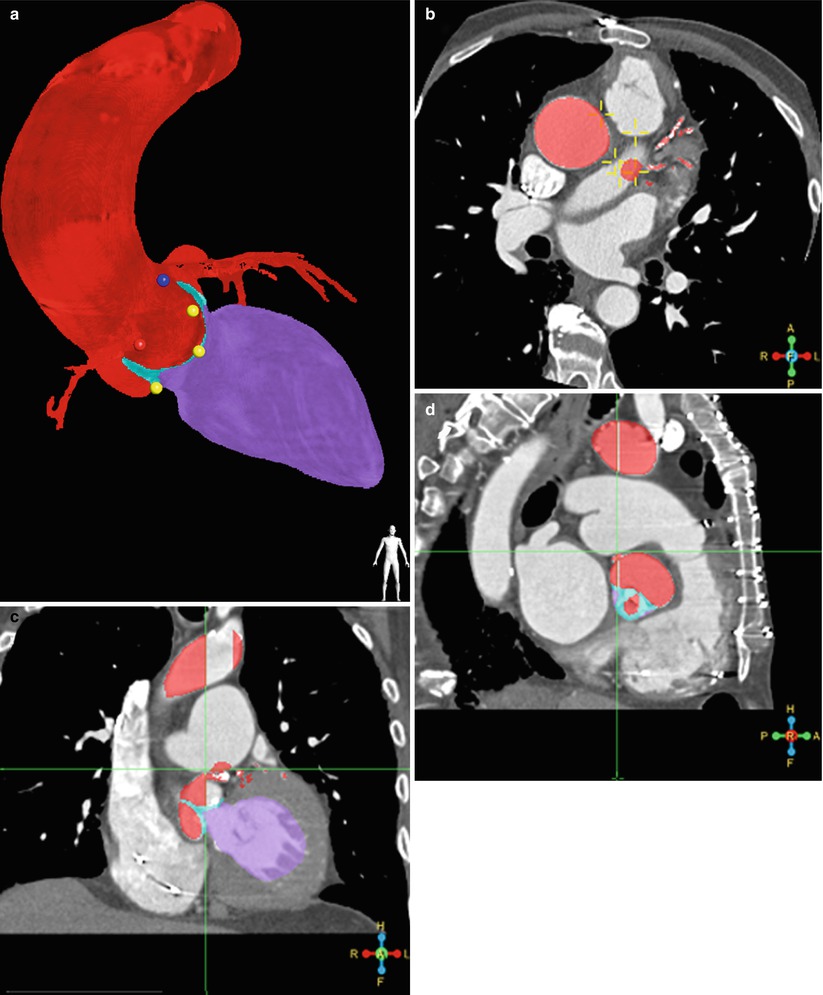
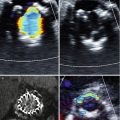
Fig. 31.3
 Transcatheter Aortic Valve Replacement: Current Evidence from Large Multicenter Registries
 Positron Emission Tomography Evaluation of Aortic Stenosis
 Pathologic Findings in Aortic Stenosis
 Transcatheter Aortic Valve Replacement in Patients with Chronic Kidney Disease: Pre-procedural Assessment and Procedural Techniques to Minimize Risk for Acute Kidney Injury
 Aortoiliofemoral Assessment: MDCT
 Valve-in-Valve for Transcatheter Aortic Valve Replacement: Do Imaging Requirements Change?


Segmentation. (a) Automatic segmentation of 3D volume-rendered images to identify the aortic root and proximal coronary arteries (red), left ventricle (purple), coronary ostia (blue dot – left main coronary artery and red dot – right coronary artery), and the nadir of the three coronary cusps (yellow dots). Segmentation in axial (b), sagittal (c), and coronal (d) planes are used for editing and confirmation. (HeartNavigator, Philips Heathcare, Best Netherlands)
Related posts:
Transcatheter Aortic Valve Replacement: Current Evidence from Large Multicenter Registries
Positron Emission Tomography Evaluation of Aortic Stenosis
Pathologic Findings in Aortic Stenosis
Transcatheter Aortic Valve Replacement in Patients with Chronic Kidney Disease: Pre-procedural Assessment and Procedural Techniques to Minimize Risk for Acute Kidney Injury
Aortoiliofemoral Assessment: MDCT
Valve-in-Valve for Transcatheter Aortic Valve Replacement: Do Imaging Requirements Change?
Stay updated, free articles. Join our Telegram channel
Full access? Get Clinical Tree
