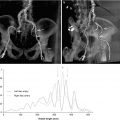
Fig. 15.1
Basic principles of positron emission tomography. PET tracers release protons which quickly collide with bystander electrons and annihilate resulting in the release of two 511 keV photons at 180° to one another. The simultaneous detection of these photons by the detector rings allows the origin of the annihilation to be pinpointed along the line or response
PET imaging uses a dedicated camera system that involves multiple circumferential rings of detectors completely surrounding the patient. These detectors are made up of scintillation crystals, which release light when hit by a photon and convert this light into an electrical signal. PET imaging utilizes the concept that two 511 keV photons detected in close temporal proximity (within 6–12 ns) by two opposed detectors in the ring are likely to have originated from a single annihilation event in the body somewhere in a line between them or the line of response. Such simultaneous detections are termed coincidences, and these events are used to build a PET image that maps the site of tracer accumulation [3].
The resultant images provide detailed functional data regarding the biochemical process being studied; however, PET scans are limited by a lack of spatial resolution. Recently this issue has been addressed combining low resolution functional PET data with high resolution anatomical data provided by CT. PET/CT scanners incorporating both PET and CT within the same gantry have become the standard equipment of clinical PET practice. Patients lie in the same position for both scans, which allows the PET and CT scans to be superimposed upon one another. This serves two purposes: firstly, the CT can be used to perform accurate attenuation correction of the PET image; and secondly, co-registration allows precise localization of tracer uptake within small structures such as the aortic valve (Fig. 15.2).
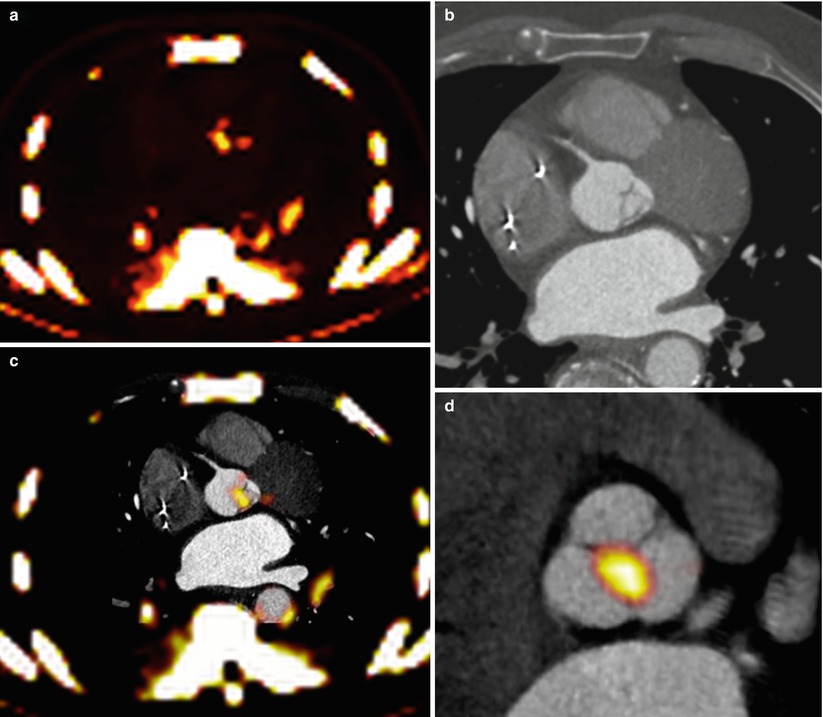
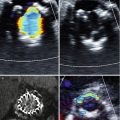
Fig. 15.2
Fusion of PET/CT scans for the assessment of aortic valve activity. (a) PET scan (axial view) showing activity of 18F-NaF in the thorax. (b) CT scan acquired at the same level during the same scan. (c) Fusion of the PET and CT scans identifies increased uptake in the valve. (d) The PET/CT image has been reorientated to provide short-axis views of the valve in a patient with aortic sclerosis. Note increased uptake in the non-coronary cusp
To date, PET/CT in aortic stenosis has focused on 18F-fluorodeoxyglucose (18F-FDG) and 18F-sodium fluoride (18F-NaF) as markers of inflammation and calcification, respectively. Tracer development has largely been driven by oncology studies (Box 15.1). While both of the above tracers are used commonly to identify malignant lesions and bone metastases, their role in imaging the vasculature has only recently been investigated.
Box 15.1 PET Tracers for Evaluation of Aortic Stenosis
18F-flurodeoxyglucose | Glucose analogue taken up by cells via glucose transport proteins and enters the glycolytic metabolic pathway |
Following initial hexokinase step. 18F-FDG-6-phosphate cannot be metabolized further and becomes trapped, concentrating in cells with high metabolic requirements | |
Thought to incorporate into inflammatory areas such as the calcifications of aortic stenosis | |
18F-sodium fluoride | Tracer directly produced in cyclotrons and does not require further labeling for use as IV injected PET imaging agent |
Incorporates into bone crystals via an exchange with hydroxyl groups ([hydroxyapatite crystal of bone, (Ca10(PO4)6OH2] → [fluoroapatite (Ca10(PO4)6F2)]) | |
Hydroxyapatite key component of calcification in aortic stenosis |
18F-Fluorodeoxyglucose
18F-fluorodeoxyglucose (18F-FDG) is a glucose analogue that is taken up into cells by glucose transport proteins and enters the glycolytic metabolic pathway. Following the initial hexokinase step, 18F-FDG-6-phosphate cannot be metabolized further and becomes trapped, concentrating in cells with high metabolic requirements. Increased uptake is therefore observed in malignant cells but also in arterial macrophages, which have increased metabolic requirements compared to other cells in the vasculature. This has been the basis for vascular PET imaging using 18F-FDG, which has become an established means of quantifying vascular inflammation in both the aorta and carotid arteries [4, 5]. Rudd and colleagues first established that 18F-FDG uptake was increased in symptomatic carotid plaque following transient ischemic attack compared to contralateral lesions [5]. Subsequently the level of 18F-FDG activity has been shown to correlate with plaque macrophage burden [6] and hypoxia [7]. Arterial uptake of 18F-FDG has now been extended to the aorta, femoral, and iliac vessels displaying excellent reproducibility [8, 9] and has demonstrated considerable promise as a means of assessing novel anti-inflammatory atherosclerotic agents. Tahara and colleagues demonstrated that simvastatin significantly reduced carotid 18F-FDG uptake after 3 months of treatment. More recently 18F-FDG has been used to study a novel cholesteryl ester transfer protein (CETP) inhibitor, dalcetrapib, that appeared to result in a reduction in the carotid plaque signal [10].
18F-Sodium Fluoride (18F-NaF)
18F-sodium fluoride (18F-NaF) is a tracer that is directly produced in medical cyclotrons and does not require further labeling to an additional molecule for its use as an intravenous PET imaging tracer. It was first introduced as a bone scanning agent approximately 40 years ago. 18F-NaF directly incorporates into bone crystals via an exchange with hydroxyl groups in the hydroxyapatite crystal of bone (Ca10(PO4)6OH2) to form fluorapatite (Ca10(PO4)6 F2). This process can be divided into four stages as originally described by Blau and colleagues [11]. In steps 1 and 2, fluoride moves from the blood through the extracellular space to the shell of bound water around exposed crystals, a process which occurs within minutes of exposure. Step 3 is movement of the tracer on to the crystal surface and probably occurs in hours, while in step 4, 18F-NaF is incorporated into the bone crystal, which takes days or weeks. Uptake in bone is therefore thought to reflect two processes, firstly increased blood flow and secondly osteoblast and osteoclast activity [11–13], which increase the surface area of exposed hydroxyapatite to which 18F-NaF can bind [14]. Given that hydroxyapatite is also a key component of the calcification observed in aortic stenosis, the mechanism of 18F-NaF uptake in the valve is likely to be similar and predominantly reflect calcification activity since blood flow should be constant.
18F-NaF is used clinically for the detection of primary osteoblastic tumors, bone metastases, and conditions associated with high bone turnover such as Paget’s disease [15, 16]. More recently, studies have described 18F-NaF uptake as a marker of calcification within carotid and aortic atheroma [17, 18] and demonstrated an association between activity and cardiovascular risk factors [18]. Our group has also extended this to the coronary arteries, in which increased activity could be localized to discrete regions of coronary plaque and identified patients who had higher rates of prior adverse cardiovascular events and increased Framingham risk scores [19].
Aortic Stenosis
Two studies have now examined uptake of 18F-FDG in aortic stenosis [20, 21] and two have examined 18F-NaF [20, 22]. However, our study was the only one to date to prospectively compare the uptake of both tracers within the same patient population and will be the initial focus of this review. We performed a prospective study of 121 patients, including 81 patients with aortic stenosis (25 mild, 33 moderate, 21 severe), 20 patients with aortic sclerosis, and 20 control patients with normal valves [20]. Patients underwent a full baseline clinical assessment, which included an echocardiographic assessment of valve severity. Subjects then underwent two PET/CT scans: the first 90 min following administration of 200 MBq of 18F-FDG and the second 60 min after injection with 125 MBq of 18F-NaF. Finally, a CT calcium score of the valve and coronary arteries was performed.
Method of Quantification
Quantification of PET activity in the aortic valve presents many challenges. In other tissue, tracer uptake is measured on axial, coronal, or sagittal images. However, the axis of the aortic valve does not lie in any of these standard imaging planes, so that quantification of tracer uptake is not straightforward using traditional methods. In order to overcome this problem, the field of view can be reorientated to provide coaxial, short-axis views of the valve (Fig. 15.2) [20]. Regions of interest can then be placed around its perimeter with greater accuracy and used to measure the mean and maximum standard uptake values (SUV) (Fig. 15.1). The SUV is the decay-corrected tissue uptake divided by the injected dose per body weight. In vascular tissue, it is influenced by tracer blood-pool activity. Therefore, the arterial SUV signal is often normalized to a venous blood SUV (measured in the SVC, which has no atheroma) to provide the tissue-to-background ratio (TBR). Tawakol and colleagues showed that TBR was related more closely to the underlying macrophage content of carotid artery plaque than the uncorrected SUV [6].
Using this technique, we demonstrated excellent measures of inter- and intra-observer reproducibility for quantification of 18F-NaF (intra-class correlation coefficients [ICC] 0.99). However, measurement of 18F-FDG was more challenging still. Glucose is the predominant energy source for the myocardium so that intense uptake of 18F-FDG is frequently observed that can spill into the plane of the aortic valve and contaminate its signal. We therefore employed stringent dietary restrictions (patients were asked to avoid ingestion of all carbohydrate for 24 h prior to the scan) in an attempt to shift the myocardium towards a fatty acid metabolism and reduce its 18F-FDG uptake. However, even despite these precautions, measures of reproducibility were poor using whole valve methods with regions of interest placed around the perimeter of the valve. We therefore adopted a second approach in which these regions were restricted to the center of the valve and well away from the myocardial signal. This resulted in a significant improvement in measures of reproducibility (ICC >0.90) without appearing to underestimate valve activity. Interestingly, Marincheva-Savcheva and colleagues independently settled on a similar center-valve technique when they approached the same problem (see below) [21].
Tracer Uptake at Different Stages of Aortic Stenosis Severity
We have observed that there is a relationship between tracer uptake and severity of aortic stenosis with both 18F-FDG and 18F-NaF. 18F-FDG was observed in a diffuse pattern across the valve. Uptake was increased in patients with both aortic sclerosis (max TBR: median 1.47 [IQR 1.31–1.61], p < 0.001) and aortic stenosis (1.57 [1.44–1.68]; p < 0.001) compared to control subjects (1.27 [1.21–1.40]). However, in our study, 18F-FDG activity rose progressively in patients with mild (1.44 [1.37–1.63]), moderate (1.58 [1.41–1.65]), and severe aortic stenosis (1.65 [1.55–1.85]) consistent with a modest yet sustained increase in inflammation with disease severity, even among those with advanced disease (r 2 = 0.218, p < 0.001).
Related posts:
 Transcatheter Aortic Valve Replacement: Current Evidence from Large Multicenter Registries
 Transcatheter Aortic Valve Replacement: An Interventionist’s View
 MRI Evaluation of Aortic Stenosis
 Fusion Imaging for TAVR
 Aortoiliofemoral Assessment: MDCT
 Valve-in-Valve for Transcatheter Aortic Valve Replacement: Do Imaging Requirements Change?
Stay updated, free articles. Join our Telegram channel

Full access? Get Clinical Tree


