Computed tomographic perfusion (CTP) imaging is an advanced modality that provides important information about capillary-level hemodynamics of the brain parenchyma. CTP can aid in diagnosis, management, and prognosis of acute stroke patients by clarifying acute cerebral physiology and hemodynamic status, including distinguishing severely hypoperfused but potentially salvageable tissue from both tissue likely to be irreversibly infarcted (“core”) and hypoperfused but metabolically stable tissue (“benign oligemia”). A qualitative estimate of the presence and degree of ischemia is typically required for guiding clinical management. Radiation dose issues with CTP imaging, a topic of much current concern, are also addressed in this review.
The imaging management of acute ischemic stroke remains challenging both diagnostically and therapeutically. Intravenous tissue plasminogen activator (tPA) (to be used within 4.5 hours of stroke onset based on the 2008 European Cooperative Acute Stroke Study [ECASS III] ) and the MERCI clot retrieval device (to be used within 9 hours of stroke onset) are the only treatments currently approved by the Food and Drug Administration (FDA) for acute stroke. The only imaging modality currently required before intravenous tPA administration is unenhanced head computed tomography (CT), used to exclude intracranial hemorrhage (an absolute contraindication) and infarct size greater than one-third of the middle cerebral artery (MCA) territory (a relative contraindication, and predictor of increased hemorrhagic risk following tPA administration). The limited time window for intravenous (IV) tPA administration (which remains 3 hours on the package insert), delays in transportation and triage, and multiple contraindications to thrombolysis, however, all limit the use of intravenous tPA to typically less than 5% of patients admitted with ischemic stroke.
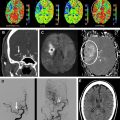
CT perfusion (CTP) expands the role of CT in the evaluation of acute stroke by providing physiologic insights into cerebral hemodynamics, and in so doing complements the strengths of CT angiography (CTA) by determining the consequences of vessel occlusions and stenoses ( Fig. 1 ). Acute ischemic stroke is a disorder of blood flow to the brain, and its characterization and management typically require an answer to the following 4 critical questions :
- •
Is there hemorrhage that explains the symptoms or excludes lytic therapies?
- •
Is there intravascular thrombus that can be targeted for thrombolysis?
- •
Is there a “core” of critically ischemic infarcted tissue, and if so, how large?
- •
Is there a “penumbra” of severely ischemic but potentially viable tissue?
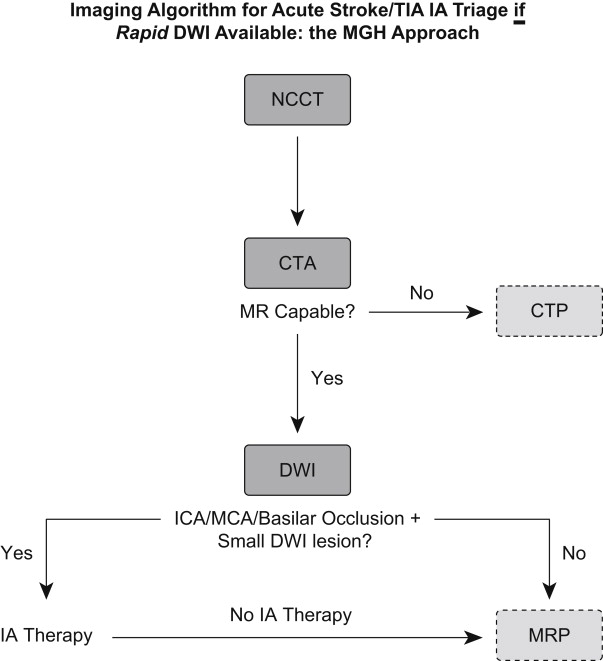
CTP can help to address the latter 2 of these questions, whereas unenhanced CT and CTA can address the first and second, respectively.
CTP is fast, increasingly available, safe when performed correctly, and affordable. It typically adds no more than 5 minutes to the time required to perform a standard unenhanced head CT, and does not hinder IV thrombolysis, which can be administered (with appropriate monitoring) directly at the CT scanner table immediately following completion of the unenhanced scan. Like diffusion-weighted imaging (DWI) and MR perfusion-weighted imaging (PWI), CTP has the potential to serve as a surrogate marker of stroke severity, likely exceeding the National Institutes of Health Stroke Scale (NIHSS) score or Alberta Stroke Program Early CT Score (ASPECTS) as a predictor of outcome. Because of these advantages, advanced CT imaging could have important implications for the management of stroke patients worldwide.
Technical considerations of CTP
Acute Stroke CT Imaging Protocol
At a recent meeting of stroke radiologists, emergency physicians, neurologists, and National Institutes of Health (NIH) administrators in Washington, DC, sponsored by the NIH and the American Society of Neuroradiology, both the technical and clinical issues regarding advanced acute stroke imaging were discussed. A position paper of the expert consensus achieved was published simultaneously in the American Journal of Neuroradiology and Stroke . In these articles, expert recommendations for minimum required standards of CT and MR image acquisition were set forth, although standardization and validation of postprocessing algorithms and, hence, image interpretation, has yet to be reached.
CT-only imaging protocols for complete acute stroke evaluation typically have 3 components: unenhanced CT, an “arch-to-vertex” CTA, and dynamic first-pass cine CTP.
The major role of unenhanced CT in IV thrombolysis triage, as noted previously, is to exclude hemorrhage before treatment. A large, greater than one-third MCA territory hypodensity at presentation is generally considered to reflect irreversible ischemia, portending a poor outcome regardless of treatment, and therefore a contraindication to thrombolysis. Despite advances in resolution, coverage, and reduced radiation dose, unenhanced head CT remains suboptimal in its ability to correctly subtype stroke, localize embolic clot, predict outcome, or assess hemorrhagic risk. Early ischemic signs of stroke are often absent or subtle, and their interpretation is prone to significant inter- and intraobserver variability.
When CTA is performed, however, the source images from the CTA vascular acquisition (CTA-SI) offer additional clinically valuable data concerning not only the caliber of the head and neck vessels but also the tissue level perfusion. The potential utility of the CTA-SI data in the assessment of brain parenchymal ischemia arises from its visualization of bulk collateral circulation—typically blood flow rather than blood volume weighted with newer generation multidetector row CT (MDCT) scanners—and is discussed in further detail in the following sections.
CTP Acquisition
The cine acquisition of perfusion data forms the final step in the CT imaging evaluation of acute stroke. With dynamic CTP, a contrast bolus of 35 to 45 mL per imaging volume (“slab”) is administered via power injector at a rate of 4 to 7 mL/s, with a saline “chaser” of 20 to 40 mL at the same rate. Typically a more rapid injection rate results in maximal but brief peak enhancement, compatible with cine protocols having a rapid data collection of 1 image per second, whereas a slower injection rate results in a somewhat lower but more prolonged plateau of enhancement, preferable for cine protocols with a lower frequency of data collection, such as “toggle table” or “shuttle mode” protocols acquired at 1 image every 3 seconds.
Acquisition typically begins 5 seconds after the start of contrast administration. With current-generation scan protocols, routine acquisition times have increased from the 45 seconds of early protocols, to greater than 66 to 75 seconds at present. The volume of brain tissue included in a first pass cine perfusion CT study is constrained in the craniocaudal direction by the width of the CT detector. Hence, the z-axis coverage of each acquisition depends on the manufacturer and generation of the CT scanner. This limitation arises from the routine rapid cine acquisition rate of 1 image per second performed at a fixed table position (ie, no table movement). The detector configuration can be varied, so that different slice thicknesses can be obtained simultaneously. For example, with a standard 16-detector row scanner, a 2-cm slab can be obtained consisting of either 2 10-mm or 4 5-mm thick slices. With a standard 64-detector row scanner, an approximately 3.4- to 4-cm z-direction slab can be acquired, per injection.
The maximum degree of vertical coverage could potentially be doubled for each bolus using a “shuttle-mode” or “toggle table” technique, in which the scanner table moves back and forth, switching between 2 different axial cine views at 2 different levels, separated by the z-direction detector width, albeit at a reduced temporal resolution of data acquisition, so as to permit sufficient time for table motion. Alternatively, 2 boluses can be used to acquire 2 slabs of CTP data at different levels, doubling the overall coverage, but (unlike shuttle mode) requiring twice the contrast and twice the radiation dose. More recently, helical shuttle mode techniques have been developed that permit more frequent temporal sampling per level, with a continuous “ribbon” of acquisition, and hence increased z-direction coverage. For example, a 64-detector row scanner with a 4-cm detector can provide 12 cm of cranial-caudal coverage using helical shuttle mode, with a temporal resolution of less than 3 seconds between serial images at a given z-level. Finally, the newest generation of 256 to 320 or more detector row scanners can provide as much as 16 cm of vertical, high temporal resolution coverage per gantry rotation.
Comparison with MR-PWI
Advantages
Quantitation and resolution
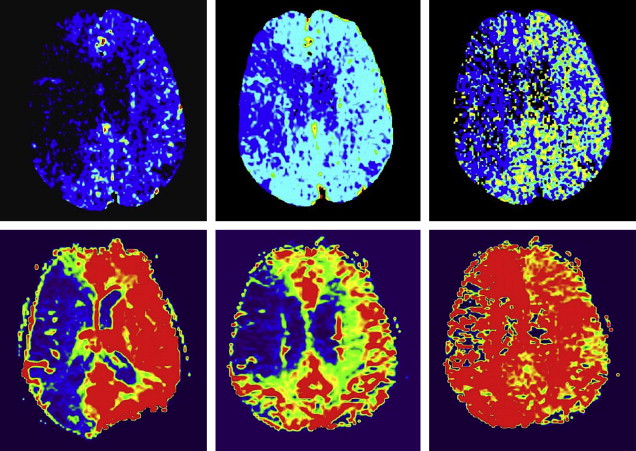
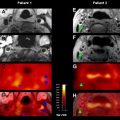
While CTP and MR-PWI both attempt to evaluate capillary-level hemodynamics, their differences should be considered. Dynamic susceptibility contrast (DSC) MR-PWI techniques rely on the T2* effect induced in adjacent tissues by high concentrations of intravenous gadolinium; CTP relies on direct visualization of intravascular contrast material. The linear relationship between contrast concentration and CT attenuation more readily lends itself to quantitation, which is not easily achieved with MR-PWI. In addition, CTP has greater spatial (but not contrast) resolution compared with MR-PWI. These factors contribute to the possibility that visual evaluation of core/penumbra mismatch may be more quantitatively reliable with CTP than with MR perfusion (MRP) ( Fig. 2 ).
Availability and safety
CT also benefits from the practical availability and relative ease of scanning, particularly when dealing with critically ill patients and the attendant monitors or ventilators. CT may also be the only option for a subgroup of patients with an absolute contraindication to MR scanning, such as a pacemaker, and is a safe option when the patient cannot be screened for MR safety. For patients with borderline glomerular filtration rate (GFR 45–60) in whom perfusion data is important to patient management, the risk-to-benefit ratio of administering iodinated contrast is likely less than that of gadolinium.
Disadvantages
Limited coverage
A major disadvantage of some CTP acquisitions is their relatively limited z-direction coverage of 2 to 4 cm, whereas MR-PWI is typically capable of delivering information about the whole brain. Of importance, however, the 8- to 16-cm coverage offered by most newer MDCT scanners, with or without “shuttle mode” capability, is sufficient to image the entire anterior circulation territory (approximately 8 cm cranial-caudal), which is typically the critical region for stroke evaluation.
Detection of microbleeds
Another disadvantage of using CT rather than MR imaging for stroke assessment is CT’s inability to detect cerebral microbleeds. Microbleeds detected on gradient echo T2*-weighted MR imaging, however, have been shown not to be a contraindication to thrombolysis.
Iodinated contrast
The authors’ current protocol employs 35 to 45 mL iodinated contrast material for each CTP cine acquisition, in addition to the contrast required for the CTA. This additional contrast dose could be significant in some patients, particularly in the relatively older stroke prone population at risk for hypertension, diabetes, and atheromatous disease. Total dose may be even greater if the patient subsequently requires additional contrast for endovascular intervention. However, nonionic iodinated contrast does not worsen stroke outcome.
Complex postprocessing
Postprocessing of CTA and CTP images is more labor intensive than postprocessing of MR angiography (MRA) and MRP images; however, with automation, training, and quality control, 3-dimensional reconstructions of CTA datasets and quantitative CTP maps can be produced rapidly and reliably. Automated postprocessing software of CT perfusion data in acute stroke patients is increasingly simplifying the complexity of the postprocessing.
Ionizing radiation
CTA/CTP also requires ionizing radiation, further discussed here.
Comparison with MR-PWI
Advantages
Quantitation and resolution
While CTP and MR-PWI both attempt to evaluate capillary-level hemodynamics, their differences should be considered. Dynamic susceptibility contrast (DSC) MR-PWI techniques rely on the T2* effect induced in adjacent tissues by high concentrations of intravenous gadolinium; CTP relies on direct visualization of intravascular contrast material. The linear relationship between contrast concentration and CT attenuation more readily lends itself to quantitation, which is not easily achieved with MR-PWI. In addition, CTP has greater spatial (but not contrast) resolution compared with MR-PWI. These factors contribute to the possibility that visual evaluation of core/penumbra mismatch may be more quantitatively reliable with CTP than with MR perfusion (MRP) ( Fig. 2 ).
Availability and safety
CT also benefits from the practical availability and relative ease of scanning, particularly when dealing with critically ill patients and the attendant monitors or ventilators. CT may also be the only option for a subgroup of patients with an absolute contraindication to MR scanning, such as a pacemaker, and is a safe option when the patient cannot be screened for MR safety. For patients with borderline glomerular filtration rate (GFR 45–60) in whom perfusion data is important to patient management, the risk-to-benefit ratio of administering iodinated contrast is likely less than that of gadolinium.
Disadvantages
Limited coverage
A major disadvantage of some CTP acquisitions is their relatively limited z-direction coverage of 2 to 4 cm, whereas MR-PWI is typically capable of delivering information about the whole brain. Of importance, however, the 8- to 16-cm coverage offered by most newer MDCT scanners, with or without “shuttle mode” capability, is sufficient to image the entire anterior circulation territory (approximately 8 cm cranial-caudal), which is typically the critical region for stroke evaluation.
Detection of microbleeds
Another disadvantage of using CT rather than MR imaging for stroke assessment is CT’s inability to detect cerebral microbleeds. Microbleeds detected on gradient echo T2*-weighted MR imaging, however, have been shown not to be a contraindication to thrombolysis.
Iodinated contrast
The authors’ current protocol employs 35 to 45 mL iodinated contrast material for each CTP cine acquisition, in addition to the contrast required for the CTA. This additional contrast dose could be significant in some patients, particularly in the relatively older stroke prone population at risk for hypertension, diabetes, and atheromatous disease. Total dose may be even greater if the patient subsequently requires additional contrast for endovascular intervention. However, nonionic iodinated contrast does not worsen stroke outcome.
Complex postprocessing
Postprocessing of CTA and CTP images is more labor intensive than postprocessing of MR angiography (MRA) and MRP images; however, with automation, training, and quality control, 3-dimensional reconstructions of CTA datasets and quantitative CTP maps can be produced rapidly and reliably. Automated postprocessing software of CT perfusion data in acute stroke patients is increasingly simplifying the complexity of the postprocessing.
Ionizing radiation
CTA/CTP also requires ionizing radiation, further discussed here.
Radiation dose in CTP: facts, publicity, and response
On October 8, 2009, the US FDA issued an initial notification regarding a safety investigation of facilities performing CTP scans. Because of incorrect settings on the CT scanner console of a single facility, more than 200 patients over a period of 18 months received radiation doses that were approximately 8 times the expected level. Approximately 40% of the patients lost patches of hair as a result of the overdoses. These incidents followed another unrelated incident in a community hospital in Arcata, California, in 2008, where a CT technologist activated a CT scan 151 times over the same region of the head of a 2-year-old.
These incidences highlight the importance of CT quality assurance programs. Such programs should include regular reviews of CT protocols by a specialized CT physicist, testing protocols on dose phantoms, and monitoring of actual doses received by patients for each type of CT protocol. Radiologists and technologists should be familiar with the dose indices displayed on the CT scanner console and should include the volumetric CT dose index (CTDI vol ) and the dose-length product (DLP). The CTDI vol , represents the average dose delivered within the reconstructed section. The DLP is the CTDI vol multiplied by the scan length expressed in centimeters. DLP can be used to assess the overall radiation burden in a CT study. In response to the Arcata incident, the state of California passed a landmark dose reporting law in November 2010; it mandates the report of CTDI/DLP doses in all CT studies, and that overdoses be reported to the patient, the referring MD, and the state of California. FDA initiatives during 2010 and endorsed by MITA (the Medical Industry and Technology Alliance) will likely result in dose safeguards built into CT scanner designs, dose recording for all CT studies, and tools to track the imaging history of each patient. Moreover, the American College of Radiology Dose Index Registry will monitor the cumulative dose information for each patient.
All CT protocols should respect the ALARA (As Low As Reasonably Achievable) principle. Expert consensus and over a decade of experience suggest that CTP studies should be performed at 80 kVp and no more than 200 mAs. When using such parameters, the effective radiation dose associated with a single slab CTP study is approximately equal to that of an unenhanced head CT, roughly 2 to 3 mSv. For comparison, the background radiation for a person living in Boston for a year is approximately 3 mSv. The authors’ current shuttle mode CTP scanning protocol at Massachusetts General Hospital results in a radiation exposure, CTDI vol , of 0.35 Gy, a value that is substantially below the FDA recommended maximum recommended radiation dose of 0.5 Gy. Note that this kVp setting is lower than that used for standard CT studies (120–140 kVp), and was selected primarily because the conspicuity of the iodine contrast agent is much greater at 80 kVp than at 140 kVp, resulting in improved CTP map image quality at a markedly lower radiation dose.
CTP methodology: general principles
Perfusion-weighted CT and MR, in distinction to those of MR and CTA which detect bulk vessel flow, are sensitive to capillary, tissue-level blood flow. The generic term “cerebral perfusion” refers to tissue level blood flow in the brain. This flow can be described using a variety of parameters, which primarily include cerebral blood flow (CBF), cerebral blood volume (CBV), and mean transit time (MTT). Definitions of these parameters are as follows.
CBV is defined as the total volume of blood in a given unit volume of the brain. This definition includes blood in the tissues, as well as blood in the large capacitance vessels such as arteries, arterioles, capillaries, venules, and veins. CBV has units of milliliters of blood per 100 g of brain tissue (ml/100 g).
CBF is defined as the volume of blood moving through a given unit volume of brain per unit time. CBF has units of ml of blood per 100 g of brain tissue per minute (ml/100 g/min).
MTT is defined as the average of the transit time of blood through a given brain region. The transit time of blood through the brain parenchyma varies depending on the distance traveled between arterial inflow and venous outflow, and is measured in seconds. Mathematically, mean transit time is related to both CBV and CBF according to the central volume principle, which states that MTT = CBV/CBF.
“Core” is typically operationally defined as brain likely to be irreversibly infarcted at presentation, despite early recanalization (and which indeed may be at increased risk for hemorrhagic transformation with early robust reperfusion), and “penumbra” as the functionally ischemic but potentially salvageable “at-risk” brain parenchyma ; the latter is to be distinguished from “benign oligemia” reflecting hypoperfused but functionally viable tissue. “Mismatch” is defined as the difference in volume and location between core and penumbra, although as currently measured in routine practice, “penumbra” often includes regions of benign oligemia as defined by other transit time measures such as TTP or Tmax (time to peak, or maximal, enhancement). A mismatch of greater than 20% is typically, arbitrarily, considered to represent a clinically significant penumbra for both research and clinical management; major trials using this definition include the Diffusion-weighted imaging Evaluation For Understanding Stroke Evolution (DEFUSE) trial and the Echoplanar Imaging Thrombolytic Evaluation Trial (EPITHET).
CTP theory and modeling
Mathematical Models for CBF and MTT Calculation
The two major mathematical approaches involved in calculating CBF and MTT are the deconvolution and nondeconvolution-based methods (for a comprehensive review see Konstas and colleagues ). Deconvolution techniques are technically more demanding and involve more complicated and time-consuming processing, whereas nondeconvolution techniques are more straightforward, but depend on simplified assumptions regarding the underlying vascular architecture. As a result, the interpretation of studies based on nondeconvolution methods may be less reliable in some situations.
Nondeconvolution-based models
Nondeconvolution methods are based on the application of Fick’s principle of conservation of mass to a given Region of Interest (ROI) within the brain parenchyma. After a time-density curve (TDC) is derived for each pixel, CBF can be calculated based on the concept of conservation of flow using the maximal slope method. The ease of the computation of this differential equation, however, is highly dependent on the assumptions made regarding inflow and outflow in the region. The no venous outflow assumption of nondeconvolution methods is clearly an oversimplification, and these methods yield relative, rather than absolute, perfusion measurements, making interpatient or interinstitutional comparison of results difficult. A recent study suggested that the maximal slope method yields the same results with deconvolution methods in terms of therapy decision making in acute stroke.
Deconvolution-based models
When a contrast bolus arrives in an artery supplying a given region of the brain, it undergoes delay and dispersion. Deconvolution attempts to correct for this effect. Deconvolution of the arterial input function and tissue curves can be accomplished using a variety of techniques. Singular value decomposition (SVD) has yielded the most robust results from all the deconvolution methods used to calculate CBF and has gained widespread acceptance. The creation of accurate quantitative maps of CBF, CBV, and MTT using deconvolution methods has been validated in several studies. Once CBF and CBV are known, MTT can be calculated from the ratio of CBV and CBF, using the central volume theorem.
Commercial software suppliers use different mathematical methods. In the past, some have incorporated the maximal slope method whereas others have typically used deconvolution techniques. Although deconvolution methods are theoretically superior to nondeconvolution methods, the full clinical implication of using these different models has yet to be established and standardized by the stroke imaging community.
The creation of accurate, quantitative maps of CBV, CBF, and MTT using the deconvolution method has been validated in several studies. Specifically, validation has been accomplished by comparison with xenon, positron emission tomography (PET), and MRP in humans, as well as with microspheres in animals.
CTP postprocessing
General Principles
In urgent clinical cases, perfusion changes can often be observed immediately following scanning by direct visual inspection of the axial source images at the CT scanner console. Soft copy review at a workstation using “movie” or “cine” mode can reveal relative perfusion changes over time. It has been suggested that arterial-phase CTP source images (CTP-SI) closely correlate with CTP-CBF and venous-phase CTP-SI with CBV; hence a visual inspection of the CTP-SI can determine penumbra, core, and mismatch. However, advanced postprocessing is required to appreciate subtle changes and to obtain quantification.
Axial source images acquired from a cine CT perfusion study are networked to a free-standing workstation for detailed analysis, including construction of CBF, CBV, and MTT maps. Postprocessing can be manual, semi-automated, or fully automated.
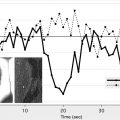
The computation of quantitative first-pass cine cerebral perfusion maps typically requires some combination of the following user inputs ( Fig. 3 ).
- •
Arterial Input Function ( AIF ): A small ROI is placed over the central portion of a large intracranial artery, preferably an artery orthogonal to the imaging plane to minimize “dilutional” effects from volume averaging. An attempt should be made to select an arterial ROI with maximal peak contrast intensity.
- •
Venous Outflow Function ( VOF ): A small venous ROI with similar attributes is selected, most commonly at the superior sagittal sinus. The purpose of the VOF is to serve as a reference for normalization of the quantitative CTP parameter values, relative to an averaged maximum intravascular contrast measurement. Because veins (particularly the posterior superior sagittal sinus) are typically larger than arteries, the venous TDC is not as subject to partial volume average as is the arterial TDC.
- •
Baseline : The baseline is the “flat” portion of the arterial time density curve, prior to the upward sloping of the curve caused by contrast enhancement. The baseline typically begins to increase after 4 to 6 seconds.
- •
Post-Enhancement Cutoff : This refers to the “tail” portion of the TDC, which may slope upwards toward a second peak value if recirculation effects are present. When such upward sloping at the “tail” of the TDC is noted, the data should be truncated to avoid including the recirculation of contrast. The perfusion analysis program will subsequently ignore data from slices beyond the cutoff.
It is worth noting that major variations in the input values described may not only result in perfusion maps of differing image quality, but potentially in perfusion maps with variation in their quantitative values for CBF, CBV, and MTT. As previously noted, special care must be taken in choosing an optimal VOF, because that VOF value may be used to normalize the quantitative parameters.
Although the precise choice of CTP scanning level is dependent on both the clinical question being asked and on other available imaging findings, an essential caveat in selecting a CTP slice is that the imaged level must contain a major intracranial artery. This caveat is necessary to assure the availability of an AIF, to be used for the computation of perfusion maps using the deconvolution software.
Correction for delay and dispersion of the AIF: why it matters
Calculation of CBF requires knowledge of the AIF, which in practice is estimated from a major artery, assuming that it represents the exact and only input to the tissue voxel of interest, with neither “delay” nor “dispersion.” There are several clinical situations, however, where the AIF TDC will lag, and the tissue TDC will lag behind the AIF curve (“delay”). AIF delay can occur due to extracranial causes (atrial fibrillation, severe carotid stenosis, poor left ventricular ejection fraction) or intracranial causes (proximal intracranial obstructive thrombus with poor collaterals). Moreover, in such cases the contrast bolus forming the AIF can spread out over multiple pathways proximal to the tissue ROI (“dispersion”).
Delay and dispersion do not have the same hemodynamic significance or clinical implications in acute versus chronic vascular conditions. In chronic vascular conditions such as an extracranial stenosis, delay and dispersion can result in grossly underestimated CBF and overestimated MTT, most notably in regions of nonischemic hypoperfusion (benign oligemia). These changes indicate the hemodynamic significance of the stenosis, but can be misleading clinically in that inexperienced readers may interpret them as the hallmark of an acute ischemic stroke (especially when the distinction between true ischemia and benign oligemia is unclear). As a result, they need to be corrected for. In acute ischemic stroke, however, delay and dispersion are integral to the underlying pathophysiological hemodynamics, and therefore need not necessarily be corrected for so that appropriate clinical interpretation is possible. In practice, many acute stroke patients have associated chronic carotid stenosis, and hence the “truth” lies somewhere in between. Although it can be argued that delay and dispersion should be corrected for so that MTT and CBF maps more accurately reflect physiologic ground truth, such correction can make MTT and CBF maps look too “normal.” In any case, commercial software packages with delay-sensitive deconvolution algorithms can overestimate penumbra (ie, MTT or CBF lesion volume) and consequently final infarct volume, whereas penumbra estimated with delay-insensitive software generally correlates better with final infarct volume. Delay-sensitive methods might also overestimate CBV lesion size in some patients with concomitant intra- or extracranial severe hemodynamic delay ( Fig. 4 ).
Several approaches have been used to minimize the effects of delay and dispersion in deconvolution methods. A detailed description is beyond the scope of this article. (For a review of the methods used for correcting for delay, see Konstas and colleagues. )
Clinical applications of CTP
Current indications for performing CTP imaging of acute stroke include: (1) when DWI is unavailable, (2) when the (a) diagnosis, (b) type of stroke, or (c) extent of ischemia is uncertain based on the clinical examination and other imaging, or (3) for postaneurysmal subarachnoid hemorrhage (SAH) vasospasm risk assessment (given cumulative radiation dose issues, performing more than 2 or 3 serial CTPs per admission is ill advised). Although to date there is no high level of evidence to suggest that perfusion scanning has a direct role in the decision to administer IV or intra-arterial (IA) thrombolytic therapy, potential future indications for perfusion imaging in the first 9 to 12 hours after stroke onset include: (1) exclusion of patients most likely to hemorrhage and inclusion of patients most likely to benefit from thrombolysis, (2) extension of the time window beyond 4.5 hours for IV and 6 hours for anterior circulation IA thrombolysis, (3) triage to other available therapies, such as hypertension or hyperoxia administration, (4) disposition decisions regarding neurologic intensive care unit (NICU) admission or emergency department discharge, and (5) rational management of “wake-up” strokes, for which precise time of onset is unknown.
The results of the 2008 ECASS expanded the 3-hour time window for intravenous thrombolysis and revealed that although safe and effective up to 4.5 hours after stroke onset, treatment benefits roughly half as many patients as those treated within 3 hours. Hence, the ratio between the hemorrhagic risks of treatment versus the potential clinical benefits becomes a more critical consideration as the time window for therapy is expanded with newer intravenous and IA techniques. It is the mismatch between the size of the infarct core (proportional to hemorrhagic risk) and the size of the ischemic penumbra (proportional to potentially salvageable tissue), as determined by CTP, that provides an imaging measure of this risk-to-benefit ratio. Evidence suggests that core/penumbra mismatch may persist for up to 24 hours in some patients.
Despite this evidence, some large clinical trials that used mismatch as patient selection criteria, such as the Desmoteplase In Acute ischemic Stroke (DIAS)-2 trial, which used both CTP and MRP up to 9 hours after stroke onset, have failed to show a benefit of treatment. The failure of DIAS-2 to demonstrate a role of mismatch imaging for patient selection in IV thrombolysis may have been, in part, related to technical differences between CTP and MRP, and the lack of standardization and validation of these methods (see later discussion).
Image interpretation: infarct detection with CTA-SI
Several groups have suggested that CTA source images, like DWI, may sensitively delineate tissue destined to infarct despite successful recanalization. The superior accuracy of CTA-SI in identifying infarct “core” compared with unenhanced CT has been unequivocally established in multiple studies. Theoretical modeling indicates that early generation CTA-SI—assuming an approximately steady state of contrast in the brain arteries and parenchyma during image acquisition — are predominantly blood volume weighted rather than blood flow weighted. However, newer, faster MDCT CTA-SI protocols, such as those used in 64-slice scanners, with injection rates up to 7 mL/s and short preparation delay times of 15 to 20 seconds, change the temporal shape of the “time-density” infusion curve, eliminating a near-steady state during the timing of the CTA-SI acquisition. Hence, with the current generation of CTA protocols on faster state-of-the art MDCT scanners, the CTA-SI maps have become significantly more flow weighted.
With early-generation CTA protocols, in the absence of early recanalization, CTA-SI typically defines minimal final infarct size and, hence, like DWI, can be used to identify “infarct core” in the acute setting ( Fig. 5 ). Coregistration and subtraction of the conventional, unenhanced CT brain images from the axial, postcontrast CTA-SI should result in quantitative blood volume maps of the entire brain. CTA-SI subtraction maps, obtained by coregistration and subtraction of the unenhanced head CT from the CTA-SI, are particularly appealing for clinical use because, unlike quantitative first-pass CT perfusion maps, they provide whole brain coverage. A pilot study from the authors’ group, on 22 consecutive patients with MCA stem occlusion who underwent IA thrombolysis following imaging, demonstrated that CTA-SI and CTA-SI subtraction maps improve infarct conspicuity over that of unenhanced CT in patients with hyperacute stroke. Concurrent review of unenhanced CT, CTA-SI, and CTA-SI subtraction images may be indicated for optimal CT assessment of hyperacute MCA stroke.
Related posts:
 Imaging Acute Stroke is Rapidly Evolving
 MR Perfusion Imaging in Acute Ischemic Stroke
 Intra-arterial Stroke Therapy: Recanalization Strategies, Patient Selection and Imaging
 Measuring Permeability in Acute Ischemic Stroke
 Noninvasive Carotid Artery Imaging with a Focus on the Vulnerable Plaque
 ASPECTS and Other Neuroimaging Scores in the Triage and Prediction of Outcome in Acute Stroke Patients
Stay updated, free articles. Join our Telegram channel

Full access? Get Clinical Tree


