As endoscopic sinus surgery (ESS) has evolved since its introduction to the United States, so has technology for imaging the sinonasal cavities. Although imaging is most frequently performed for evaluating chronic sinusitis refractory to medical therapy, its uses have expanded beyond inflammatory sinus disease. Multidetector Computed Tomography is the current workhorse for both diagnosis and preoperative planning in prospective ESS patients, while MR imaging remains a complementary tool for evaluating suspected tumors or intracranial and orbital complications of rhinosinusitis. In this article, the authors review current trends and potential future directions in the use of these modalities for sinus imaging.
Key points
- •
Multiplanar computed tomography (CT) imaging in the coronal, axial, and sagittal planes is now commonplace for the assessment of the paranasal sinuses. The addition of sagittal images is particularly helpful for assessing the frontal sinus outflow tract.
- •
Appropriate indications for CT imaging of the paranasal sinuses currently include chronic sinusitis refractory to appropriate medical therapy, recurrent acute or chronic sinusitis, complications of surgery or sinusitis, cerebrospinal fluid (CSF) rhinorrhea, suspicion of invasive fungal sinusitis in immunocompromised patients, tumor surveillance, or surgical planning for new or revision sinus surgery.
- •
In addition to standard radiation dose-reduction strategies, such as adjusting tube voltage, current, or scanner pitch, new techniques, including automated exposure control, automated tube voltage selection, and iterative reconstruction, are commonly used in sinus imaging to help reduce the effective dose while maintaining image quality.
- •
Cone beam CT (CBCT) is becoming increasingly popular for in-office point-of-care imaging of the sinuses and for intraoperative imaging and produces high-resolution images at a substantially reduced dose compared with multidetector CT (MDCT); however, current CBCT scanners still lag behind MDCT in image quality.
- •
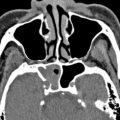
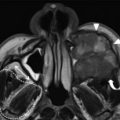
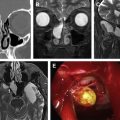
MR imaging remains a complementary imaging tool to CT for sinonasal disease but is indicated and is particularly useful for characterizing sinonasal tumors and for suspected intracranial and orbital complications of rhinosinusitis.
Introduction
Advances in therapeutic and diagnostic technologies over the last 3 decades have fundamentally transformed the way we evaluate and treat diseases of the sinonasal cavities and skull base. Before the popularization of endoscopic sinus surgery (ESS), surgical management of sinus disease primarily focused on open approaches to the maxillary, ethmoid, and frontal sinuses with high complication rates and the possibility of facial incisions. The introduction and development of endoscopic techniques suddenly made it possible to explore and dissect areas in the sinonasal cavities that had been previously inaccessible using safe, minimally invasive approaches. As a result, in the roughly 30 years since it was first introduced in the United States, ESS has become one of the most common otolaryngologic surgical procedures, with an estimated 350,000 sinus surgeries now being performed in the United States annually; the application of endoscopic techniques now includes treatment of sinonasal and skull base tumors and repair of skull base defects.
Over the same period of time, the evolution in imaging technology used for evaluating the sinonasal cavities has, in many ways, paralleled the development of ESS. Before the introduction of computed tomography (CT) for routine clinical imaging, the primary modalities available for visualizing the sinonasal cavities were plain radiography and polytomography. The standard 4-view sinus series of the time was generally adequate for the purposes of depicting sinus size, assessing septal deviation, and demonstrating opacification and/or the presence of fluid levels in the sinuses. However, these studies were actually fairly poor in their ability to accurately diagnose sinusitis and provided only limited anatomic information.
For a short time, polytomography was popular for sinus imaging because of its improved ability, compared with plain radiography, to demonstrate fine bony architecture. Polytomography was actually the imaging technique used by Messerklinger and his colleagues in Europe in their initial descriptions of nasal endoscopy. However, background blurring from structures above and below the focal plane frequently prevented tomograms from being able to adequately depict small bony structures in the area of the ostiomeatal complex (OMC), which is the primary region of interest for practitioners of ESS. At roughly the same time that ESS was taking root, CT was emerging as a fledgling clinical imaging technology and was quickly recognized as being an ideal planning tool for ESS. As a result, over the last 30 years, CT and, more recently, MR imaging have come to play a key role not only in the diagnosis of sinonasal disease but also in its management. Otolaryngologists now routinely order imaging studies to aid in the diagnosis of rhinosinusitis, sinonasal tumors, and cerebrospinal fluid (CSF) leaks; for help with preoperative planning and intraoperative guidance during ESS; and for disease surveillance following surgical and nonsurgical treatment of skull base tumors.
The goal of this article is to discuss current trends in the use of imaging in the paranasal sinuses, including an overview of modern imaging techniques, such as CT, cone beam CT (CBCT), MR imaging; strategies for radiation dose reduction in sinus CT; indications for sinonasal imaging; image-guided surgery; and potential areas for future development in sinonasal imaging.
Overview of modalities used in modern sinus imaging
Computed Tomography
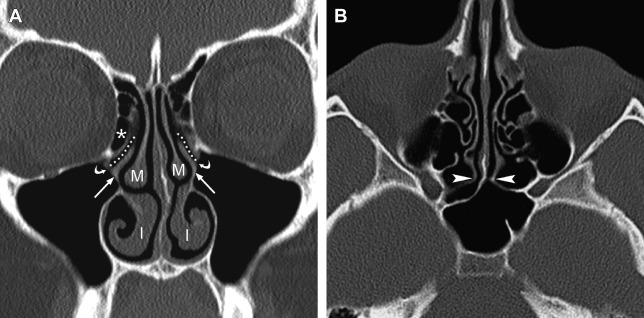
Because of its high spatial resolution and ability to depict fine osseous detail, CT is the imaging test of choice for providing the necessary information for ESS planning, such as the presence of fluid and degree of mucosal thickening, the presence of bone dehiscence or osteitis, and the anatomy of the sinuses, including important sinonasal anatomic variants. In their initial description of CT imaging for ESS, Kennedy and colleagues endorsed acquiring coronal and axial images; these continue to be the workhorse viewing planes for routine sinus imaging today. The coronal plane is generally the preferred orientation for viewing the OMC and other landmarks, such as the skull base, orbital laminae, and orbital floors, whereas the axial plane provides better characterization of the anterior and posterior walls of the frontal sinuses, the sphenoid ostia, and the anatomic relationships between the posterior ethmoid and sphenoid sinuses ( Fig. 1 ).
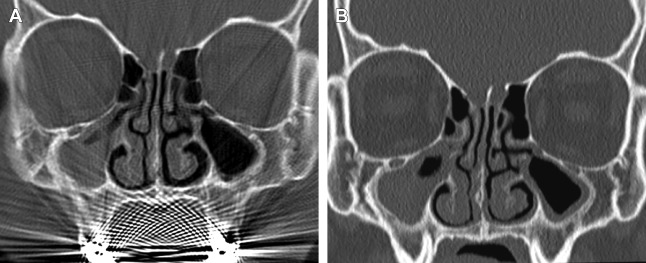
Early generation single-slice CT units required each acquisition plane to be obtained directly, meaning that if one needed images in both the coronal and axial planes, patients essentially had to undergo 2 separate scans, substantially increasing imaging time and doubling the radiation dose compared with a single-plane acquisition alone. In addition, acquisition of direct coronal images traditionally required patients to lie prone in the scanner with their head hyperextended and the scanner gantry angled perpendicular to the infraorbitomeatal line in order to best approximate the true coronal plane of the sinuses. With the technology at that time, it took roughly 2 seconds to generate a single CT image; as a result, a complete coronal scan through the sinuses generally took several minutes to complete. This position was often not well tolerated by patients with limited cervical motion; as a result of this and the long acquisition time, direct coronal scans were particularly susceptible to motion artifacts. In addition, amalgam from dental restoration could produce beam hardening artifacts, which had the potential to significantly obscure sinus anatomy ( Fig. 2 ).
The introduction of spiral CT in the late 1980s and multidetector CT (MDCT) roughly a decade later led to marked improvements in sinus imaging. The ability to perform helical acquisitions significantly decreased scan times and allowed one to acquire volumetric data without anatomic misregistration. This technology ultimately paved the way for the development of 3-dimensional (3D) image-processing techniques, such as multiplanar reformation (MPR) and volume rendering techniques (VRT), which are now commonly used in head and neck imaging. The development of MDCT led to even further reductions in scan times and improvements in spatial resolution because of the increased tissue coverage and the use of smaller detector collimators, which allowed for even higher-quality reformations.
In spite of these advances, as recently as a decade ago, many institutions, including the authors’, were still using protocols that called for direct coronal scanning of the sinuses. Over the last decade, however, with MDCT scanners with 64 or more detector arrays becoming increasingly commonplace, many centers have abandoned the practice of obtaining separate coronal acquisitions. Modern 64-slice MDCT systems can now acquire an entire sinus examination in roughly 5 seconds while producing near isotropic submillimeter voxels, which can be reconstructed at high resolution in any plane. Although MDCT of the paranasal sinuses carries a higher radiation dose compared with the sequential single-slice CT scan obtained with otherwise similar parameters (roughly 20% higher ), with MDCT one need perform a single acquisition, which can be used to create any desired viewing plane, which ultimately translates to an overall radiation dose savings over a traditional 2-plane coronal and axial acquisition.
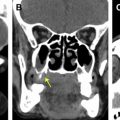
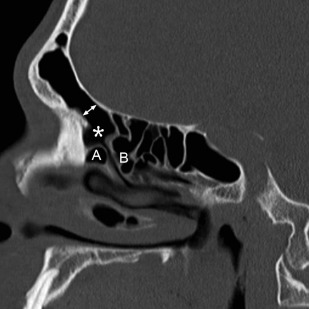
The use of MPR has also led to an increase in use of sagittal reformations for routine viewing. For obvious reasons, direct sagittal imaging was not routinely performed with single-slice scanners, and early attempts at reconstructing nonaxial images from sequenced single-channel helical scans were generally of poor quality, making routine sagittal imaging previously impractical. Today, producing a sagittal MPR is a trivial task; the inclusion of sagittal reconstructions is now a routine practice at many institutions. Sagittal images are particularly useful for evaluating the frontal sinus outflow tract and surrounding ethmoid air cells, including the agger nasi, frontal cells, and the frontal and suprabullar cells ( Fig. 3 ); it has been reported that the addition of sagittal images significantly improves presurgical understanding of the 3D anatomy of the frontal recess and that the additional information provided might alter the surgical approach in more than half of ESS cases compared with having only coronal images alone. Therefore, it is now routine at the authors’ center to reformat all of their sinus CT examinations in the axial, coronal, and sagittal planes.
Dose-reduction strategies in sinus computed tomography
Among the topics of greatest interest in CT imaging currently is that of radiation dose reduction, as we have all become increasingly attuned to the risks associated with exposure to ionizing radiation. In first world countries, CT scanning accounts for 7.9% of the total number of diagnostic medical examinations, yet contributes approximately 47% of the total collective effective dose caused by diagnostic medical imaging. Not surprisingly, the popularization of ESS over the last few decades has led to a significant increase in the number of sinus CTs performed today.
Therefore, significant efforts have gone into developing protocols and technologies designed to reduce to as low as reasonably achievable the radiation dose associated with a sinus CT while maintaining diagnostic image quality. However, given institutional differences in scanner hardware and practice patterns, there is likely significant variation in the protocols and radiation doses from sinus CT between centers. Guidelines regarding dose limits for sinus CT have been published in the European Union recommending a reference CT dose index (CTDI) of 35 milligray (mGy) and dose length product (DLP) of 360 mGy-cm, which in an adult patient translates to an effective dose of 0.76 milligray (mSv). Although these guidelines provide a reasonable ceiling below which doses should fall, the recommended values serve more as a starting point than as an end goal; many centers, including the authors’ use protocols requiring much lower radiation doses.
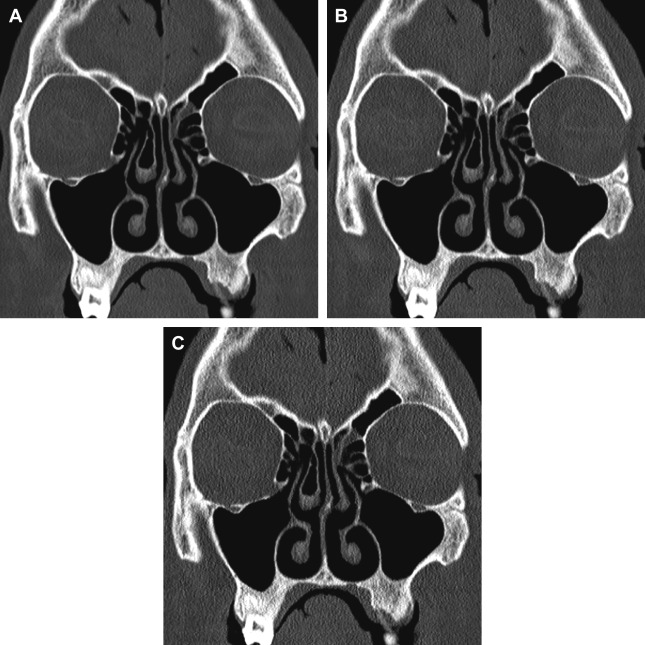
Among the simplest strategies to decrease the CT radiation dose is to change the acquisition parameters, such as tube voltage, tube current, and pitch; but this strategy comes at the price of reducing image quality. Lowering the peak tube voltage reduces the effective dose in an exponential fashion and also has the added benefit of increasing contrast for bony structures; however, substantially decreasing the peak tube voltage, while keeping other factors constant, also increases image noise in a nonlinear fashion because of the decreased tissue penetrating power of the lower-energy photons. Lowering the tube current alone reduces the dose in a linear fashion but also increases image noise because of greater quantum mottle ( Fig. 4 ). Finally, although increasing the pitch also lowers the radiation dose proportionally, this degrades the section sensitivity profile and increases volume averaging. Furthermore, the effect of pitch on radiation dose is negated by scanners using an effective milliampere-second setting, which holds the effective milliampere-second value constant irrespective of pitch value.
The challenge of optimizing CT in any part of the body lies in striking the right balance between dose and image quality. Studies have evaluated various low-dose sinus CT protocols in an attempt to determine how far one can reduce dose while maintaining diagnostic quality images. Most of the protocols that have been investigated to date have focused primarily on lowering the tube current, but some have also looked at the effects of altering both the tube current and tube voltage.
Brem and colleagues estimated that the effective tube current could be lowered to 67 mAs at a tube voltage of 120 kVp while maintaining diagnostic quality for sinus CT by using a computer simulation that artificially added image noise to emulate the effect of lowering the radiation dose. In various human studies, tube current settings as low as 10 mAs to 40 mAs have been evaluated with reported dose reductions of 59.7% to 93.0% compared with standard dose protocols and achieved average doses as low as 0.047 mSv ; these studies suggest that these low-dose settings do not seem to significantly affect ability to assess individual anatomic structures or result in discrepancies in interpretation.
Studies examining a wide variety of applications, including in the head and neck, have also shown that images acquired lower tube potentials (80–100 kVp) with an appropriately adjusted milliampere-second can substantially lower the radiation dose while still maintaining high diagnostic quality. Abul-Kasim and colleagues compared 2 low-dose protocols incorporating both reduced tube voltage and current (80 kV, 33 effective mAs and 80 kVp, 17 effective mAs) to a standard protocol (120 kVp and 59 effective mAs) and reported that the low-dose settings provided mean effective dose reductions of 74.6% and 87.9%, respectively. Although lowering dose was noted to produce lower image quality scores in the study, there was still high interobserver and intraobserver agreement for assessment of pathologic conditions across the different dose settings.
Several additional strategies for CT dose reduction that have been introduced recently by scanner manufacturers include automatic exposure control (AEC) systems, automated tube voltage selection, and noise-reducing iterative reconstruction (IR) algorithms. AEC systems are now available on MDCT systems from all of the major scanner manufacturers and are among the most widely used automated dose-reduction techniques. These systems, which include CAREDose 4D (Siemens Medical Solutions, Erlangen, Germany); AutomA and SmartmA (GE Healthcare, Milwaukee, WI); DoseRight (Phillips Medical Systems, Andover, MA); and SureExposure 3D (Toshiba Corporation, Tokyo, Japan), vary to some degree in their basic mode of operation; but all function to modulate the radiation dose according to the patient size and attenuation while maintaining image quality. The amount of dose savings provided by use of AEC depends on the specific system, the body part to be scanned, patient habitus, and user-specified settings; however, various studies have reported dose reductions for different body parts in the range of 15% to 60%. More recently, an automated tube voltage selection system has been introduced for commercial use. This technology automatically calculates the optimal tube current and tube potential for each patient depending on the study type, body part, and patient habitus to maintain user-defined quality and noise preferences. To date this technology is only available on scanners manufactured by Siemens, which limits its widespread applicability.
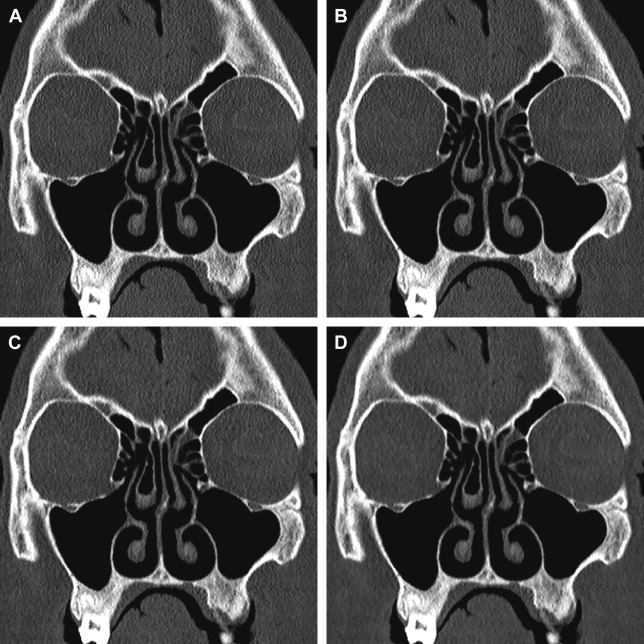
There has also been renewed interest in the use of IR techniques in CT imaging for noise reduction. IR is an alternative to filtered back projection (FBP), which had for many years been the method on which all CT reconstruction methods were based. Although IR is not a new idea, the significant computational demands and time required to perform IR precluded it from being commercially viable in the past. Faster and more powerful computers coupled with newer IR techniques have substantially reduced processing times to the point that all the major CT vendors now offer some version of IR. These versions include Image Reconstruction Iterative Reconstruction (IRIS) and Sinogram Affirmed Iterative Reconstruction (SAFIRE) (Siemens Medical Solutions, Erlangen, Germany); Adaptive Statistical Iterative Reconstruction (ASiR) and model-based IR (Veo) (GE Healthcare, Milwaukee, WI); iDose (Phillips Medical Systems, Andover, MA); and Adaptive Iterative Dose Reduction (ADIR) and ADIR 3D (Toshiba Corporation, Tokyo, Japan). Although they differ slightly, these IR techniques all basically function to reduce reconstructed CT image noise compared with traditional FBP techniques, with the user being able to determine the iteration strength and overall amount of noise reduction. Thus, theoretically, one can use lower dose settings to achieve the same contrast-to-noise ratio (CNR). A potential disadvantage to IR is that increasing iteration strength, although it can markedly reduce image noise, also produces artificial oversmoothing of images that may impair evaluation of thin bony structures ( Fig. 5 ).
To date 3 studies have examined the feasibility of IR techniques in paranasal sinus imaging. Bulla and colleagues reported that application of IRIS allowed for a dose reduction of up to 60% compared with a standard low-dose (60 mAs) CT, without impairing the diagnostic quality of images. In a phantom head study, Schulz and colleagues performed CT scans at different tube voltages (120 kV and 100 kV) and tube currents (100 mAs, 50 mAs, and 25 mAs) and reconstructed each scan using FBP and 5 different SAFIRE settings. Although SAFIRE reduced the image noise by 15% to 85% depending on the iterative strength, rendering kernel, and dose parameters, in a subjective assessment of image quality, readers invariably preferred the full tube current examinations reconstructed with FBP over the lower milliampere-second scans, regardless of SAFIRE setting; the investigators did not specifically comment on the diagnostic quality of the scans. Finally, Hoxworth and colleagues, comparing standard-dose (210 mA) and low-dose (20 mA) sinus CT reconstructed with both FBP and Veo model-based iterative reconstruction, found that although images reconstructed with Veo had the lowest image noise, none of the low-dose sinus CT scans, irrespective of the use of IR, were adequate for preoperative planning.
Ultimately, what constitutes acceptable dose and image quality in sinus CT depends, in large part, on the specific indication for the examination. A scan performed at a very low milliampere-second setting may be fine for simply confirming the presence or absence of fluid or mucosal thickening but might not provide the fine bony detail required for presurgical planning. The authors’ own routine sinus CT protocol varies slightly depending on the scanner being used, but a sample protocol for a 128-slice MDCT equipped with both automated tube voltage and current systems and IR is described in Table 1 . Irrespective of the specific scanner, the authors’ sinus CT protocol consists of a single axial volumetric acquisition extending from the top of the frontal sinus through the hard palate using a submillimeter collimator (∼0.6 mm on 64-slice scanners). Overlapping, submillimeter thick (0.6–0.75 mm) axial images that are compatible with the authors’ center’s intraoperative navigation systems are reconstructed using a soft tissue reconstruction kernel, whereas additional 2-mm axial, coronal, and sagittal images are reconstructed using an ultrasharp bone reconstruction kernel for general viewing. In the authors’ experience, the protocol described in Table 1 produces reasonably low effective doses while being of high enough quality for routine surgical planning.
| Adult Protocol | Pediatric Protocol | |
|---|---|---|
| Detector configuration | 128 × 0.6 mm | 128 × 0.6 mm |
| Automated exposure control (CAREDose) | On | On |
| Automated tube voltage selection (CAREkV) | On | On |
| Reference mAs | 84 mAs | 60 mAs |
| Reference kV | 120 kV | 120 kV |
| Rotation time | 1 s | 1 s |
| Pitch | 0.8:1 | 0.8:1 |
| Reconstructions | 0.75 mm axial, J40s, SAFIRE 3 2-mm axial/coronal/sagittal, H70 h, SAFIRE off | |
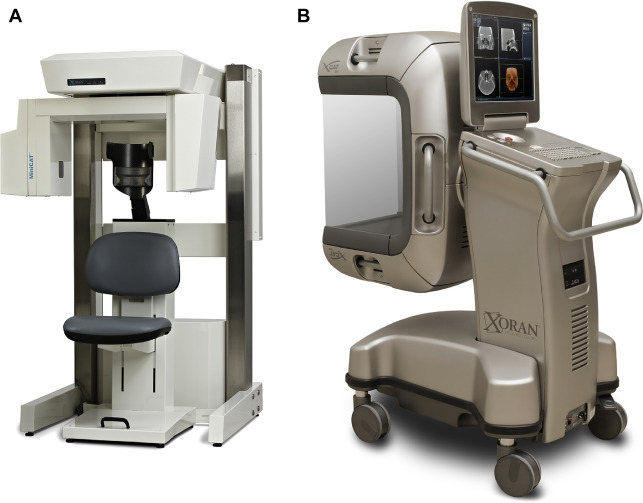
Cone Beam Computed Tomography
CBCT is a technology that has become popular for point-of-care (POC) imaging in the office setting and for intraoperative imaging, both because of its compact size and attractively low cost (compared with conventional CT) ( Fig. 6 ). Although the reconstruction algorithm on which CBCT is based (in essence a 3D modification of traditional filtered back projection ) was first introduced more than 30 years ago, the technology only became widely available over the last 10 to 15 years, with the first commercial dental CBCT scanner introduced in 2001 (NewTom QR DVT 9000; Quantitative Radiology, Verona, Italy). Similar systems designed primarily for imaging in the head and neck were introduced shortly thereafter (MiniCAT, Xoran Technologies, Ann Arbor, MI; Accuitomo, J Morita Technologies, Irvine, CA; ILUMA Cone Beam CT, IMTEC, Ardmore, OK; GE Healthcare, Chalfont St Giles, UK). CBCT is now being used routinely for clinic-based dentomaxillofacial imaging, for patient positioning verification in radiotherapy, and for imaging during operative and interventional procedures.