I. Simple renal cysts, solitary and multiple
II. Complex renal cysts
III. Extraparenchymal renal cysts
A. Parapelvic cysts
B. Peripelvic cysts
IV. Localized, segmental, and unilateral renal cysts
V. Acquired renal cystic disease
VI. Polycystic kidney disease
A. Autosomal dominant polycystic kidney disease
1. Glomerulocystic disease of newborn
2. Classic polycystic disease of older children and adults
(a) PKD1 gene (chromosome 16, encoding for polycystin-1)
(b) PKD2 gene (chromosome 4, encoding for polycystin-2)
B. Autosomal recessive polycystic kidney disease
1. Polycystic disease of newborns and infants
2. Polycystic disease of older children and adults
(a) Medullary ductal ectasia
(b) Congenital hepatic fibrosis
(c) Caroli’s disease
VII. Renal cysts in hereditary malformation syndromes
A. Tuberous sclerosis complex
B. von Hippel–Lindau syndrome
C. Zellweger cerebrohepatorenal syndrome
D. Jeune asphyxiating thoracic dystrophy
E. Oral–facial–digital syndrome I
F. Brachyesomelia-renal syndrome
VIII. Renal medullary cysts
A. Medullary sponge kidney
B. Hereditary tubulointerstitial nephritis (medullary cystic kidney)
1. Familial juvenile nephronophthisis
2. Medullary cystic disease
3. Renal–retinal dysplasia complex
IX. Renal cystic dysplasia
A. Multicystic kidney
B. Cystic dysplasia associated with lower urinary tract obstruction
C. Diffuse cystic dysplasia, syndromal and nonsyndromal
X. Drug- or toxin-induced renal cysts
XI. Glomerulocystic kidney disease
A. Infantile-onset dominant polycystic kidney disease
B. Syndromal glomerular cystic disease
C. Nonsyndromal glomerular cysts
Renal cysts are common radiographic and clinical abnormalities. While renal cysts are frequently discovered as incidental findings in clinical diagnostic imaging studies, dedicated imaging studies can be performed to confirm a suspected diagnosis. The diagnosis of a specific renal cystic disease can be made by a review of the patient’s clinical history in conjunction with radiographic findings. Key imaging features useful for the diagnosis of renal cystic disease include renal cyst location (i.e., uni- or bilateral kidney involvement of the renal cortex, medulla, pelvis or exophytic), cyst distribution (i.e., sparse, dense), cyst size, cyst composition (simple, complex, hemorrhagic, proteinaceous, calcium), dimension (aspect) and functional state of the affected kidney, other coexisting noncystic lesions in the kidney, and cystic and noncystic lesions in other organs (e.g., liver, pancreas, or spleen). Other clinical features, such as age at presentation, familiar history of disease, and degree of renal functional impairment, may also help establish the diagnosis (Tables 2 and 3).
Table 2
Imaging features of cystic kidney disorders
Entity | Age at detection | Number of cysts | Renal cyst distribution | Cyst size | Kidney size | Renal complications and associated tumors | Extrarenal findings |
|---|---|---|---|---|---|---|---|
Simple, complex cysts | Adult | Few (increases with age) | Uni- or bilateral, mainly cortical | Variable | Normal | Nonspecific | None |
Extraparenchymal cysts | Adult | Few | Uni- or bilateral, juxtapelvis | Medium to large | Normal | Nonspecific | None |
Localized cystic disease | Adult | Few | Unilateral, clustered, whole or regional | Medium to large | Normal | Nonspecific | None |
Acquired cystic disease | Adult | Few to many (increases with dialysis) | Bilateral mainly cortical | Variable | Atrophic | Increased renal cell carcinoma | None |
Autosomal dominant polycystic kidney disease | All ages | Few to numerous (progressively increase) | Bilateral, diffuse | Variable | Normal to large | Hypertension and renal failure | Hepatic cysts, cerebral aneurysms |
Autosomal recessive polycystic kidney disease | Neonate, juvenile | Few to numerous | Bilateral, diffuse | Small | Normal to large | Hypertension and renal failure | Congenital hepatic fibrosis, Caroli’s disease |
Tuberous sclerosis | All ages | Few to many | Bilateral, mainly cortical | Small | Normal | Angiomyolipomas | Dermatologic findings, retinal hamartomas |
von Hippel–Lindau | All ages | Few to many | Bilateral, mainly cortical | Variable | Normal | Renal cell carcinoma (multicentric, bilateral) | Pancreatic cysts, retinal hemangioblastoma, pheochromocytoma |
Medullary sponge kidney | Adult | Few | Bilateral medullary | Small | Normal | Medullary nephrocalcinosis | None |
Multilocular cystic nephroma | Juvenile and adult form | Few | Unilateral, corticomedullary | Medium to large | Normal | Likely benign, potential malignancy controversial | None |
Multicystic dysplastic kidney | Infant and adult form | Few to many (progressively involute) | Unilateral, diffuse | Variable | Enlarged, involuted | Vesicoureteral reflux, contralateral UPJ obstruction | None |
Lithium nephropathy | Adult | Numerous | Bilateral, diffuse | Small | Normal | Nonspecific | None |
Table 3
Renal cystic diseases assorted by the renal laterality and key differential diagnostic features
Unilateral | Bilateral | Uni- or bilateral | |
|---|---|---|---|
Localized cystic disease: clustered | Genetic | ADPKD: hepatic cysts, often big kidneys | Simple, complex cysts |
ARPKD: small cysts, hepatic fibrosis | Parapelvic cysts: mimicking hydronephrosis | ||
MLCN: thick capsule, herniates to pelvis | TS: AMLs | ||
VHL: RCCs, pancreatic cysts | |||
MCDK: no normal parenchyma, involutes | Nongenetic | Acquired: atrophic kidneys, dialysis history | |
MSK: medullary calculi, few tiny cysts | |||
Lithium: tiny cysts, lithium history | |||
Various imaging modalities are used for the diagnosis and clinical evaluation of renal cystic diseases. Renal ultrasound is readily available and can be safely performed in a wide range of patients. It does not emit radiation or require normal renal function for the procedure and can be used as a screening tool for polycystic kidney disease (Parfrey et al. 1990; Ravine et al. 1994). Ultrasound also has the advantage of being cost-effective and easily tolerated by patients for repetitive studies. The downside to ultrasound imaging is that it is operator dependent and may be less accurate and reproducible than CT or MR imaging, particularly for detecting small cysts.
While ultrasound is more commonly used as a screening modality, CT and MR imaging are more widely used in clinical settings for characterizing renal cystic lesions, assessing cysts complications, and differentiating benign from malignant cystic lesions. CT with iodinated contrast is an efficient, accurate imaging technique for renal structures. However, it involves the emission of ionizing radiation and the use of an iodinated contrast medium that may harm patients with existing impaired renal function. MR imaging has been demonstrated to be superior to ultrasound and CT for the visualization of small renal cysts (Nascimento et al. 2001). T2-weighted MR imaging sequences are best for detecting the presence of fluid-filled cavities. In particular, short-breath-hold strongly T2-weighted sequences, such as half-Fourier single-shot turbo spin echo and RARE, have been proven very useful in depicting structures containing static fluids. MR imaging is also the imaging modality of choice for the evaluation of morphological and physiological changes associated with renal cystic disease (EL-Merhi and Bae 2004). Contrast-enhanced CT and gadolinium-enhanced MRI are used to determine enhancement within a renal lesion and can differentiate a cyst (no enhancement) from a cystic neoplasm (enhancement). In addition, with the availability of 3D urography studies by CT and MR, the conventional excretory urography (i.e., IVP) has limited roles in evaluating patients with renal cystic diseases.
2 Simple Cysts
Simple cysts are the most common renal lesions in adults. The incidence, number, and size of renal cysts increase with age, with cysts reported in up to 27 % of patients greater than 50 years of age (Laucks and McLachlan 1981; Tada et al. 1983). Renal cysts can be solitary, multiple, or bilateral, and they commonly arise in the renal cortex. They are benign asymptomatic lesions, most of which are incidentally discovered on ultrasound or CT examinations.
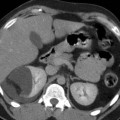
On ultrasound, simple cysts classically present as round, anechoic lesion with acoustic enhancement and no appreciable wall thickness. On CT imaging, simple cysts are round with no perceptible walls and are well demarcated from the adjacent renal parenchyma (Fig. 1). The CT attenuation values of renal cysts are typically less than 20 HU (water attenuation). On MR imaging, simple renal cysts present with the same morphological features as demonstrated on CT. They appear very bright on T2-weighted images and maintain homogeneous signal void on T1-weighted images (Fig. 2) (Hartman et al. 2004).
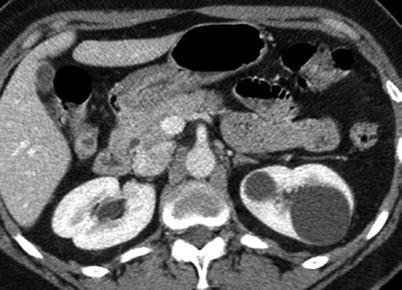
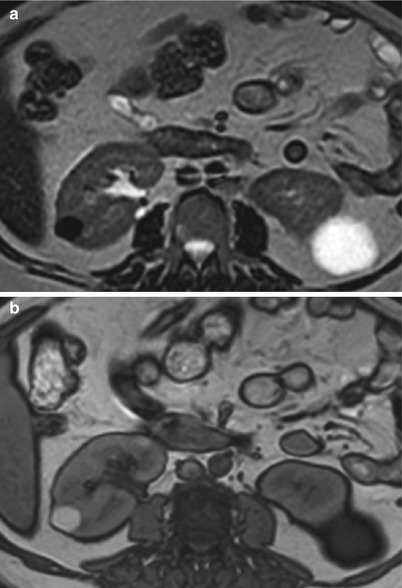

Fig. 1
Simple cyst. Contrast-enhanced CT image of the left kidney shows two simple cysts of water attenuation with no complexity or perceptible wall

Fig. 2
Simple and complex cysts. (a) Axial T2-weighted and (b) T1-weighted MR images show an exophytic simple cyst on the left and a complex cyst on the right kidney. While the simple cyst shows bright T2 and dark T1 signal intensities, the complex cyst demonstrates the opposite signal intensity characteristics
The absence of contrast enhancement is critical to differentiate renal cysts from renal tumors with a cystic component. Although renal cysts should not enhance after administration of intravenous contrast material (Thomsen et al. 1997), some cysts may appear to enhance (pseudo-enhancement). This is because of multiple technical and image-related factors that are directly associated with the presence of iodinated contrast material within adjacent renal parenchyma (Fig. 3) (Bae et al. 2000; Coulam et al. 2000; Maki et al. 1999). The degree of pseudo–enhancement in CT is typically less than 10–20 HU but varies with multiple factors (size, location of cysts, CT scanners, reconstruction algorithm) (Bae et al. 2000; Birnbaum et al. 2007; Coulam et al. 2000; Wang et al. 2008; Tappouni et al. 2012). In addition to pseudo-enhancement, small cysts deep in the renal parenchyma may be subjected to a partial volume averaging with adjacent contrast-enhanced renal parenchyma and may appear to enhance (Silverman et al. 2008). To minimize the partial volume averaging effect on the enhancement assessment, it is critical to use appropriate image slice thickness; typically the thickness should be less than the diameter of the lesion.
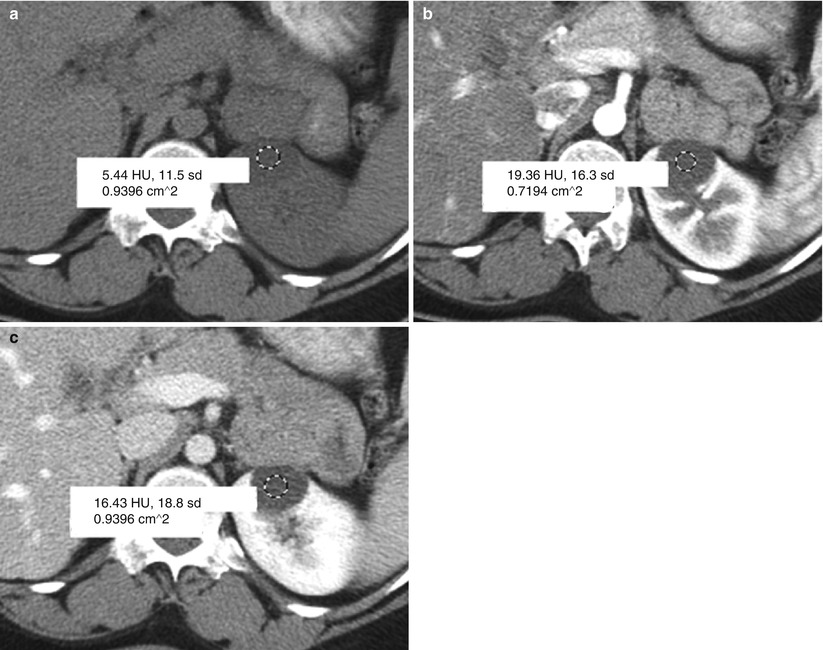

Fig. 3
Pseudo-enhancement in simple cyst. The attenuation of simple cyst is measured by placing a region of interest (ROI) on CT images obtained (a) before the administration of contrast medium, (b) after the administration of contrast medium at the corticomedullary phase, and (c) at the nephrographic phase. Pseudo-enhancement is measured approximately 14 HU (=19–5) at the corticomedullary and 11 HU (=16–5) at the nephrographic phase
Recent publications reported that dual-energy CT is useful in differentiating nonenhancing cysts from enhancing lesions on the basis of selective iodine display techniques (also known as color–coded iodine overlay or iodine–density images) (Graser et al. 2010; Mileto et al. 2014; Ascenti et al. 2012, 2013). In these techniques, the iodine signal of enhancing lesions is directly determined and visualized on a single-phase image dataset, whereas nonenhancing cysts lack a detectable iodine signal. Since renal cysts are avascular, they are devoid of iodine signal on iodine-specific images. In contrast, renal lesions enhanced by iodine uptake would show an iodine signal on color-coded iodine images (Fig. 4) (Graser et al. 2010; Mileto et al. 2014; Ascenti et al. 2012, 2013). In addition, iodine content (in milligrams of iodine per milliliter) can be quantified from the iodine-specific images to potentially improve the accuracy for the assessment of lesion vascularity (Mileto et al. 2014; Chandarana et al. 2011; Ascenti et al. 2013). It has been proposed that an iodine concentration threshold of 0.5 mg/mL more accurately differentiates enhancing solid renal lesions from nonenhancing cysts on dual-energy CT than does the conventional approach for the assessment of lesion enhancement on single-energy images (Mileto et al. 2014; Ascenti et al. 2013). However, this proposed threshold method is based on a single institutional experience with a single vendor CT scanner. Further studies would be required to test the generalizability of this specific threshold value in different vendor CT scanners.
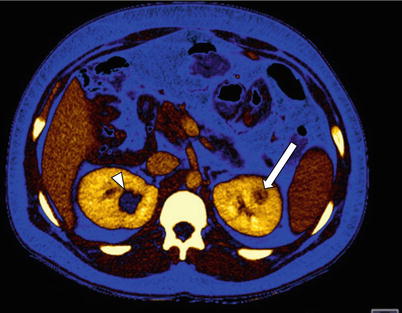

Fig. 4
Color-coded iodine map depicting an enhancing tumor in the left kidney (arrow) and a nonenhancing cyst (arrowhead) in the right kidney. Note that the enhancing solid neoplasm shows a positive iodine signal, consistent with lesion enhancement. On the other hand, the cyst lacks iodine signal, confirming the absence of contrast enhancement
Pseudo-enhancement may be also observed in contrast-enhanced MR imaging. Various features found in MR imaging, including motion artifacts, inherent noise, and partial volume averaging, can cause the appearance of enhancement (Ho et al. 2002). The optimal percentage of enhancement thresholds for distinguishing cysts from malignancies is reported to be 15 %, with the optimal timing for measurement at 2–4 min after the administration of contrast material (Ho et al. 2002). Some researchers advocate the review of the subtracted images (enhanced minus unenhanced MR images) for the detection of subtle contrast enhancement within renal lesions (Hecht et al. 2004) (Fig. 5).
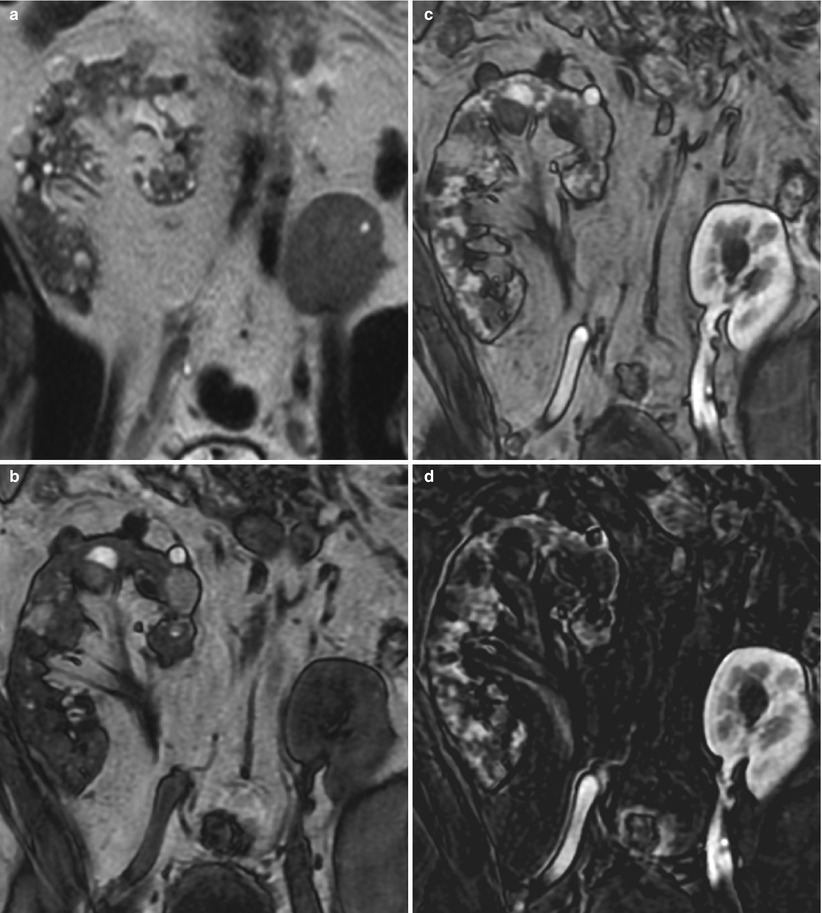

Fig. 5
Subtraction MR imaging useful for assessing contrast enhancement. (a) Coronal T2-weighted, (b) T1-weighted pregadolinium, (c) T1-weighted postgadolinium enhanced, and (d) subtraction of postgadolinium minus pregadolinium T1-weighted images show the native right kidney with multiple simple and complex cysts and the transplanted left pelvic kidney
3 Complex Cysts
Simple renal cysts may be complicated by internal hemorrhage, infection, or other processes that may appear on imaging with complex radiologic features suggestive of cystic renal neoplasm. On US imaging, complex cysts may present with internal echo, septum, wall thickening, calcification, and acoustic shadowing. Similarly, heterogeneous morphological features of complex cysts are delineated and characterized on CT and MR imaging. Some of the findings of complex cysts, such as irregular wall thickening, dense calcification, and multiple septa, can also be seen in cystic renal neoplasm (Hartman et al. 2004). A classification system of renal cystic lesions on CT, the Bosniak Classification of Renal Cystic Disease, grouped renal cysts into five categories based on imaging appearance in an attempt to predict the risk of malignancy and determine the risk and management of complex cysts and cystic neoplasm (Bosniak 1986). This will be discussed further in “Cystic Renal Masses.”
Complex cysts may present as hyperdense cysts (attenuation greater than water) in CT due to internal hemorrhage or proteinaceous content (Sagel et al. 1977). Since hyperdense cysts show no significant contrast enhancement, they can be differentiated from renal neoplasms based on the assessment of enhancement. However, hyperdense cysts discovered incidentally at CT with only a single phase of contrast enhancement may not be easily distinguishable from solid renal masses solely based on CT attenuation. A study reported that on portal venous phase contrast-enhanced CT scans, attenuation greater than 70 HU and moderate or marked internal heterogeneity favor a diagnosis of renal cell carcinoma (RCC) over a diagnosis of hyperdense renal cyst (Suh et al. 2003).
Nevertheless, when a cystic lesion that does not meet the criteria for a simple cyst is detected on a routine enhanced CT, patients are usually referred to either (1) an ultrasound imaging (which is often indefinite, especially if the attenuation of the lesion is greater than +40 HU due to the containment of blood or proteinaceous debris), (2) an additional delayed CT scan to assess lesion “de-enhancement”, or (3) a repeat CT or MRI scan that includes both unenhanced and contrast-enhanced imaging. We may be able to eliminate these additional tests with the use of dual-energy CT. Particularly, when a questionable high-attenuating renal lesion (>30 HU) is detected on contrast-enhanced images without available unenhanced or delayed CT images, dual-energy CT offers an additional opportunity to improve the differential diagnosis between benign high-attenuation cysts (Bosniak category II) and solid enhancing lesions (e.g., renal cell carcinoma).
Recent data (Mileto et al. 2014; Silva et al. 2011) suggest that the creation of spectral attenuation curves – which are based on the attenuation analysis across a spectrum of synthesized monochromatic energies – can help guide toward the correct diagnosis. Notably, enhancing renal lesions on single-phase nephrographic images can be differentiated from nonenhancing high-attenuation cysts by means of spectral attenuation curves in that iodine attenuates greater at lower energies, while cyst attenuation remains flat at a broad range of CT energies (Figs. 6 and 7) (Mileto et al. 2014; Silva et al. 2011).
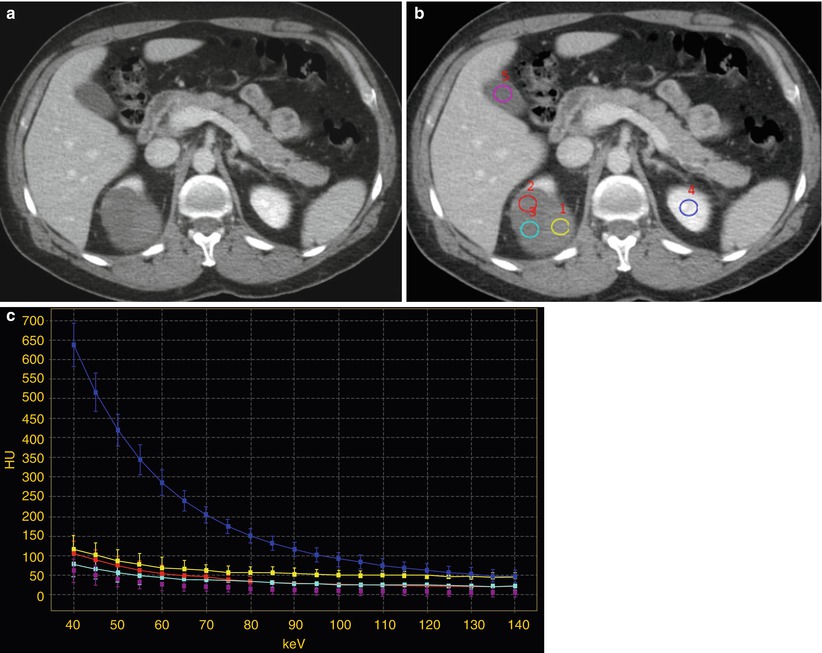
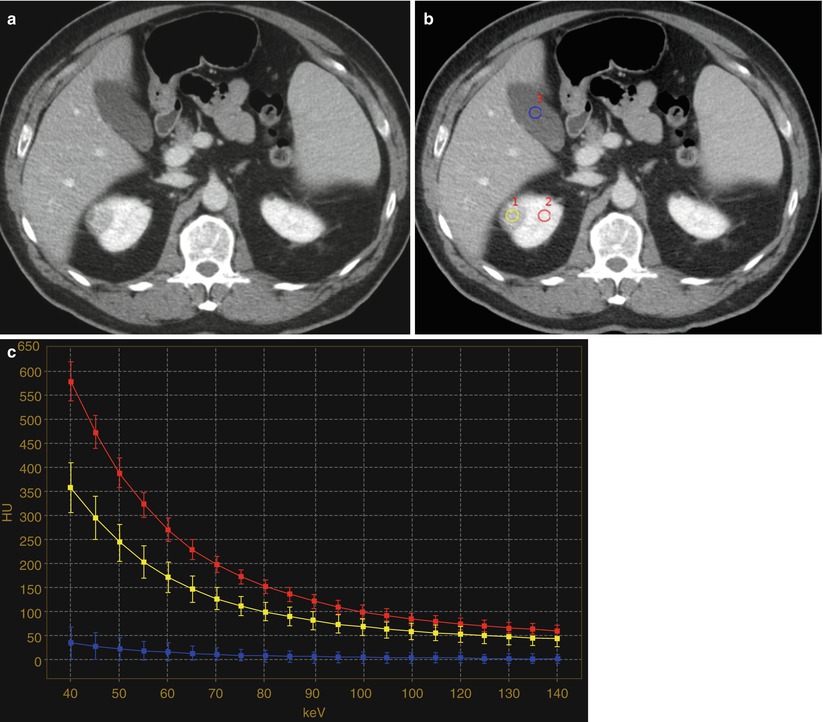

Fig. 6
Contrast-enhanced nephrographic phase images (a, b) and corresponding spectral attenuation curves (c) in a 54-year-old man with a complex cystic renal lesion in the right kidney. The renal lesion contains both low- and high-attenuating components. (a) The higher-attenuating component is difficult to characterize and may represent either an enhancing mural nodule or a hemorrhage/debris area. (b) Multiple ROIs are placed over the three variable components of the renal lesion (yellow, azure, and red) and compared to the reference tissues of the gallbladder fluid (violet) and the normal enhancing left renal parenchyma (blue). (c) Spectral attenuation curves corresponding to the ROIs were generated by plotting the attenuation values within the ROIs over the range of monochromatic energies from 40 to 140 keV. The curve corresponding to the normal enhancing left renal parenchyma increases steeply with the lowering of keV, whereas those corresponding to the three components of the right renal lesion are flat like that of the gallbladder fluid, consistent with the absence of iodine signal and the lack of vascularity

Fig. 7
Contrast-enhanced nephrographic phase images (a, b) and (c) corresponding spectral attenuation curves in a 59-year-old man with an enhancing tumor of the right kidney. (b) ROIs are placed over the renal lesion (yellow), the ipsilateral normally enhancing renal parenchyma (red), and the gallbladder fluid (blue). (c) The spectral attenuation curve corresponding to the renal lesion increases steeply with reduction in keV, similar to the curve corresponding to the enhancing ipsilateral renal parenchyma, whereas the gallbladder curve remains flat. The characteristics of the spectral attenuation curves obtained from dual-energy CT would allow us to improve the diagnostic confidence and accuracy in the determination of iodine uptake within a renal lesion
MR imaging is useful to evaluate complex cystic renal masses. Hemorrhage or protein within complex cysts may cause T1 shortening and present with higher signal intensity than water on T1-weighted image (Brown and Semelka 1995; Marotti et al. 1987) (Fig. 2). Hemorrhagic cysts may show variable signal intensities on T2-weighted images, depending on the stage of blood products (Brown and Semelka 1995; Hilpert et al. 1986; Marotti et al. 1987). Although the presence of calcification within renal lesions is difficult to identify with MR imaging, the same morphological features can be used to characterize complex cystic lesions, as with CT. Lack of gadolinium contrast enhancement is an important MR feature to differentiate complex cysts from renal cystic neoplasms. Since complex cysts are typically hyperintense on T1-weighted images, a careful comparison between the pre- and postcontrast MR images and the use of subtraction technique are often required to accurately assess the enhancement within complex cysts (Fig. 5) (Brown and Semelka 1995; Hilpert et al. 1986; Marotti et al. 1987).
4 Extraparenchymal Renal Sinus Cysts
Extraparenchymal cysts commonly occur in the renal sinus. These cysts are usually called parapelvic or peripelvic cysts because of their locations adjacent to the renal pelvis (Amis and Cronan 1988; Rha et al. 2004). Although parapelvic cysts (originating in the renal parenchyma and extending into the renal sinus) and peripelvic cysts (originating in the sinus presumably from lymphatic obstruction) differ in their origins, they are radiographically indistinguishable and are described interchangeably. These cysts are often discovered incidentally and are frequently multiple in nature. They replace the renal sinus fat and may displace or compress adjacent structures, including the renal pelvis and calyces, parenchyma, and vessels (Schwarz et al. 1993).
Renal sinus (parapelvic or peripelvic) cysts are benign and do not require treatment or imaging follow-up. Although these cysts do not communicate with collecting system, they may simulate hydronephrosis because of their proximity to the collecting system. One useful sign for the differentiation of renal sinus cysts from hydronephrosis is that whereas renal sinus cysts are centered predominantly in the renal hilum with relatively sparing of the upper and lower apexes of the renal sinus (Fig. 8), hydronephrosis is usually evident throughout the entire renal sinus (Fig. 9). When the diagnosis is still uncertain, postcontrast delayed CT and MR images can help differentiate unenhanced renal sinus cysts (which compress or displace enhanced collecting system) from a contrast-enhanced dilated pyelocalyceal system (Fig. 10) (Morag et al. 1983; Nahm and Ritz 2000). It should be noted that the signal intensity of the contrast-enhanced collecting system in MR imaging varies depending on the delayed phases and on the concentration of gadolinium contrast excreted into the collecting system (EL-Merhi and Bae 2004).
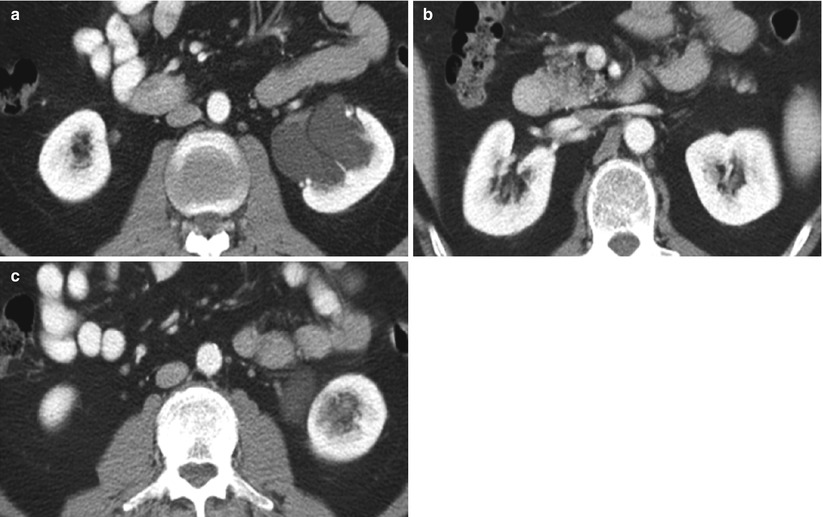
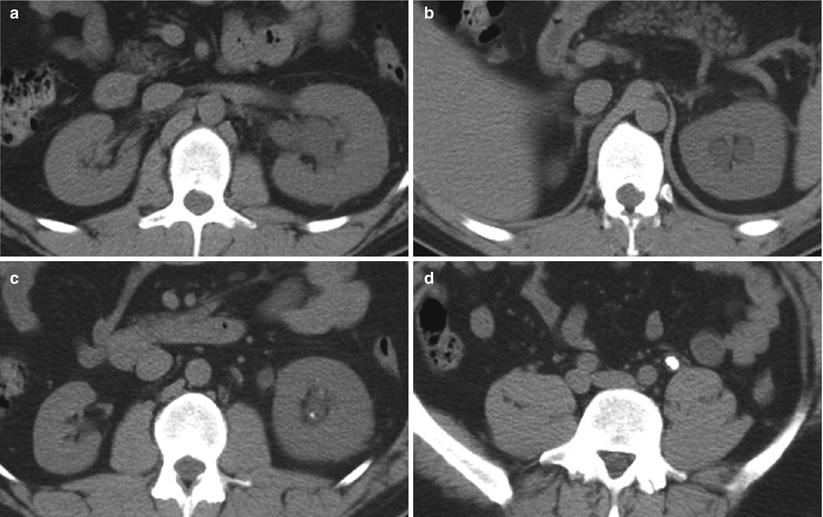
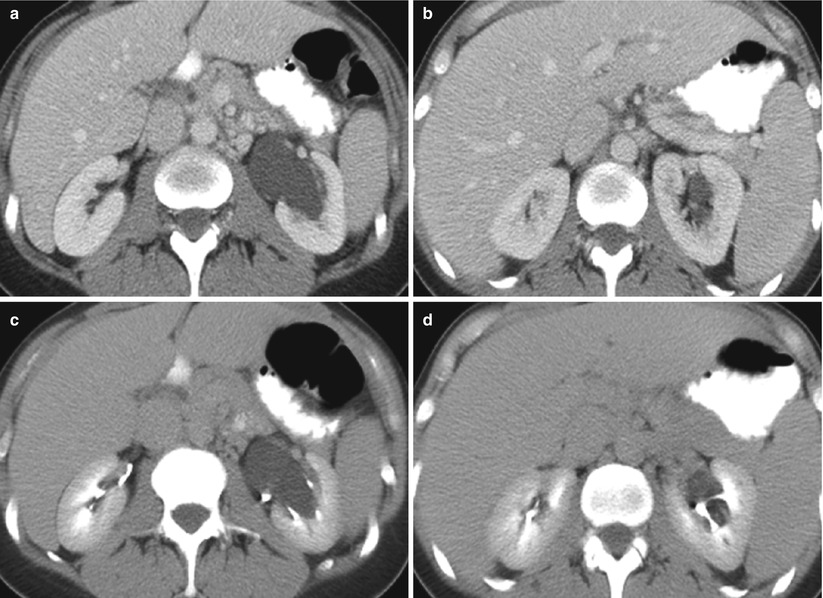

Fig. 8
Parapelvic cyst. Contrast-enhanced CT images show (a) parapelvic cyst at the level of hilum and no visualization of cysts in the renal sinus at (b) the upper and (c) lower pole of the left kidney

Fig. 9
Hydronephrosis. Unenhanced CT images show diffusely dilated collection system at the levels of (a) hilum, (b) upper pole, (c) lower pole, and (d) an obstructing calculus in the left mid-ureter. The left kidney is also enlarged and edematous

Fig. 10
Parapelvic cyst in contrast-enhanced and delayed CT. (a, b) Contrast-enhanced and (c, d) delayed CT images show a large left renal parapelvic cyst which does not enhance but is surrounded by delayed excretion of contrast medium within the collecting system
5 Localized Cystic Disease
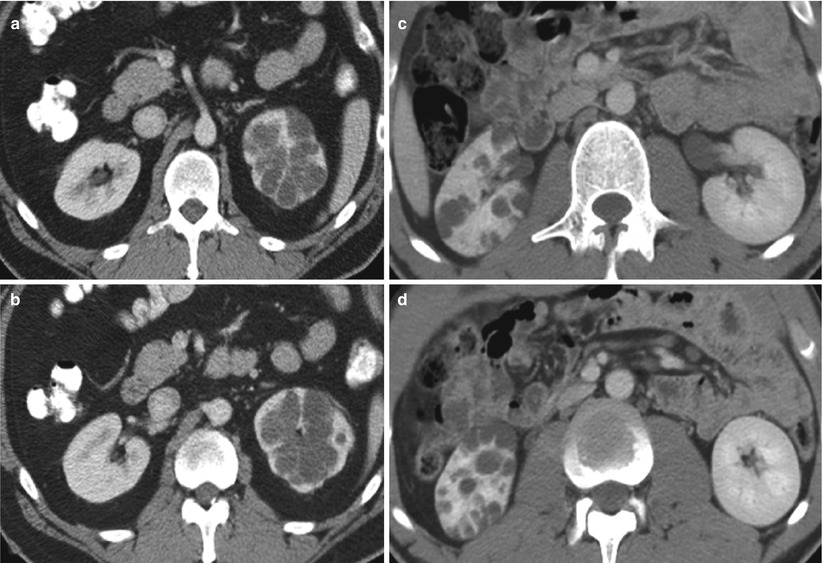
Localized cystic disease is a benign condition of unknown pathogenesis characterized by a cluster of simple cysts localized in only one kidney (Slywotzky and Bosniak 2001) (Fig. 11). It is also known as segmental cystic disease of the kidney (affecting only part of the kidney) or unilateral cystic disease of the kidney (affecting the entire kidney). Cysts are limited to one kidney and the contralateral kidney is normal. No association with renal tumor or renal insufficiency has been reported (Brenner and Rector 2008). Differential diagnoses for localized cystic disease include multiloculated cystic neoplasm, such as multilocular cystic nephroma and multiloculated RCC (Hartman et al. 1987, 2004). The multilocular cystic neoplasm usually has a thick capsule that may demonstrate contrast enhancement. The absence of a capsule surrounding the cluster of cysts, the presence of normal parenchyma between the individual cysts, and the presence of cysts outside the cluster confirm the diagnosis of localized cystic disease (Slywotzky and Bosniak 2001). Finally, when presenting in children, autosomal dominant polycystic kidney disease (ADPKD) may be a differential diagnostic consideration and can be further evaluated by phenotype screening of family members or by long-term follow-up imaging (Slywotzky and Bosniak 2001).
Get Clinical Tree app for offline access

Fig. 11
Localized cystic disease in two patients. Contrast-enhanced CT images show localized cystic disease involving (a, b


Stay updated, free articles. Join our Telegram channel

Full access? Get Clinical Tree


