Fig. 1
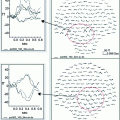
Top MEG time-courses of sources localized to anterior temporal lobe, averaged together for the healthy controls (blue tracing) and MCI/AD patients (red) tracing. MRI at right reveals anterior temporal lobe. Bottom Time-courses of sources for 3 middle-aged participants localized to medial temporal lobe (see MRI at the right). Participants denoted by red and green tracings were healthy controls. Blue tracing denotes a hypertensive participant. These time-courses appear noisy because we did not want to eliminate high frequency activity (e.g., gamma band) superimposed on the slower activity
The bottom portion of Fig. 1 shows time-course effects associated with hypertension. In this case we used a visual working memory task (Sternberg variant) to evoke activity in MTL. Single-subject data are shown for two healthy middle-aged controls (red and green tracings) and one middle-aged hypertensive patient (blue tracing). All participants were 35–45 years of age. In contrast with the ANT activity shown above, the hypertensive patient, representative of our hypertensive group, revealed lower amplitude signals and prolongation of peak activity. In this case, MCI and hypertension appear to operate in opposite directions (MCI have greater amplitude signals and no peak delays in ANT), at least initially, but AD and hypertension may have a similar trajectory (reduced amplitude, delayed peaks until activity in this region can no longer be localized). This is just one example of how MEG source locations and time-courses can be used to characterize various diseases and disorders. It should also be emphasized that MEG easily permits the examination of single subject data, a necessity for clinical intervention.
MEG/EEG: Oscillatory Activity and Frequency Domain Analyses. Certainly, we are interested in finding alternative ways of analyzing data for our clinical research on aging and dementia, that may be faster and/or geared toward very specific questions (e.g., slowing of activity in temporal regions). Characterizing altered neural oscillations and synchrony in pathophysiology as a potential biomarker provides an additional way to achieve classification specificity for brain disorders (Uhlhaas and Singer 2010). Recently, there has been increased interest in understanding oscillating networks since they appear to provide important links between single neuron activity, population activity, and behavior. The existence of an oscillatory hierarchy, which controls neuronal excitability (Buzsaki and Draguhn 2004; Lakatos et al. 2005), has been described in animal studies where higher frequency oscillations are nested within lower frequencies. Lakatos and colleagues (2005), for example, nicely show in monkey auditory cortex that a succession of negative and positive voltage fluctuations, comprising the oscillation, reflected an underlying 7 Hz alternation of net inward and outward transmembrane current flow, which produced extracellular current sinks and sources, respectively. The corresponding multiunit activity indicated that current flow alternation reflected shifts between net depolarized and hyperpolarized states in the local neuronal ensemble (i.e., increases in firing and decreases in firing). Studies on cross-frequency coupling in the hippocampus and other brain regions suggest that these nested oscillatory patterns may be capable of storing multiple memories within a single network (Lisman and Idiart 1995). In addition, there is a correlation between the distance over which synchronization is observed and the frequency of the oscillations such that higher frequency oscillations (gamma band activity) are believed to be confined within small neuronal space (i.e., shorter distance) whereas slower oscillations such as beta band activity carry information over longer distances (e.g., large networks) (Kopell et al. 2000; Buzsaki and Draguhn 2004; Uhlhaas et al. 2010). Only coherently oscillating neuronal groups (i.e., phase locked) can interact effectively across distance. In sum, oscillations constitute rhythmic modulations in neuronal excitability that affects both the likelihood of spike output and sensitivity to input, which also permits coherently oscillating neuronal groups across regions to communicate effectively and efficiently with each other (Fries 2005).
Unfortunately, after decades of research on oscillatory activity there is no unified theory on oscillatory activity as seen in surface EEG or MEG, although there have been numerous studies attempting to determine the role of oscillations in perceptual binding (Engel et al. 1992; Singer and Gray 1995; Roelfsema et al. 1997). However, MEG recordings are better suited for examining oscillatory activity for two reasons. First, the abnormal MEG patterns noted for AD are very specific to sensor groupings (e.g., temporal regions) rather than being generalized across the head (EEG). This is important since much of the abnormal activity is in the same frequency range as muscle and other related artifacts. MEG can separate out abnormal brain activity from muscle artifact based on different spatial patterns. Second, we have noticed bursts of high frequency signals associated with WMHs and bursts of slow-waves associated with volume loss. Luckily, the skull does not act as a low-pass filter for MEG as it does for EEG (Hamalainen et al. 1993). Clearly this is an exciting area where MEG/EEG studies have a definite advantage over fMRI measures. For those interested in learning more about oscillatory activity and frequency domain analyses, please see chapters (this volume) by Schoeffelen and Gross, Brookes and colleagues, and de Pasquale and Marzetti.
What makes cortical frequencies change? Some frequency changes are associated with development [see Uhlhass et al. for a review (2010)]. But, pathology can also affect regional frequencies. For example, Fernandez and colleagues (2002) found abnormal slow wave activity for AD patients in temporoparietal regions (see a review by Maestú and colleagues—this volume). In general, diffusion parameters of the extracellular space such as volume fraction and diffusion barriers modulate neuronal signaling, neuron-glia communication and extrasynaptic volume transmission (Sykova 2004). Significant decreases in extracellular space volume fraction (e.g., due to astrocytosis) and increases in diffusion barriers (e.g., plaques) may occur in AD as the result of pathology. If ion homeostasis is not maintained in the extracellular space, increased neuronal excitability and synchronization may occur, as noted in epileptiform spike generation (Broberg et al. 2008). Interestingly, several neurodegenerative diseases such as AD are associated with increased incidence of seizures (Palop et al. 2006). Cell swelling and concomitant reduction of extracellular space volume occurs in a number of pathologic conditions, causing an imbalance in the neuronal environment. Plaques, in contrast, disrupt the synchrony of convergent inputs thereby reducing the successful integration and propagation of information by neurons (Stern et al. 2004); it affects network properties and causes an increase in response variability with a net result of reduced synchrony of converging synaptic inputs.
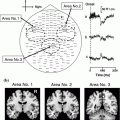
It is clear that pathology affects neuronal signaling but how exactly the deposition of plaques, cell volume changes and changes in the extracellular ion concentration affect signal generation and propagation remain unclear. Our single-trial MEG data shown in Fig. 2 suggest at least 3 different patterns of activity associated with pathology: (1) bursts of slow-wave activity some of which are time-locked to the stimulus; (2) bursts of high frequency spike-like activity that is not time-locked to the stimulus; and (3) abnormal rhythmic patterns (see Fig. 3: a fronto-temporal dementia case). High frequency bursts were often seen in single-trial data from participants who revealed moderate to severe WMHs on their MRIs (bottom panel of left column) resulting in source time-courses that were extremely variable across participants in terms of peak latencies and amplitudes (bottom panel of middle column). In contrast, bursts of slow-wave patterns were evoked by auditory stimuli from participants with evidence of volume loss on their MRIs (middle panel of left column “M#030 Temporal/Parietal Atrophy”). Their corresponding averaged time-courses showed enhanced amplitudes, but the peak latencies were similar to those seen in normal controls (compare middle and top panels of middle column). As this longitudinal study progressed across years, it became possible to predict the MRI and neuropsychological results based on the number of epochs evidencing slow-wave bursts or high frequency activity in the single-trial data (unpublished results). We also see cases where both high frequency bursts and slow-wave activity are present within the same individual and their MRIs show the presence of both WMHs and volume loss. Relating single-trial data to models of diffusion parameters in extracellular space is likely to provide new information on the etiology of cortical pathology and cognitive decline associated with aging, MCI and AD. This is an untapped area of research that is uniquely suited for MEG.
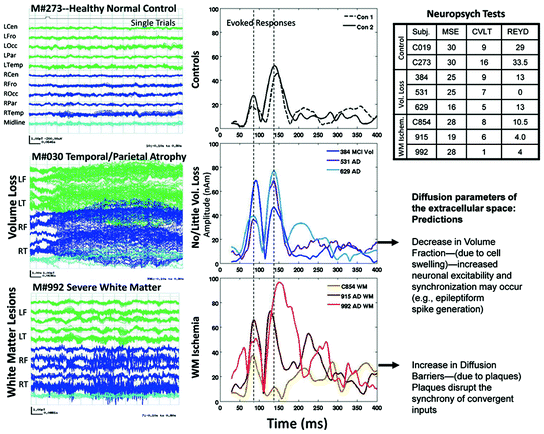
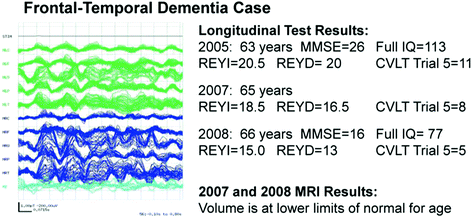

Fig. 2
Left Column (Top) Single-trial MEG responses from a healthy control evoked by a tone. This 1,000 ms segment (100 ms pre-stimulus and 900 ms post-stimulus) shows low-amplitude, de-synchronized activity from 275 sensors grouped by head regions; green and blue tracings represent left and right hemispheres, respectively. Middle Slow-wave activity is evident for this participant with MR abnormalities. Bottom High frequency activity over right temporal and frontal regions for another participant with MRI abnormalities. Middle Column Averaged time-courses localized to the superior temporal gyrus (STG) for (Top) 2 healthy controls and (Middle) 3 patients revealing moderate-severe volume loss and (Bottom) for 3 patients revealing moderate-severe white matter ischemia. Right Column (Top) Sample neuropsychological test results are shown for each patient and control. Bottom Predictions relating diffusion parameters of extracellular space to characteristics seen in the MEG data. MSE mini-mental status exam; CVLT Trial 5 of the California Verbal Learning Test; REYD Delayed recall on the Rey complex Figure Test

Fig. 3
Abnormal Rhythmic Patterns in Frontal-Temporal Dementia. MMSE Mini-mental status Exam; REYI Immediate recall on the Complex Figure Test; REYD Delayed recall on the Complex Figure Test; CVLT Trial 5 of the California Verbal Learning Test. MRI results were still within normal limits
5 Conclusions
If various causes and predisposing factors of AD reflect an interaction of biological and environmental influences (Small 1998), then health of the elderly, in addition to those suspected of probable AD, should be documented in research studies. Yet, most research participants do not complete neurological exams, blood tests, and even when the protocol requires the acquisition of MRIs, they are often not read by a neuroradiologist nor are subjects excluded from the study when MRIs reveal abnormalities for studies of healthy aging. Certainly, many more insults could have occurred in the brains of the elderly group, compared to the young, and in the brains of those suffering from cognitive impairment compared to normal elderly. At minimum, perhaps a structured interview could help determine the suitability of potential applicants for each study by asking a standard set of questions (e.g., have you ever experienced loss of consciousness for greater than 5 min? Did your doctor ever tell you that you have high blood pressure?).
As mentioned earlier, several recent studies found that WMHs associated with cardiovascular disease (e.g., hypertension and diabetes) target prefrontal cortex and affect working memory (DeCarli et al. 1999; Gunning-Dixon and Raz 2000; Artero et al. 2004; Jeerakathil et al. 2004; Kuo and Lipsitz 2004; Schmidt et al. 2004; Tullberg et al. 2004; Nordahl et al. 2006; Pantoni et al. 2007; Burgmans et al. 2010


Stay updated, free articles. Join our Telegram channel

Full access? Get Clinical Tree


