Degenerative Disease
Degenerative Spinal Stenosis
Degenerative spinal stenosis can be central, subarticular (lateral recess) in location (the space between the posterior margin of vertebral body and the anterior margin of superior facet, bounded by the thecal sac medially and the pedicle laterally), or foraminal. Degenerative disease anteriorly (a disk bulge with or without accompanying osteophyte), posteriorly due to ligamentum flavum buckling or thickening, and posterolaterally due to facet joint hypertrophy can all contribute to spinal canal stenosis. In the lumbar spine, it is very common to have all three elements contributing ( Fig. 3.69 ).

The ligamenta flava are paired, thick ligaments (predominantly composed of elastic fibers) that connect the lamina of adjacent vertebral bodies. They extend from the anteroinferior aspect of the superior lamina to the posterosuperior aspect of the inferior lamina. The ligamenta flava increase in thickness normally from the cervical to the lumbar regions. They are situated posterolaterally in the canal, and anterolaterally are contiguous with the capsule of the facet joint. In degenerative disease, the ligamentum flavum becomes visibly thickened, and thus may cause narrowing of either the lateral recess or spinal canal. In regard to facet joint hypertrophy, hypertrophy of the superior articular facet is a primary cause of lateral recess stenosis, and resulting nerve compression. Epidural lipomatosis is simply excessive fat deposition in the epidural space. It is seen in chronic steroid use and in morbid obesity, and is usually thoracic and lumbar in distribution. It is reported that patients can become symptomatic, due to compression of the thecal sac.
The neural foramen is bounded by the pedicles superiorly and inferiorly, the vertebral body and disk anteriorly, and the facets posteriorly. Nerve roots exit from the thecal sac, pass through the lateral recess, and enter the neural foramen. Degenerative disease of the disk, endplates, and facets can all contribute to neural foraminal narrowing ( Fig. 3.70 ).

Imaging of the neural foramina, specifically for evaluation of narrowing, is best performed in the sagittal plane, but more specifically in the true cross-section to the foramen. In the lumbar spine, direct sagittal imaging approximates this plane. However, in the cervical spine, acquisition (or reconstruction) of planes that are oblique in two dimensions are necessary. This is required due to the course of the neural foramina in the cervical spine, which is both anterolateral and superoinferior. Neural foraminal narrowing in the lumbar spine, as viewed on the basis of sagittal MR, is specifically assessed by evaluation in both the craniocaudal and AP directions for perineural fat obliteration, and (for the most severe disease) by direct nerve root compression or morphologic change. Evaluation of foraminal stenosis should thus include a description of the specific fat planes that are obliterated, together with any changes in morphology of the nerve itself (due to compression). Although degenerative neural foraminal narrowing is commonly seen in patient exams, the correlation between clinical symptomatology and MR imaging appearance is generally poor.
Disk, Endplate, Foraminal, and Spinal Canal Disease
Cervical Spine
The cervical spine is most mobile at C4–5, 5–6, and 6–7, with most disk herniations occurring at these levels. The age of presentation is commonly the third to fourth decades. MR is the examination of choice. Thin section axial gradient echo T2-weighted scans are critical for diagnosis, supplemented by sagittal imaging. A very thin rim of low signal intensity can often be visualized on axial T2-weighted scans along the posterior aspect of the disk (in both normal patients and in the presence of a herniation), corresponding to the dura, volume averaged together with the posterior longitudinal ligament. Thin section post-contrast axial T1-weighted scans are usually not acquired in patients with radiculopathy; however, these do substantially improve visualization of foraminal disk herniations due to enhancement of the epidural venous plexus. In the cervical spine, the normal epidural venous plexus is prominent, and can be dilated adjacent to a disk herniation. Foraminal disk herniations in particular can be difficult to visualize, due to the relative isointensity of the disk to epidural venous plexus on axial gradient echo T2-weighted scans.
Symptoms from an acute cervical disk herniation can be radicular, due to a posterolateral or foraminal location ( Fig. 3.71 ), or myelopathic, with large central herniations. On high-resolution thin section axial gradient echo T2-weighted scans, the dorsal and ventral nerve roots, as they exit from the cervical cord, can be identified. Paired denticulate ligaments can also be commonly identified, interposed between the nerve roots. These consist of triangular ligament extensions with a broad base along the lateral margin of the cord and their apex attaching laterally to the dura.
As previously discussed, but worth repeating, there are seven cervical vertebrae and eight cervical nerves, C1–C8. The cervical nerves exit through the foramina above the corresponding numbered vertebrae, with C8 exiting in the foramen below the C7 vertebra. Thus, a posterolateral or foraminal disk herniation at C6–7 will cause compression of the C7 cervical nerve. Knowledge of the cervical dermatomes is important for correlation of clinical symptoms with anatomic findings, with pain diagrams distributed commonly to patients prior to the exam in many clinics. These are also very helpful in the thoracic and lumbar spine. The anatomic distribution of C6, C7, and C8 is easy to remember, with the C7 distribution including the middle finger, C6 including the thumb, and C8 including the fourth and fifth fingers.
An acute cervical disk herniation will be visualized as an anterior (or anterolateral or foraminal) epidural soft tissue mass ( Fig. 3.72 ). Close inspection of the cervical foramina is mandated, since a disk herniation in this position ( Fig. 3.73 ) is often much less evident than those that are central or paracentral in location. The abnormal soft tissue will be contiguous with the disk space, with the only exception being that of a free disk fragment. It should be noted, however, that the majority of free disk fragments will lie immediately adjacent to, and be inseparable from, the native disk. Disk herniations have signal intensity similar to, on both T1- and T2-weighted scans, the native disk. The focal nature of a disk herniation is used to differentiate this process from a disk bulge, with the latter often defined as a process involving 180 degrees or more of the disk circumference. In older patients, and those also involved long term in activities associated with marked motion of the cervical spine, asymptomatic chronic disk herniations are commonly observed ( Fig. 3.74 ).


Although often difficult in an individual patient to differentiate from an acute disk herniation, the presence of associated bony spurs extending from the vertebral body endplates can be used to identify a chronic disk herniation ( Fig. 3.75 ). These bony spurs occur due to bone remodeling, with elevation of the periosteum by a disk herniation and subsequent bone deposition. Myelopathic symptoms are more common with chronic disk herniations, with radicular symptoms common in acute disk herniations ( Fig. 3.76 ).


Hypertrophic endplate spurs, also referred to as diskosteophyte complexes, are commonly seen on both MR and CT, and are typically asymptomatic. Given how frequent these are—most older patients have at least mild multilevel disease—it is not surprising that these do not correlate well with symptoms. Disk-osteophyte complexes are felt to be the end result of a disk bulge, which is defined as circumferential expansion of the disk, specifically greater than 180 degrees (and not focal, as with a chronic disk herniation). In many instances the chronic nature of this process can be identified on MR, due to the presence of associated broad based osteophytes (which manifest low signal intensity on all MR sequences) ( Fig. 3.77 ).

These osteophytes are well identified on CT, albeit the associated disk bulge is often poorly visualized. One special area of note in the cervical spine involves the uncovertebral joints. These small synovial lined joints (also known as the joints of Luschka) lie between the uncinate processes of the lower cervical vertebrae posteriorly and laterally, and allow for flexion and extension, while limiting lateral flexion. Uncovertebral joints are present from C3 to C7, with encroachment upon the foramina anteriorly due to degenerative involvement occurring from C2–3 to C6–7. Hypertrophy of the uncovertebral joint is not uncommon in older patients, often asymmetric when comparing side to side and, together with facet osteoarthritis (posteriorly), causes foraminal narrowing in the AP dimension ( Fig. 3.78 ). Disk space narrowing is an additional cause of foraminal narrowing, decreasing the height of the neural foramen, with the end result of all these factors being nerve root compression.

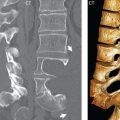
Degenerative foraminal narrowing is common in older patients. The bony encroachment of the foramina is well visualized on CT, with sagittal reformatted images important in this regard. On CT it is readily evident that the osteophyte commonly extends into the mid-portion of the foramen, dividing the foramen into an upper and lower portion. Keeping this in mind, it is not surprising that, on thin section axial MR images, depiction of the foramen can be limited and misleading. With a large osteophyte lying in the mid-portion of the foramen, unless axial imaging is performed with very thin sections, partial volume imaging will lead to poor visualization of the encroachment. In the cervical spine, the standard MR sequences used for evaluation of the neural foramina include thin section T2*-weighted gradient echo imaging in the axial plane ( Fig. 3.79 ) and fast spin echo T1- and T2-weighted imaging in the sagittal plane. Due to the anterolateral, and slight inferior, course of the neural foramina, oblique sagittal images are, however, best for visualization of the foramina on MR, and should be routinely acquired.

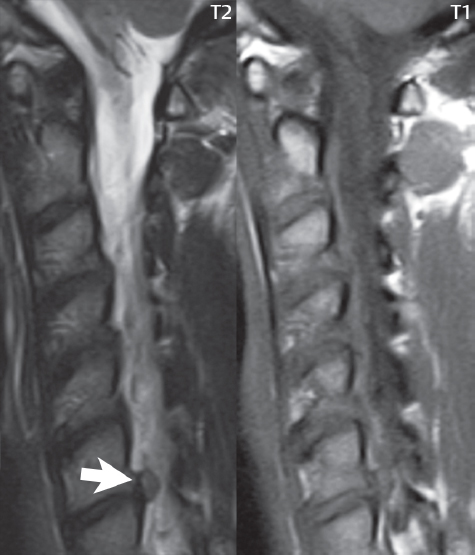
Ossification of the posterior longitudinal ligament is an uncommon cause of acquired cervical spinal stenosis. There is an increased incidence in Asian patients, in particular Japanese. Other, more common etiologies of cervical spinal stenosis include ligamentous infolding and facet joint hypertrophy. As with all cases of spinal stenosis, patients are at greater risk for traumatic spinal cord injury. The posterior longitudinal ligament is prominent, with low signal intensity on both T1- and T2-weighted scans ( Fig. 3.80 ), and in some instances with intermediate signal intensity centrally within focally prominent areas of ligamentous infolding. Involvement is multilevel and can be continuous or segmental. Spinal cord compression is seen with more prominent disease involvement.

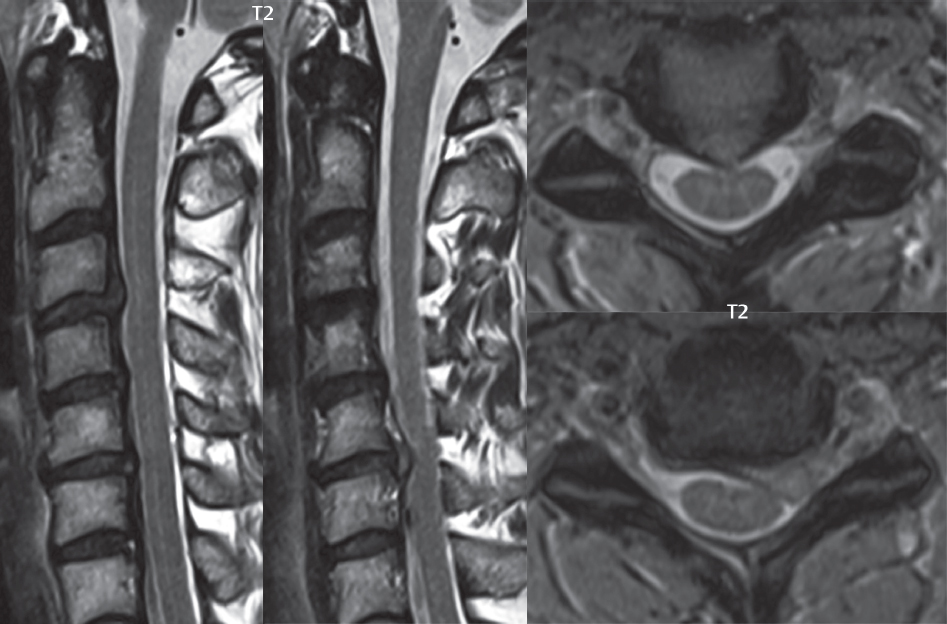
Degenerative (acquired) spinal stenosis, previously discussed in general terms, is caused by advanced degenerative disk disease, with the latter process also referred to by the term spondylosis ( Fig. 3.81 ). Contributing factors include decreased disk height with thickening and buckling of the intraspinal ligaments, prominence of the posterior longitudinal ligament and ligamentum flavum, disk bulges, herniations, and osteophytic spurs (anterior to the thecal sac), and hypertrophy of the facet joints (posterior to the thecal sac). Symptom onset is skewed toward the older population, and to some degree thus differentiated from acute disk herniations. Symptoms are myelopathic and include progressive/intermittent numbness, weakness of the upper extremities, pain, abnormal reflexes, muscle wasting (involving the interosseous muscles of the hand), and staggering gait. Although commonly not quantified, defined measurements are established for spinal stenosis, with evaluation best on axial images. Normal is defined as > 13 mm, borderline being 10 to 13 mm (these patients may experience symptoms), and < 10 mm diagnostic of cervical spinal canal stenosis. The most commonly affected levels are C4–5, 5–6, and 6–7, with multilevel involvement common. In mild spinal canal stenosis the ventral subarachnoid space will be effaced. With more severe disease there will be cord flattening. In advanced disease, myelomalacia, specifically edema, gliosis, and cystic changes can be present.

Thoracic Spine
Disk herniations in the thoracic region are less common, as compared to their counterparts in the cervical and lumbar regions. Clinically, radicular symptoms with a dermatomal distribution may be seen ( Fig. 3.82 ). From published literature series, symptomatic thoracic disk herniations are most commonly present in the lower thoracic spine, from T9–10 to T11–12. Acute cord compression with myelopathy is rare.

The imaging evaluation of thoracic disk herniations is the province of MR. Diagnosis requires thin sections with high image quality, and specifically implementation of strategies to minimize motion artifacts due to the heart, respiration, and CSF pulsation ( Fig. 3.83 ). With excellent image quality, sensitivity is high even to very small disk herniations. In the past, specific level localization on MR was difficult; however, today, high-quality sagittal scout images of the cervicothoracic region can be acquired, with these mandatory for correct level identification (see Fig. 3.82).

There is a high incidence of chronic asymptomatic small thoracic disk herniations on routine MR imaging ( Fig. 3.84 ). Deformity of the cord contour is also common, often in the absence of any clinical symptoms and occurring even with very small herniations. In this regard it should be kept in mind that the MR evaluation is performed in only one position (supine), and is not physiologic, with disk herniations when the patient is upright, and particularly in flexion, likely causing impact upon nerves and the cord not seen by MR.

Related posts:
Stay updated, free articles. Join our Telegram channel

Full access? Get Clinical Tree


