Fig. 9.1
[18F]FDG-PET images obtained in a healthy control (upper row) and an AD patient (lower row). Red arrows indicate the posterior cingulate and bilateral parietotemporal regions that are typically hypometabolic in AD patients. Note there is sufficient uptake of the radiotracer in the healthy control
9.2.3 FDG-PET in Dementia with Lewy Bodies
[18F]FDG-PET is also frequently used to differentiate AD from other forms of dementia. The differential diagnosis of AD versus non-AD types of dementia using visual reading of [18F]FDG-PET scans showed a sensitivity of 87 % and a specificity of 81 % (Silverman et al. 2001; Minoshima et al. 2001; Jagust et al. 2007; Foster et al. 2007; Panegyres et al. 2009). FDG-PET scans of patients with DLB consistently display metabolic reductions in the medial occipital cortex with relative sparing of the posterior cingulate cortex (Fig. 9.2) (Ishii et al. 1998a, b). The latter has been referred to as the “posterior cingulate island sign,” as it appears that the posterior cingulate floods in a sea of glucose hypometabolism. It has been found that the presence of occipital hypometabolism can distinguish DLB from AD with a sensitivity of 90 % and a specificity of 80 % using postmortem examination of the brain as gold standard (Minoshima et al. 2001). In another study, the posterior cingulate island sign showed 100 % specificity for the diagnosis of DLB, with sensitivity ranging between 62 and 82 % (including autopsy confirmation of the diagnosis in a subset of patients) (Lim et al. 2009). Dopamine transporter imaging (paragraph 4) is an alternative approach to differentiate between AD and DLB.
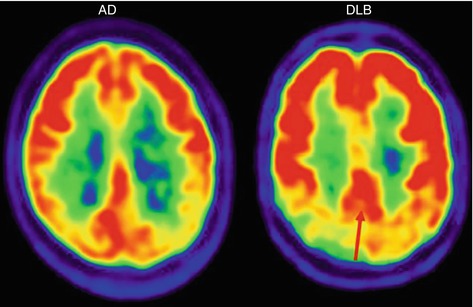
Fig. 9.2
[18F]FDG-PET images obtained in an AD patient (left panel) and a DLB patient (right panel). The red arrow indicates the “posterior cingulate island sign,” often seen in DLB patients. The posterior cingulate is relatively spared and floods in a sea of glucose hypometabolism in the occipital cortex. A reversed pattern can be appreciated in AD where the occipital cortex is only mildly affected in early stages next to severe metabolic loss in the posterior cingulate
9.2.4 FDG-PET in Frontotemporal Dementia
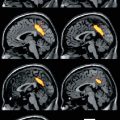
FDG-PET can also be applied to distinguish AD patients from patients with FTD. In patients with FTD, hypometabolism can be appreciated in the orbitofrontal, dorsolateral prefrontal cortex, insular, anterior cingulate, and anterior temporal cortices (see Fig. 9.3) (Foster et al. 2007: Salmon et al. 2003, 2006; Diehl-Schmid et al. 2007; Ishii et al. 1998a, b). Glucose hypometabolism in the medial frontal cortex is not only observed in FTD patients but also may occur in asymptomatic elderly or in individuals suffering depression, alcohol abuse, or late-onset schizophrenia (Holthoff et al. 2004; Moeller et al. 1996; Moreno-López et al. 2012; Buchsbaum et al. 1992). As such, aging and psychiatric comorbidity may hinder the evaluation of FDG-PET in patients with FTD (Reischle et al. 2003). Visual assessment of FDG-PET has been reported to distinguish clinically diagnosed FTD from AD with a sensitivity of 97 %, specificity of 86 %, and accuracy of 93 % (Foster et al. 2007). In more advanced stages of dementia, patients with AD show also profound frontal hypometabolism, while, vice versa, patients with FTD may display reduced glucose metabolism in the posterior cingulate gyrus. This makes it more difficult to distinguish FTD from AD in advanced stages of the disease. In these particular cases, amyloid imaging could be helpful as FTD patients supposedly have negative amyloid scans (see paragraph 3).
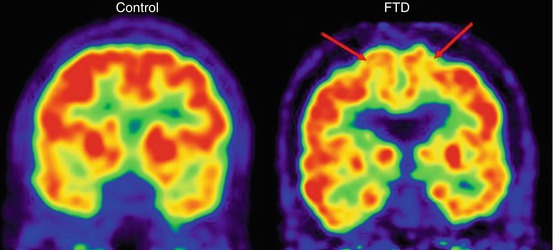
Fig. 9.3
[18F]FDG-PET images obtained in a healthy control (left panel) and a FTD patient (right panel). The red arrows indicate glucose hypometabolism in the frontal cortex regions which is typically observed in FTD patients
9.2.5 FDG-PET in Corticobasal Degeneration and Progressive Supranuclear Palsy
Corticobasal degeneration (CBD) and progressive supranuclear palsy (PSP) are both characterized neuropathologically by tau-positive inclusions and clinically by parkinsonian features. CBD patients are typically unilaterally affected which may result in motor problems contralateral to the affected hemisphere. This is reflected on FDG-PET by a rather asymmetric pattern of glucose hypometabolism (Fig. 9.4). This usually comprises large parts of the cortex including parietotemporal regions, prefrontal cortex, and motor cortex as well as the basal ganglia (Hosaka et al. 2002; Juh et al. 2005; Teune et al. 2010). A characteristic feature of PSP is decreased glucose metabolism in the mesencephalon. In addition, PSP patients show reduced metabolic activity in the entire prefrontal cortex, including superior and inferior frontal gyrus, supplementary motor area, primary motor cortex, and middle cingulate gyrus, as well as in the caudate nucleus and thalamus (Hosaka et al. 2002; Juh et al. 2005; Teune et al. 2010).
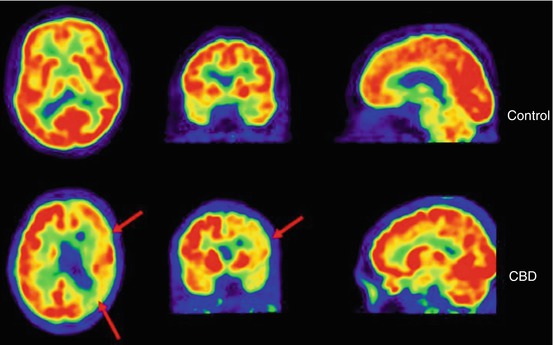
Fig. 9.4
[18F]FDG-PET images obtained in a healthy control (left panel) and a CBD patient (right panel). The red arrows indicate an asymmetric pattern of glucose hypometabolism which is, in addition to basal ganglia involvement, characteristic for CBD
9.2.6 Conclusion
FDG-PET is an established and well-validated marker in the field of dementia. FDG-PET is most powerful for an early diagnosis of dementia, but it is also an effective tool to provide essential information to clinicians who face complex differential diagnoses. To conclude, FDG-PET is a useful, although imperfect, adjunct to standard diagnostic work-up in a memory clinic for the evaluation of dementia.
9.3 Amyloid Imaging Using PET
9.3.1 Introduction
A definitive diagnosis of AD can only be established after postmortem verification of amyloid plaques and neurofibrillary tangles. This inspired investigators to search for a radiotracer that enables visualization and quantification of the neuropathological hallmarks of AD in vivo using PET. To date, the most extensively used and evaluated tracer for detection of AD pathology is [11C]-labeled Pittsburgh Compound-B (PIB) (Klunk et al. 2004). [11C]PIB binds selectively to fibrillar amyloid-beta (Aβ) in β-sheet confirmation, but not to neurofibrillary tangles, prion amyloid, and α-synucleinopathy (Klunk et al. 2003; Ikonomovic et al. 2008; Villemagne et al. 2009; Burack et al. 2010). The first [11C]PIB-PET study in humans was published in 2004 and showed good contrast between AD patients and controls (Klunk et al. 2004). The use of [11C]PIB has grown exponentially ever since and caused a major paradigm shift in diagnostic thinking which led to new diagnostic criteria for AD and MCI that integrate PET imaging. The development of [18F]-labeled amyloid tracers, e.g., florbetapir, flutemetamol, and florbetaben (Clark et al. 2011; Vandenberghe et al. 2010; Barthel et al. 2011) will further increase clinical use of amyloid imaging in the memory clinic. The longer half-life time of [18F] compared to [11C] (110 versus 20 min, respectively) enables tracer transportation to medical centers with a PET camera but without synthesis facilities. It also reduces costs as multiple patients can be scanned using a single production. This paragraph will focus on amyloid PET studies in patients with AD, non-AD dementias, or mild cognitive impairment (MCI) and cognitively normal individuals.
9.3.2 Amyloid PET in Alzheimer’s Disease
AD patients typically show increased cortical [11C]PIB retention that is most pronounced in the frontal cortex and precuneus, followed by parietal, temporal, and occipital lobes and the striatum (Fig. 9.5) (Klunk et al. 2004; Ossenkoppele et al. 2012a, b). In contrast, subcortical white matter structures, pons, and cerebellum are usually devoid of amyloid plaques and are therefore often used as reference region. This regional binding pattern of [11C]PIB strongly correlates with the distribution of amyloid plaques in brain tissue at autopsy (Thal et al. 2002).
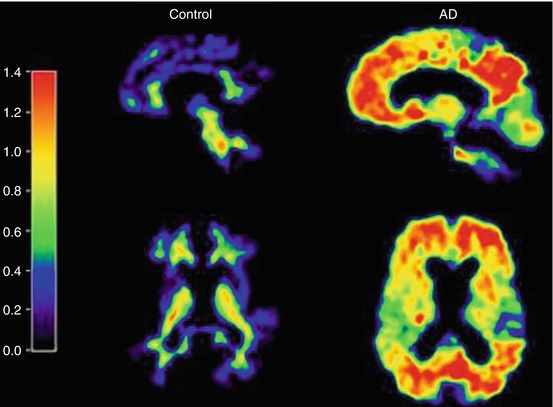
Fig. 9.5
Parametric [11C]PIB-PET images obtained in a healthy control (left panel) and an AD patient (right panel). Note the binding of the radiotracer throughout the cortex in AD, whereas predominantly (nonspecific) white matter binding is seen in the healthy control
Visual assessment of parametric [11C]PIB images is straightforward and shows high agreement between readers (Κ = 0.85–0.90) (Ng et al. 2007; Tolboom et al. 2010). [11C]PIB images are considered “positive” if there is binding in any of the cortical regions (e.g., frontal parietal, temporal, or occipital) and “negative” if there is predominantly white matter uptake. Another way to determine [11C]PIB positivity or negativity is using quantitative cut-offs that are usually based on the optimal discriminative binding value between AD patients and healthy controls. This value depends strongly on the analytical method of choice and may thus differ substantially between centers. Visual assessment of [11C]PIB images obtained from 35 AD patients and 45 healthy controls showed 100 % sensitivity, 85 % specificity, and an overall accuracy of 92 % against clinical diagnosis (Ng et al. 2007; Tolboom et al. 2010). A literature review by Klunk (2011) showed that 328 of 341 (96 %) patients with a clinical diagnosis of AD exceeded a quantitative threshold for PIB positivity. In a recent study that selected patients with a complex differential diagnosis, however, 39 % of patients with a clinical diagnosis of AD appeared PIB-negative (Ossenkoppele et al. 2012a). Studies have demonstrated insensitivity of [11C]PIB-PET to detect more soluble species and atypical amyloid deposits in patients with sporadic AD (Leinonen et al. 2008; Ikonomovic et al. 2012). Nevertheless, the most likely explanation for a negative PIB-scan in patients classified as AD is misdiagnosis, as clinical presentation can overlap substantially with other forms of dementia (Galton et al. 2000).
9.3.3 Amyloid PET in Non-Alzheimer Dementias
Patients with dementia frequently show presence of multiple types of neuropathology, also referred to as “mixed disease.” As a consequence, a substantial number of patients with a neurodegenerative disease other than AD test positive on [11C]PIB-PET. It is important to understand that [11C]PIB-PET only indicates whether or not an individual harbors Aβ pathology in the brain; it is not a surrogate for the clinical diagnosis of AD. For instance, approximately 20 % of patients with a clinical diagnosis of FTD show evidence for Aβ pathology on [11C]PIB-PET (Engler et al. 2008; Rabinovici et al. 2011). This may partially be explained by patients who mimic an FTD clinical syndrome that is actually driven by AD pathology. Another possibility is that both FTD and AD pathology are present, with FTD pathology (e.g., TDP-43 or tau-positive inclusions such as Pick’s disease or MAPt gene mutations) being the force driving the clinical presentation. Evidence for the latter was found in a patient with a clinical presentation suggestive for FTD, a frontotemporal hypometabolic pattern on [18F]FDG-PET, but also Aβ-positivity on [11C]PIB-PET (Caso et al. 2012). On autopsy, this patient met neuropathological criteria for both Pick’s disease (variant of FTD) and AD. What we learn from this case is that Aβ positivity on PET does not rule out other underlying neuropathological substrates and that neurodegenerative markers such as FDG-PET provide useful clinical directions in these particular cases.
DLB is an α-synucleinopathy in which patients test positive on PIB-PET in up to 89 % of cases (Gomperts et al. 2008). Again, autopsy studies have proven these are not false-positive findings but truly reflect AD pathology, next to the presence of Lewy bodies (Harding and Halliday 2001). Vascular dementia (VaD) is another neurodegenerative disease characterized by mixed pathology. Lee et al. (2011) showed that approximately one-third of VaD patients are PIB-positive, thus two-third showing pure subcortical vascular dementia. PIB-PEt also detects cerebrovascular Aβ as present in cerebral amyloid angiopathy (CAA) (Johnson et al. 2007). More research in tauopathies such as CBD and PSP or other less-prevalent causes of cognitive impairment is needed to accurately determine comorbid Aβ pathology in demented patients.
To conclude, the studies listed in this paragraph illustrate that careful interpretation of Aβ-positive PET scans in patients with an initial non-AD diagnosis is warranted.
9.3.4 Amyloid PET in Mild Cognitive Impairment
MCI is considered a transitional stage between normal aging and dementia, in particular AD (Petersen et al. 1999). Approximately 50 % of MCI patients progress to AD within 3 years (DeCarli 2003; Farias et al. 2009). In prospect of disease-modifying treatments, it is important to identify patients in the prodromal phase of AD as interventions may be (more) effective in earlier stages of the disease. In a literature review, Klunk (2011) reported that 161 of 272 (61 %) MCI patients were PIB-positive. 57 of 101 (56 %) PIB-positive MCI patients with available clinical follow-up data (average ~2 years) progressed to AD, whereas only four of 54 (7 %) PIB-negative MCI patients converted to AD. PIB-PET thus seems a strong predictor for progression to AD in MCI patients and can be applied to improve diagnostic accuracy of prodromal AD in this patient group (Ossenkoppele et al. 2011).
Initially, it was thought that the deposition of amyloid plaques predominantly occurs in the preclinical stage of AD and reaches a relative plateau by the time clinical symptoms emerge. Recent data, however, shows that [11C]PIB retention increases when MCI patients are followed over time by 2–5 % annually (Ossenkoppele et al. 2011; Koivunen et al. 2011). This has important implications for monitoring future clinical trials with disease-modifying agents that target Aβ. Instead of the previously assumed amyloid plateau, prodromal AD patients may actually show an increase in amyloid plaque formation.
9.3.5 Amyloid PET in Cognitively Normal Elderly
The development of [11C]PIB allowed for the first time in vivo testing of the amyloid cascade hypothesis. This leading hypothesis for the pathogenesis of AD states that Aβ initiates a cascade of neuropathological events (e.g., neurofibrillary tangle formation, inflammation of the brain, or vascular pathology) that lead to neuronal damage and cell death and ultimately results in the onset of dementia (Hardy and Higgins 1992; Hardy and Selkoe 2002). Aβ starts to accumulate approximately 15 years before the first clinical signs of AD and is present in 20–40 % of asymptomatic elderly (Rowe et al. 2010; Fleisher et al. 2012). The two major risk factors of AD (age and APOE genotype) are strongly associated with greater amyloid pathology in asymptomatic individuals. There is increasing evidence that this is not benign, as individuals with cerebral amyloidosis are at risk for future cognitive decline (Villemagne et al. 2011a, b; Morris et al. 2009; Storandt et al. 2009; Resnick et al. 2010) and show already subtle morphological changes in AD-specific regions (Dickerson et al. 2009; Mormino et al. 2009; Chételat et al. 2010; Oh et al. 2011; Becker et al. 2011). At a functional level, amyloid pathology in cognitively normal persons is often associated with heightened brain activity (Cabeza et al. 2002; Rosen et al. 2002; Park and Reuter-Lorenz 2009; Mormino et al. 2012) that may reflect a compensatory response of the brain to neurotoxicity of Aβ (Cohen et al. 2009). These findings may suggest that elderly with cerebral amyloidosis are, at least temporarily, able to preserve cognitive function through altered neuronal function. More research with extended follow-up, preferably followed by neuropathological examination, is needed to determine the significance of Aβ pathology in asymptomatic individuals.
Not much is known about changes in the spatial distribution of amyloid plaques throughout the brain. Amyloid plaque depositions seem to occupy the entire neocortex, probably most prominently in the frontal cortex and precuneus and posterior cingulate complex and with relative sparing of the medial temporal lobes. Changes over time occur in a rather global pattern without specific brain regions showing more rapid plaque growth compared to other regions (Villemagne et al. 2011a, b; Vlassenko et al. 2011; Ossenkoppele et al. 2012a, b).
9.3.6 Amyloid PET Versus CSF Measurements
Amyloid imaging is an expensive technique, and with Aβ measurements in CSF, there is a cheaper alternative available. CSF has the advantage that it obtains multiple measures at the same time (e.g., Aβ-42, Aβ-40, p-tau, t-tau) and it does not expose patients to radiation (Blennow and Hampel 2003). Disadvantages are that it is an invasive technique and analyses are hindered by standardization problems (Verwey et al. 2009). Amyloid PET and CSF-Aβ tend to correlate well (between −0.48 and −0.72) but concordance ranges from only 54–100 % (Fagan et al. 2006; Koivunen et al. 2008; Jagust et al. 2009; Tolboom et al. 2009a, b), indicating that they measure different aspects of amyloid pathology. Amyloid PET maps fibrillary amyloid deposits, whereas in CSF the more soluble species of Aβ are detected. This discrepancy is nicely illustrated in patients with a rare Arctic APP mutation that obstructs fibrillization of Aβ. These patients show AD-like Aβ levels in CSF, whereas there is absence of [11C]PIB retention (Schöll et al. 2012). Head-to-head comparisons in a memory clinical population are needed to determine test characteristics for these biomarkers.
9.3.7 Conclusions/Concluding Remarks
Amyloid imaging is a relatively novel technique that is currently in transition from being solely a research tool towards the establishment as a diagnostic marker. Amyloid imaging shows great promise for an early diagnosis of AD and can assist in the differential diagnosis. The biggest challenge for interpreting an amyloid PET scan is the presence of comorbid pathology in non-AD types of dementia, particularly in the elderly. With the development of several [18F]-labeled amyloid ligands and approval of [18F]Amyvid by the FDA and the European Commission, it is expected that amyloid imaging will become a prominent diagnostic tool for evaluating patients with cognitive complaints.
9.4 DAT SPECT
9.4.1 Introduction
In 2005, the revised criteria for the clinical diagnosis of DLB were published (McKeith et al. 2005). In these revised criteria, reduced striatal dopamine transporter (DAT) binding is given greater diagnostic weighting, and reduced striatal DAT binding is now recognized as a suggestive feature of DLB (McKeith et al. 2005). This change in the criteria for the clinical diagnosis of DLB is mainly driven by results of molecular imaging studies of the DAT.
It has been well known that, like other diseases characterized by Lewy body pathology (e.g., Parkinson’s disease), DLB is also characterized by loss of dopamine neurons, including striatal DATs (Perry et al. 1998; Piggott et al. 1999). This is not surprising given that the DAT is expressed exclusively in dopaminergic neurons. In a postmortem study (Piggott et al. 1999), DAT binding (measured with [3H]mazindol) was significantly reduced in the caudal putamen (57 % loss). Nowadays, striatal DAT binding can be measured accurately in living human brain with PET and SPECT. Already in the 1990s, initial DAT SPECT studies showed the ability to detect loss of striatal DAT binding in DLB patients (Donnemiller et al. 1997; Walker et al. 1999). This finding was replicated by many other DAT SPECT studies that were published in this century (Morgan et al. 2012; O’Brien et al. 2004, 2009; McKeith et al. 2007; Roselli et al. 2009; Auning et al. 2011; Van Laere et al. 2006). Importantly, DAT SPECT imaging may even detect the preclinical phase of DLB, which may indicate that this techniques is sensitive to detect loss of nigrostriatal neurons (Iranzo et al. 2010). Degeneration of the nigrostriatal cells in DLB patients has been confirmed by PET studies ([18F]DOPA PET and studies that imaged the monoamine vesicular transporter availability) (Hu et al. 2000; Koeppe et al. 2008; Gilman et al. 2004; Burke et al. 2011; Villemagne et al. 2011a, b, 2012).
9.4.2 Role of DAT Imaging in the Differential Diagnosis DLB Versus AD
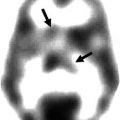
While DLB is characterized neuropathologically by loss of striatal DATs (Fig. 9.6), this loss is less prominent in patients suffering from AD (Perry et al. 1998; Piggott et al. 1999). In line with these autopsy findings, hallmark studies by Walker and colleagues demonstrated that antemortem DAT imaging with SPECT substantially enhanced the accuracy of the differential diagnosis of DLB by comparison with clinical criteria alone (Walker et al. 2002, 2007). More specifically, in eight patients with a neuropathologically confirmed diagnosis of DLB, the antemortem DAT SPECT scan was abnormal in seven of eight patients. In addition, in all nine patients with a neuropathological diagnosis of AD, the DAT SPECT was scored normal (Ishii et al. 2007).
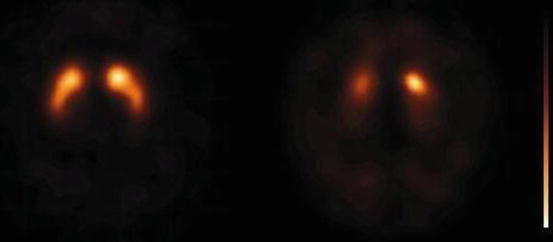
Fig. 9.6
[123I]FP-CIT SPECT scans obtained in a healthy control (left panel) and a DLB patient (3 h after injection). Note the severe loss of binding of the radiotracer in the putamen bilaterally, as well as in the right caudate nucleus in the DLB case
Many DAT SPECT studies showed the ability to differentiate DLB from AD, in that DAT binding was reduced in DLB patients but not in AD (Morgan et al. 2012; O’Brien et al. 2004; McKeith et al. 2007; Auning et al. 2011; Van Laere et al. 2006). Importantly, the results of DAT SPECT imaging may predict which patients with a clinical diagnosis of possible DLB will convert to probable DLB or to AD (O’Brien et al. 2009). Furthermore, a recent meta-analysis concluded that the diagnostic accuracy of DAT imaging with [123I]FP-CIT SPECT in the diagnosis of DLB is high (Papathanasiou et al. 2012). Finally, DAT SPECT may be highly sensitive to differentiate between DLB and AD; the role in the differential diagnosis between FTD and DLB may be limited following a recent study showing that one-third of the FTD patients had an abnormal DAT SPECT scan (Morgan et al. 2012).
9.4.3 DAT Imaging Versus FDG-PET in DLB
As reported in Chap. 2, [18F]FDG hypometabolism in the occipital cortex (including the primary visual cortex and visual association cortex) may be a specific feature by which one is able to differentiate DLB from AD33,38,126. Interestingly, a recent neuropathological study suggested that occipital hypometabolism may be associated with Lewy body pathology. The neuropathological basis of reduced FDG uptake in the temporoparietal association area and in the posterior cingulate cortex (which can be observed both in DLB and AD), however, may be primarily related to AD pathology (Kasanuki et al. 2012). A recent study directly compared DAT SPECT and FDG-PET in the same patient cohort (including neuropathological diagnoses in some of them) (Lim et al. 2009). The diagnostic accuracy for in vivo detection of DLB was greater for DAT SPECT imaging than for FDG-PET (effect sizes 4.1 and 1.9, respectively).
9.4.4 DAT Versus Cardiac Sympathetic Imaging with MIBG SPECT in DLB
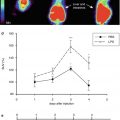
The core clinical features of DLB are well known. However, autonomic dysfunction is also common in α-synucleinopathies like DLB. The most common symptoms are orthostatic hypotension, constipation, and urinary incontinence (Thaisetthawatkul et al. 2004; Stubendorff et al. 2012). Also respiratory autonomic function may be disturbed in DLB (Mizukami et al. 2009). Postmortem and imaging studies in DLB have shown a loss of postganglionic myocardial innervation (Mizukami et al. 2009; Toru et al. 2010), and the results of postmortem studies suggest that the accumulation of α-synuclein aggregates in the distal axons of the cardiac sympathetic nerves may play an important role (Orimo et al. 2008).
The cardiac sympathetic innervation can be imaged with PET and [123I]MIBG SPECT (Goldstein et al. 1997; Booij et al. 2012). MIBG SPECT studies showed severe loss of this particular innervation in DLB (Mizukami et al. 2009; Kashihara et al. 2006; Suzuki et al. 2006). Importantly, MIBG scintigraphy has been suggested to have high sensitivity and specificity in the differential diagnosis of DLB versus Alzheimer’s disease (Taki et al. 2004; Yoshita et al. 2006; King et al. 2011). This technique is now recognized as a suggestive feature in the revised diagnostic criteria for DLB (i.e., commonly present but not proven to have diagnostic specificity, McKeith et al. 2005).
A recent study directly compared cardiac MIBG with brain DAT SPECT in the same cohort of DLB patients (Camacho et al. 2011). All patients with a reduced cardiac MIBG uptake (23 of 28 patients with a clinical diagnosis of DLB) showed also decreased striatal DAT binding. Interestingly, five patients showed normal striatal DAT binding and normal cardiac MIBG uptake. Also, the cardiac MIBG uptake (heart-to-mediastinum ratio) correlated positively with striatal DAT binding ratios. The severity of Parkinsonism was highly correlated with DAT imaging but not with MIBG measures (Camacho et al. 2011).
To accurately estimate the potential value of [123I]MIBG as a diagnostic tool for DLB in the differential diagnosis AD versus DLB, confirmatory studies with larger patient numbers are required (McKeith et al. 2005). In this regard, it should be kept in mind that a decreased MIBG uptake could also be influenced by heart diseases and diabetes. Also, a variety of medications may influence cardiac MIBG uptake (for details see Booij et al. 2012).
9.4.5 Concluding Remarks
DAT imaging is a well-validated technique to detect loss of striatal DATs in DLB. Also, its role in the differential diagnosis of DLB from AD is well established. As such, according to the revised criteria for the clinical diagnosis of DLB, reduced DAT binding is now a feature suggestive of DLB. Both FDG-PET and cardiac sympathetic imaging are promising tools in the differential diagnosis of DLB. In this regard, blinded, prospective studies (ideally involving repeat measurements and postmortem confirmation) are needed to establish the accuracy of both techniques.
9.5 Experimental Radiotracers in Alzheimer’s Disease
9.5.1 Imaging-Activated Microglia in Alzheimer’s Disease
Epidemiological, pathological, and animal studies support the notion that inflammatory mechanisms are involved in the pathogenesis of AD. Activated microglia, the brain’s resident macrophages, play an important role in this inflammatory response. In AD, activated microglia have been associated with senile plaques and neurofibrillary tangles (Streit et al. 1988; McGeer et al. 1988; Kreutzberg 1996) and may be present years before clinical symptoms emerge (DiPatre and Gelman 1997). It is thought that the amyloid (Aβ) peptide itself can induce a local inflammatory response in which fibrillar Aβ is able to activate the classical complement pathway, resulting in the attraction and activation of microglia cells. Recent studies point to the direction that the function of microglia is more versatile than previously thought. The primary role of microglia may be neuroprotection; however, upon excessive activation, microglia might become harmful, resulting in a vicious circle which might be essential for the pathologic progression of AD (Cagnin et al. 2001; Bergfield et al. 2010; Streit et al. 2009; Okello et al. 2009). Therefore, it is thought that activated microglia are directly involved in the neurodegenerative process associated with AD and could therefore be an important diagnostic tool or therapeutic target (Giulian et al. 1996).
9.5.2 Imaging Microglial Activation Using (R)-[11C]PK11195 PET
Imaging microglial activation with PET might improve our understanding of the pathogenesis of AD. This is highly relevant from the perspective of potential interventions that attempt to prevent AD or slow the rate of disease progression. Microglia activation can be quantified in vivo using positron emission tomography (PET) and (R)-[11C]PK11195. (R)-[11C]PK11195 is a highly specific ligand for the peripheral benzodiazepine binding site (PBR). This site, also called the translocator protein (TSPO) (Van Gool et al. 2001), is expressed by cells of the mononuclear macrophage lineage and is markedly increased in activated microglia. TSPO is a hydrophobic protein, primary located in the outer mitochondrial membrane. Usually, low levels of TSPO are present in the brain and they are limited to glial cells (astrocytes and microglia) (Gavish et al. 1999). However, in response to neuronal damage, a dramatic increase in TSPO levels can be found (Chen and Guilarte 2006). Using (R)-[11C]PK11195 and PET, microglia activation has already been demonstrated in several neurodegenerative diseases (Aisen et al. 2002). In AD, several studies assessing microglia activation using PK11195 have been published, using PET (Aisen et al. 2003; Sánchez-Pernaute et al. 2004; Yaqub et al. 2012) and single-photon emission computed tomography (Mourik et al. 2010). Cagnin et al. (2001) performed the first study using the pure (R) enantiomer of PK11195 and described increased binding in several brain areas of eight patients with AD and a single MCI subject (Sánchez-Pernaute et al. 2004). More recently, (R)-[11C]PK11195 binding in MCI patients (Yaqub et al. 2012; Mourik et al. 2010; Brix et al. 1997; Maeda et al. 2004) was found to be either increased or unchanged. In another study, only small clusters of increased (R)-[11C]PK11195 binding were found in several brain areas in MCI and AD (Schuitemaker et al. 2012). Okello et al. (2009) demonstrated increased (R)-[11C]PK11195 binding in the frontal cortex in [11C]PIB-positive MCI patients, suggesting that microglia activation is mainly associated with amyloid plaque deposition. Increased (R)-[11C]PK11195 binding in MCI patients indicates that microglia activation is present relatively early in the course of AD. This is in agreement with postmortem studies demonstrating that activation of microglia precedes neurodegenerative changes in the neocortex (Veerhuis et al. 2003; Rozemuller et al. 1989). Consequently, one might expect differences between MCI patients who progress to dementia and those who remain clinically stable. However, (R)-[11C]PK11195 binding was not associated with clinical progression, and there were no correlations between global cognitive function at baseline and (R)-[11C]PK11195 binding in any of the brain regions (Schuitemaker et al. 2012), which is consistent with previous findings (Okello et al. 2009). It is unclear whether this truly reflects absence of biological relationships between microglia activation and disease progression or that current measurement lack sensitivity to probe this association.
9.5.3 Future Perspectives of Microglial Imaging
Although in vivo imaging of microglia activation using (R)-[11C]PK11195 has provided important information in a variety of neurological disorders, the high level of nonspecific binding and associated low signal-to-noise ratio makes quantification of the signal difficult. Therefore, many radiopharmaceutical research groups worldwide presently are pursuing development of new tracers with a more favorable binding profile. Recently, a number of novel TSPO receptor ligands have been synthesized. [11C]DAA1106 is a ligand that binds selectively and with higher affinity to the TSPO receptor than (R)-[11C]PK11195. Other ligands like [11C]DPA-713 and [18F]DPA-714 also have potential as a potent measure for microglia activation studies, showing higher affinity and better signal-to-noise ratio than (R)-[11C]PK11195 (Boutin et al. 2007; Doorduin et al. 2009). [11C]PBR28 is another ligand with lower lipophilicity than (R)-[11C]PK11195 and [11C]DAA1106, which has also favorable characteristics. First, results were promising as high-specific binding in monkey brain was found (Briard et al. 2008). However, it appeared that 10–14 % of human subjects show no binding to [11C]PBR28 due to a tenfold lower affinity for PBR28 than in binders (Owen et al. 2010; Kreisl et al. 2010). Subsequent quantitative analyses revealed three binding affinity patterns in human subjects, i.e., high-, median-, and low-affinity binding patterns. Substantial differences were found between high-affinity, medium-affinity, and low-affinity binders for the TSPO ligands PBR28, PBR06, DAA1106, DPA713, and PBR111 (Owen et al. 2011). For (R)-[11C]PK11195 no differences in selectivity were found, indicating that the expected binding will be the same for the three groups. This makes (R)-[11C]PK11195 still the tracer of choice for in vivo assessment of activated microglia.
9.5.4 Imaging Astrocytes in Alzheimer’s Disease
In addition to microglial activation, astrocytes may play an important role when neuroinflammation comes into play. The enzyme monoamine oxidase B (MAO-B) occurs predominantly in astrocytes. The PET tracer [11C]deuterium-L-deprenyl (DED) has high affinity and specificity for MAO-B (Fowler et al. 1987). An interesting study that performed dual [11C]PIB and [11C]DED PET scans showed that astrocytosis was more common in MCI patients with amyloid plaques deposition than in MCI patients without amyloid pathology (Carter et al. 2012). Given the high conversion rate of [11C]PIB-positive MCI patients, this finding suggests that activated or reactive astroglial cells are an early phenomenon in AD development.
9.5.5 Imaging Neurofibrillary Tangles in Alzheimer’s Disease
[18F]FDDNP is another type of radiotracer that has been developed for in vivo imaging of the neuropathology underlying AD. [18F]FDDNP showed in vitro binding not only to amyloid plaques but to neurofibrillary tangles as well (Agdeppa et al. 2001). Despite its low binding potential, [18F]FDDNP discriminates AD from controls and MCI patients (Small et al. 2006; Tolboom et al. 2009a, b). In addition, [18F]FDDNP binding was highest in the medial temporal lobe and correlated strongly with tau in CSF (Tolboom et al. 2009), suggesting that [18F]FDDNP does bind to tau in the living human brain. This is important as tangle load, rather than amyloid burden, is associated with cognitive performance and disease progression. It was therefore hypothesized that [18F]FDDNP would be an eligible tracer for monitoring the time course of AD. A longitudinal study in controls, MCI, and AD patients, however, showed no changes in [18F]FDDNP binding over a 2.5 year follow-up period in any of the groups (Ossenkoppele et al. 2012b). Moreover, [18F]FDDNP binding was not associated with disease progression. As such, there is no suitable tau PET tracer available to date.
Related posts:
 Impact of the IWG/Dubois Criteria for Alzheimer’s Disease in Imaging Studies
 PET and SPECT Studies of Ageing and Cardiovascular Risk Factors for Alzheimer’s Disease
 Gliomas
 PET Reveals Pathophysiology in Ischemic Stroke
 Linking Molecular Neurobiology to Therapeutic Approaches for Alzheimer’s Disease with PET
 Radionuclide Imaging Studies in Pediatric Neurology
Stay updated, free articles. Join our Telegram channel

Full access? Get Clinical Tree


