WHO grade
Mean age
Typical survival time
Main histological types
Surgical therapy
Medical therapy
1
Children
Cure possible
Pilocytic astrocytoma
Total resection
Not required (if resected)
2
35
10–16 years
Oligodendroglioma
Gross total resection (when possible)
Individual decision
35
6–8 years
Astrocytoma
3
50
3 years
Anaplastic astrocytoma or oligodendroglioma
Radiotherapy and chemotherapy
4
>60
3–24 months
Glioblastoma
PET and SPECT in imaging techniques in brain tumours have been reviewed recently (Herholz et al. 2012). Therefore, this chapter will concentrate on the potential and perspectives of these methods to address frequent clinical questions in the diagnosis and treatment of gliomas.
41.2 Glioma Grading
Grading of gliomas (WHO grades 2–4) remains a difficult task. Even though the WHO provides detailed guidelines for grading primarily based on histopathologic tissue features (Kleihues et al. 1993), there is considerable interrater variability among pathologists with respect to grading and subtyping of gliomas. This is compounded further by tumour heterogeneity; different parts of gliomas frequently exhibit different degrees of malignancy, and for correct grading of the tumour, the most malignant part is relevant. However, if only parts of the tumour were accessible to surgical intervention or only few small tumour samples have been taken, as in stereotactic biopsies, the most malignant part may not even be available for histological examination.
As shown in Table 41.1, prognosis and therapeutic management depends critically on grading, and thus, the uncertainty resulting from the practical limitations of histopathologic grading may create therapeutic dilemmas. This is a frequent problem in grade 2 gliomas where aggressive therapy may do more harm than good (Douw et al. 2009), while a “wait-and-see” strategy may allow progression and malignant degeneration of the tumour that could possibly be prevented by earlier intervention. Also, recurrent tumours may present with a more malignant grade than seen in the original histopathologic sample, and it is often not practical to get another sample due to the risk associated with surgical intervention. Therefore, imaging techniques are often required for grading of gliomas.
Malignant degeneration of gliomas is associated with many changes that are accessible to imaging (Table 41.2). This provides many diagnostic possibilities but is also a source of considerable uncertainty about their relative merits because only few of these imaging techniques have been directly compared with each other in large and representative samples. Most likely malignant degeneration is the consequence of cumulative genetic and biochemical changes that facilitate each other but do not necessarily occur in a regular order (Masui et al. 2012).
Table 41.2
Aspects of malignant degeneration and associated imaging techniques in brain tumours
Vascular changes |
Increase of blood volume and blood flow |
Dynamic CT, perfusion-/diffusion-weighted MR |
Perfusion PET and SPECT (15O-water, 99mTc-HMPAO, 99mTc-ECD) |
Endothelial activation and proliferation |
Amino acid PET/SPECT (11C-methionine, 18F-FET, 18F-FDOPA) |
PET of endothelial markers (e.g. 18F-Galacto-RGD: αVβ3-integrin) |
BBB breakdown |
MRI/CT contrast enhancement |
PET and SPECT (201Tl, 82Rb, 68Ga-EDTA, 18F-FLT) |
Cellular changes |
Increase of glycolysis |
FDG PET |
MRS (lactate) |
Increase of proliferation |
18F-FLT (also requiring BBB breakdown) |
Markers of protein synthesis |
Changes of lipid metabolism |
11C-choline (possibly also 18F-fluorocholine) |
MRS (choline, phospholipids) |
41.2.1 Vascular Changes
Vascular changes associated with malignant degeneration include an increase in blood volume and blood flow. Cerebral blood flow has been studied mostly by SPECT and PET, but impact has been limited by variability of results and poor relation to tumour grade (Langen et al. 1988). The advent of functional MRI techniques to measure blood volume and perfusion (Waldman et al. 2009) has renewed the interest in this topic. Apparently, blood volume is subject to less physiological variability than blood flow and may thus provide a more reliable diagnostic marker. Several studies now indicate that blood volume is an indicator of glioma grade that is related to expression of endothelial growth factor (Maia et al. 2005; Ludemann et al. 2006; Kapoor et al. 2009).
Amino Acid Tracers
An essential function of the endothelial cells in the cerebral vasculature is the active transport of amino acids from blood to tissue, and endothelial proliferation is associated with an increase of transporter expression and activity (Verrey et al. 2004). Several amino acids are being used as PET tracers, and increased uptake in gliomas has been demonstrated clinically (see review by (Herholz et al. 2012)) and in experimental studies (Miyagawa et al. 1998; Viel et al. 2012).
For many years, 11C-methionine (11C-MET) has been the most widely used amino acid tracer. Compared to normal brain, the uptake is increased in most gliomas, including the majority of low-grade gliomas with intact blood-brain barrier (BBB) (Herholz et al. 1998). On average, uptake is higher in high-grade than in low-grade gliomas, but the difference is quantitatively much less pronounced than with tracers and contrast agents that depend on BBB breakdown, which is present in the majority of high-grade but absent in the majority of low-grade gliomas. In cross-sectional studies, there is no consensus about the utility of 11C-MET for glioma grading (Moulin-Romsee et al. 2007). This may partially be due to the quantitatively small mean difference between grades and is potentially confounded by the fact that oligodendrogliomas have significantly higher uptake than astrocytomas of the same WHO grade (Derlon et al. 1997; Herholz et al. 1998; Ribom and Smits 2005; Shinozaki et al. 2011), even though they tend to have longer survival times. Nevertheless, longitudinal studies demonstrate that malignant progression of gliomas is associated with a significant increase of 11C-MET uptake that is absent in non-progressing tumours (Ullrich et al. 2009).
The very short physical half-life of carbon-11 (20 min) restricts the application of 11C-MET to PET research centres with own cyclotron and thus prevents wider clinical use. Therefore, fluorine-18-labelled amino acid tracers, which have the potential for routine clinical application, have found broad interest. Amongst them, 18F-fluoroethyltyrosine (18F-FET) has been used by several clinical research groups. Similar to 11C-MET, it is also substrate for the large neutral amino acid transporters (Langen and Broer 2004), while, in contrast to 11C-MET, it is not incorporated into proteins. Interestingly, studies comparing the clinical properties of these two tracers directly (Weber et al. 2000) found similar tumour to background ratios (while overall tissue uptake of 18F-FET is somewhat lower than 11C-MET), suggesting that the activated transport is the biologically dominant process rather than further metabolism. Correspondingly, it was also found that the magnitude of 18F-FET uptake is not a particularly strong indicator of tumour grade. This limitation could possibly be overcome by dynamic scans, because the early phase of tracer uptake, which is dependent on blood flow and volume provides a better differentiation between high- and low-grade gliomas than late uptake (Popperl et al. 2007; Jansen et al. 2012). However, it remains to be determined by direct comparison of dynamic 18F-FET studies with measurements of CBV by dynamic contrast-enhanced MR, whether amino acid tracers will ultimately prove to provide additional information for gliomas grading.
As an alternative to 18F-FET, 18F-FDOPA has also been used for imaging of gliomas (Heiss et al. 1996; Ledezma et al. 2009; Tripathi et al. 2009; Walter et al. 2012) with encouraging results. Obviously, there is more variable background than with 18F-FET because of the high physiological accumulation of FDOPA in the basal ganglia. Apparently, involvement of the basal ganglia by gliomas is not that frequent, especially at the time of initial diagnosis, and therefore allows a clear distinction between normal and pathological uptake areas in most patients.
Tracers binding to integrin show promise as more specific markers for endothelial activation and proliferation than amino acids. In a pilot study, uptake of 18F-Galacto-RGD images correlated with immunohistochemical alpha(v)beta(3) integrin expression of corresponding tumour samples in glioblastoma (Schnell et al. 2009).
Blood-Brain Barrier Breakdown
The standard techniques for imaging of BBB barrier breakdown in malignant gliomas and most other brain tumours are contrast-enhanced CT and MR which, by use of dynamic scanning, also allow quantitation of BBB permeability (Haroon et al. 2004; Herholz et al. 2007). Corresponding nuclear medicine techniques, such as 201Tl SPECT (Dierckx et al. 1994), have attracted only limited interest probably because of their relatively low resolution, even though the sensitivity of the potassium analogue 201Tl for BBB changes may be higher than the large inert molecules used as contrast agents with CT and MR (Gomez-Rio et al. 2008).
It is likely that BBB breakdown also increases amino acid uptake (Roelcke et al. 1996). However, the effect is relatively small as demonstrated by comparable uptake in high-grade gliomas with and without contrast enhancement (Herholz et al. 1998). BBB breakdown does, however, massively increase uptake of labelled nucleic acids and their analogues, such as FLT, because the capacity of their transporters at the BBB is very limited and tumours without BBB damage are negative on a FLT scan (Tripathi et al. 2009).
41.2.2 Metabolic Changes
Malignant degeneration of gliomas is associated with many changes in their metabolism. Imaging these changes is particularly attractive if it can be done without interference by BBB damage. The situation in that respect is best for FDG, because of the relatively rapid kinetics and large capacity of the glucose transporter.
FDG
Several studies demonstrated that FDG uptake in gliomas is related to prognosis (Patronas et al. 1985; Holzer et al. 1993; Kaschten et al. 1998; De Witte et al. 2001; Padma et al. 2003; Pardo et al. 2004; Van Laere et al. 2005; Pauleit et al. 2009). The main limitation for putting that into broader clinical use has probably been the difficulty to identify gliomas on FDG PET scans. FDG uptake in normal grey matter is very high similar to that of malignant gliomas, resulting in poor contrast. White matter FDG uptake is lower (typically about 40–50 % of the grey matter on a FDG PET scan), and FDG uptake of low-grade gliomas is usually to white matter uptake. Thus, the regional heterogeneity of normal brain metabolism is in the same range as the difference between low- and high-grade gliomas. Correspondingly, in most studies comparing FDG with amino acid tracers (Fig. 41.1), the latter appear to provide the more sensitive and distinct signal (Derlon et al. 2000; Kim et al. 2005; Van Laere et al. 2005; Potzi et al. 2007; Pauleit et al. 2009; Li et al. 2012).
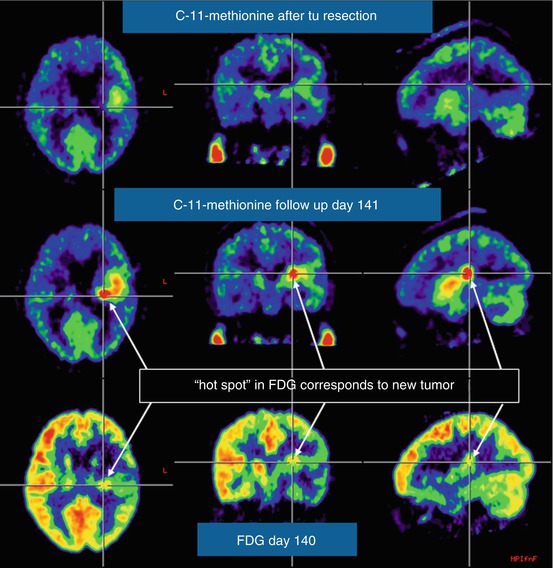
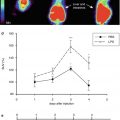
Fig. 41.1
Comparison of MET PET and FDG in recurrent glioblastoma. Within a few weeks after macroscopically complete tumour resection, MET PET is already showing increased uptake in the resection area (top row), which increases in intensity during the next 3 months (middle row), when the recurrence is also identified with less signal intensity on FDG PET (bottom row)
The limitations caused by poor image contrast can be overcome by PET-MR coregistration (Padma et al. 2003). While this approach has been limited to research laboratories in the past, there is now standard software provided by the major scanner vendors for PET-MR coregistration based on optimising a measure of mutual information in the two scan modalities, which achieves an accuracy of 1–2 mm and thus considerably better than actual PET scan spatial resolution (Cizek et al. 2004). Reliable classification of FDG uptake in tumour, as localised on the coregistered MR, can be achieved by a grading scale in relation to normal brain tissue, e.g. 0 = no uptake; 1 = uptake less or equal to contralateral white matter; 2 = uptake greater than the contralateral white matter and less than the grey matter; and 3 = equal to or greater than the contralateral grey matter (Padma et al. 2003). Rather than relying on a plain SUV value only, semiquantitative assessment of lesion uptake should be done in the tissue volume that is suspected of tumour on the MR scan and divided by the uptake in a contralateral mirror region, providing a SUV ratio (SUVR) which is equivalent to a simple activity ratio. Normal brain glucose metabolism is reduced in patients with aggressive tumours (DeLaPaz et al. 1983; Holzer et al. 1993), thus enhancing the contrast between malignant gliomas with high FDG uptake and normal brain background. An improvement of the contrast can also be achieved by delayed scanning, which may demonstrate late accumulation of FDG in the tumour (Spence et al. 2004; Prieto et al. 2011).
FLT
The most important factors being considered in histological grading of gliomas are the degree of cellular anaplasia and indicators of cellular proliferation. Initial work with 11C-thymidine demonstrated in vitro and in vivo that the activity of thymidine kinase 1 (TK-1) is associated with cellular accumulation of the tracer and tumour proliferation (Eary et al. 1999). In order to facilitate more widespread applicability, the fluorine-18-labelled thymidine analogue FLT has been developed for imaging of tumour proliferation (Shields et al. 1998). Although its affinity to cellular nucleoside transporters and TK-1 is less than that of thymidine (Krohn et al. 2005), a correlation between tracer uptake kinetics and proliferation markers has been demonstrated in malignant glioma (Ullrich et al. 2008; Price et al. 2009). FLT does not cross the intact BBB (at least not at an amount that would allow clinical PET imaging), thus it provides a negative finding in most low-grade gliomas (Chen et al. 2005) and is not suitable for measuring proliferation rates in this tumour group (Tripathi et al. 2009).
Choline
Magnetic resonance spectroscopy has demonstrated significant differences with respect to the phospholipid and choline signal between low- and high-grade gliomas (Tedeschi et al. 1997). Correspondingly, there is also interest whether this could also be achieved by 11C-choline (Shinoura et al. 1997). Ohtani et al. (2001) demonstrated increased uptake in high-grade gliomas and extra-axial tumours lacking the BBB, while uptake in most low-grade gliomas was comparable to background. Initial experience with 18F-fluorocholine is very limited (Lam et al. 2011), and interference of the BBB with tracer uptake is likely.
41.2.3 Biopsy Targeting
Unfortunately, none of the currently available PET tracers are absolutely specific for tumours. For instance, FDG uptake is also increased in inflammation, and increased amino acid uptake has been observed in various acute brain lesions (Floeth et al. 2006). Thus histological tissue examination remains the ultimate tool for accurate diagnosis, and PET can contribute to accurate diagnosis by guiding neurosurgeons towards the most active glioma parts (Pirotte et al. 2004a, b; Kunz et al. 2011). Areas of increased FDG and methionine uptake tend to correspond with each other (Pirotte et al. 2004a, b), and there may also be correspondence with areas of increased CBV (Fig. 41.2). Currently, the question of what is the best and most practical imaging method for grading and biopsy guiding is an unresolved issue, and further prospective clinical studies with direct comparison of the various tracers and dynamic MR should be conducted (Maia et al. 2004).
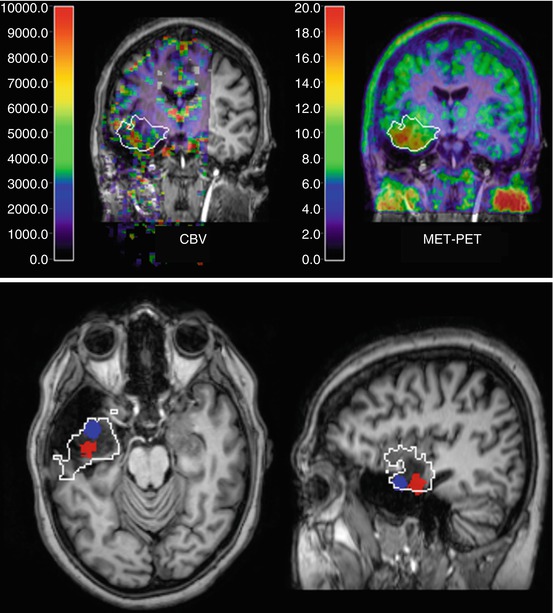
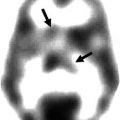
Fig. 41.2
Low-grade glioma with focal increases of CBV (DSCE MR) and amino acid uptake (MET PET) indicating beginning focal dedifferentiation. Images are shown in coregistration and fusion with T1-weighted contrast-enhanced MR; the white outline indicates the extent of the lesion on FLAIR MR. On the coronal cuts (top row), there is some correspondence between CBV and MET PET within the tumour, while the transaxial and sagittal slices (bottom row) demonstrate that peaks are actually not in the same position (peak MET uptake marked blue, peak CBV red)
41.3 Diagnosing Recurrent Glioma
Recurrent glioma poses specific diagnostic problems because treatment, especially surgery and radiotherapy, can induce alterations in non-tumour tissue that can be indistinguishable from recurrent tumour using standard contrast-enhanced CT and MR (Rachinger et al. 2005). In particular, radiation-induced necrosis needs to be distinguished from recurrent tumour, while both lesions may show contrast enhancement.
Studies demonstrate that FDG, FLT and amino acid tracers have the potential to provide that differentiation (Table 41.3), and there are also reports that assessments of CBV by dynamic MR (Kim et al. 2010) or measures derived from MRS (Smith et al. 2009) may provide similar information. However, the number of subjects studied in most of the published studies is rather small, and there has not always been histopathologic confirmation. Also, the clinical question of necrosis versus tumour is very complex because in many instances both features will be present on detailed microscopic examination. Furthermore, high-grade gliomas may contain parts with a lower degree of cellular anaplasia and absent BBB damage, similar to low-grade gliomas, which are not likely to cause clinical deterioration in the short term but nevertheless constitute residual or recurrent tumour. Thus, one should aim for characterising the various heterogeneous components of recurring gliomas as accurately as possible (Thiel et al. 2000). More pragmatically, the clinical issue usually is whether the activity and volume of malignant recurrent tumour identified on the scans is large enough to warrant re-initiation or escalation of therapy. These decisions also need to consider the individual patient’s age and clinical condition and are therefore typically very individual decisions, as yet defying systematic analysis by controlled prospective studies (Table 41.4).
Table 41.3
Discrimination between recurrent glioma and necrosis
Tracer | n | Sensitivity | Specificity | Lesion type | Reference |
|---|---|---|---|---|---|
FDG | 47 | 75 % (21/28) | 81 % (13/16) | Malignant tumour | Chao et al. (2001) |
FDG | 15 | 43 % (6/14) | 100 % (1/1) | Glioma | Thompson et al. (1999) |
FDG | 84 | 73 % | 56 % | Malignant tumour | Ricci et al. (1998) |
FDG | 38 | 88 % (15/17) | 81 % (17/21) | Glioma | Valk et al. (1988) |
FDG | 21 | 81 % (13/16) | 40 % (2/5) | Tumour | Kahn et al. (1994) |
FDG | 9 | 80 % (4/5) | 100 % (4/4) | Tumoura | Ogawa et al. (1991) |
FDG | 30 | 95 % | 50 % | Glioma | Van Laere et al. (2005) |
MET | 30 | 75 % | 70 % | Glioma | Van Laere et al. (2005) |
MET | 12 | 100 % (5/5) | 86 % (6/7) | Gliomaa | Sonoda et al. (1998) |
MET | 32 | 75 % | 75 % | Gliomaa | Terakawa et al. (2008) |
MET | 11 | 100 % (6/6) | 60 % (3/5) | Gliomaa
Related posts: Impact of the IWG/Dubois Criteria for Alzheimer’s Disease in Imaging Studies Impact of the IWG/Dubois Criteria for Alzheimer’s Disease in Imaging Studies
 PET and SPECT Studies of Ageing and Cardiovascular Risk Factors for Alzheimer’s Disease PET and SPECT Studies of Ageing and Cardiovascular Risk Factors for Alzheimer’s Disease
 Single-Photon Emission Computed Tomography [Neuro-SPECT] Imaging of Brain Tumors Single-Photon Emission Computed Tomography [Neuro-SPECT] Imaging of Brain Tumors
 PET Reveals Pathophysiology in Ischemic Stroke PET Reveals Pathophysiology in Ischemic Stroke
 Linking Molecular Neurobiology to Therapeutic Approaches for Alzheimer’s Disease with PET Linking Molecular Neurobiology to Therapeutic Approaches for Alzheimer’s Disease with PET
 Radionuclide Imaging Studies in Pediatric Neurology Radionuclide Imaging Studies in Pediatric Neurology
Stay updated, free articles. Join our Telegram channel
Full access? Get Clinical Tree
 Get Clinical Tree app for offline access

|