2 This chapter exposes the reader to several basic ideas used in summarizing quantitative data. They can broadly be categorized numerically and graphically. • Graphical summaries • Bar graphs • Histograms • Boxplots • Scatterplots • Numerical summaries • Single points • Mean • Median • Quantiles • Measures of spread • Mean absolute deviance • Variance • Standard deviation • Interquartile range This chapter refers to basic descriptive statistics. Although these are considered introductory level topics, they are very important for two reasons. First, they form the building blocks for more advanced methods. Second, they suggest which more advanced methods are (or are not) suitable, as more advanced methods are less applicable to a variety of problems than simpler methods, which provide cursory insight on almost any type of data. This chapter forgoes the rigorous statistical definitions behind most descriptive statistics, and instead focuses on why the concepts are important, and how to calculate, understand, and apply them. To this end, this chapter shows several examples and, where appropriate, throughout the concepts section, provide the accompanying R code.1 This chapter weaves visual and quantitative methods for describing data. The choice between using each is often simple: for accuracy, quantitative methods of summarizing data are preferred, but to simply convey relationships, graphical approaches are typically more useful. Importantly, the goal of a graphical method is not to convey the exact numerical information, though they may be inferred; their purpose is to show relationships.2 Before beginning with statistics, it is important for the reader to grasp some knowledge on different types of data. The reader should refer to the chapter on measurements (Chapter 4) concerning distinctions between discrete and continuous data, as well as the properties of interval ordinal and nominal data. The bar graph (also called a bar plot) is a staple of presenting discrete information and is the foundation for the histogram, discussed later in this section. It provides relative information identical to what is conveyed in a two-column table. Consider the number of examinations conducted by type of imaging modality in a hospital as shown in Table 2.1. Information is read in the table or viewed with the bar graph produced with the R code above. The resulting histogram is shown in Fig. 2.1. Both the table and the bar graph convey the same information. When there are many categories, it is easier to see which bars are very high, very low, or near a particular value than it is to scan through a table and obtain that information. Bar graphs are suitable for any data that are discrete—limited only by the convenience of plotting a certain number of categories. A bar graph with a million distinct categories provides the same information as a million-rowed table, but neither would be particularly illuminating. Table 2.1 Frequencies of examinations using different types of imaging modalities
Descriptive Statistics
 Learning Objectives
 Introduction
 Bar Graphs and Histograms
Type of imaging modality | Number of examinations |
CT | 7 |
MRI | 4 |
Nuclear | 2 |
Ultrasound | 11 |
X-ray | 9 |
In a bar graph, the order of the bars is essentially irrelevant since bar graphs are useful for nominal data. When the data are ordinal, however, a natural ordering of the bars becomes useful. For instance, consider the number of MRIs on the days of a particular week as shown in Fig. 2.2.
The bars can be rearranged in any order, as long as bars are labeled the same. The same information is displayed but this would clearly impede communication by being unintuitive. Therefore, the ordering of bars improves communication. A similar type of graph to the bar graph, which exclusively uses ordered data by agglomerating discrete ordinal data or discretizing continuous data, is the histogram.
Consider the following set of body temperatures:
38.8, 36.9, 36.5, 39.2, 38.6, 38.6,

38.8, 39.5, 40, 38.6, 38.4, 39,

36.6, 35.9, 39.5, 38.8, 37, 38.7,

38.8, 38.8, 38.1, 39.1, 37.2, 37,

39.3, 37.1, 38.7, 39.1, 37.4, 38.4,

36.7, 38.3, 39.1, 39.1, 38.5, 39,

36.9, 38.1, 38.7, 38.7, 36.8, 39.4,

38.7, 38.8, 39.2, 37.2, 39, 38.5,

38.6, 38.2, 39, 39, 37, 37, 39.1,

39.8, 37.1, 36.5, 39.2, 37.4, 37.8,

36.8, 36.5, 38.7, 39.2.
It is difficult to get a sense of the data when simply listed this way, but the data can be discretized into categories. Listing the frequency of observations falling in each category gives a better impression of data, as shown in Table 2.2.

> imaging <- c(CT=7,MRI=4,Ultrasound=11,Nuclear=2,Xray=9)

> barplot(imaging)

> mri = c(Monday=14,Tuesday=8,Wednesday=10,Thursday=7,Friday=9)

> barplot(mri)
Although a table of the values is much easier to read, it is visually illustrated in the same way a bar graph is, with the corresponding histogram in Fig. 2.3. The histogram implicitly makes data discrete for the purpose of displaying information. How it makes data discrete is a choice. The most common convention to discretize data is to make the bar widths, called bins, equal. The number of bins is a choice, though in R (which refers to bins as breaks), there is a default heuristic used, but another choice can also be selected. Details of the other choices are described in the help file for the hist command: ?hist. The width of each bin can be specified in R using the breaks= parameter. The argument may be the endpoints of bins, or the approximate number of bins desired. Usually, R‘s default choice is sufficient but it can be specified. For instance, consider the code that produces the histograms in Fig. 2.4.
Table 2.2 Discretized body temperature values
Range | Frequency |
35.5–35.9 | 1 |
36.0–36.4 | 9 |
37.0–38.4 | 10 |
37.0–37.4 | 1 |
38.0–38.4 | 6 |
38.5–38.9 | 18 |
39.0–39.4 | 16 |
39.5–39.9 | 3 |
40.0–44.4 | 3 |
Histograms provide a good approximation to how data spread or congregate within a data set. In this example, there are many cases where temperature is close to 39 degrees. This impression is easily obtained using the histogram but much more difficult to glean looking at the raw numbers. In addition, the range of data is easily seen but this is more difficult to obtain from looking at the raw data.
Referring back to Fig. 2.3, the data have two “bumps” in the histogram called modes. This makes the histogram bimodal, sometimes an indication of subpopulations. In this case, there is a group of people with higher body temperatures around 39 degrees and another group with lower temperatures, closer to 37 degrees. This may seem like a simple remark but it is a very important one: much of the statistics that follow in this book assume the data are or require that the data to be unimodal. In an example of unimodal data, consider the histogram of average diameter of breast tumors3 in Fig. 2.5.

> temperatures=c(38.8, 36.9, 36.5, 39.2, 38.6, 38.6, 38.8,

    39.5, 40, 38.6, 38.4, 39, 36.6, 35.9, 39.5, 38.8,

    37, 38.7, 38.8, 38.8, 38.1, 39.1, 37.2, 37, 39.3,

    37.1, 38.7, 39.1, 37.4, 38.4, 36.7, 38.3, 39.1,

    39.1, 38.5, 39, 36.9, 38.1, 38.7, 38.7, 36.8, 39.4,

    38.7, 38.8, 39.2, 37.2, 39, 38.5, 38.6, 38.2, 39,

    39, 37, 37, 39.1, 39.8, 37.1, 36.5, 39.2, 37.4,

    37.8, 36.8, 36.5, 38.7, 39.2)

> hist(temperatures,main=“”, xlab=“Body temperatures in degrees Celsius”)
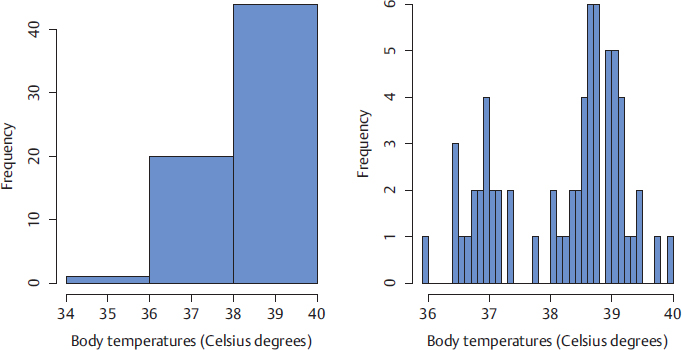
> hist(temperatures,breaks=2,xlab=“Body temperatures in degrees Celsius”)

> hist(temperatures,breaks=50,xlab=“Body temperatures in degrees Celsius”)

This histogram is unimodal but has a very distinct shape. One side extends farther from the peak than the other. This indicates that although most tumors measure between 10 and 20 units, tumors can be rather large, up to 30 units, but most lie in the range of approximately 10 to 20 units. This is an example of another trait of histograms, called skewness. If unimodal data are symmetric, both the left and right ends of the histogram, called the tails, look approximately like mirror images of each other. If one tail extends farther, the histogram is said to be skewed in that direction. It is right-skewed (positively skewed) if the right (more positive) tail extends farther from the middle than the left tail. Conversely, the histogram is left-skewed (negatively skewed) if the left (more negative) tail seems to extend farther away from the middle than the right tail. As a final note, rigorous mathematical definitions exist for skewness,4 and it does indeed quantify this concept. For our purposes, however, it will be sufficient to be less detailed since most applications of skewness need only be as detailed as visually inspecting a graph.
 Measures of Centrality
When presented with data, it is convenient to try to reduce them to the equivalent of a single number since a single number is easily understood. Further, when there are different collections of data, reducing each collection to a single number is useful for comparison purposes. For example, if the femur length in adults is generally larger than the femur length in young children, it is convenient to see this as a comparison of two numbers. There are several ways to represent a data set with a single number, and the most common are considered in this chapter.
Mean
The mean is undoubtedly the most common method of representing an entire data set by one number. It is also called the arithmetic mean, or average, and is given by

Its interpretation is also very simple. If every observation contributed equally to the data, what would the value of each observation be so that we obtained the same sum? Consider the number of imaging examinations produced by the radiology departments of three different hospitals in the same city on a given week: 110, 150, 250. The average number of imaging examinations in the city was 170. That is, if each department produced exactly 170 imaging examinations, the city would have still produced the same number of examinations. This was calculated as follows:

In R, the following command finds the mean.
> images <- c(110,150,250)
> mean(images)
## [1] 170
or written in one line
> mean(c(110,150,250))
## [1] 170
One interesting note about the mean is that it will always lie in the range of the data: it will never be smaller than the smallest value or larger than the largest value—it must be somewhere in the middle, which fits with the notion of being a measure of centrality, or the center of the data.
Consider the number of imaging examinations by hospital again, but, instead, one hospital produces many more images—namely, the hospital that previously produced 250 images now produces 2,500 imaging examinations.


