4 • To explain the importance of measurement properties to health outcomes research. • To explain types of variables and scaling. • To explain the terms validity, reliability, and responsiveness and to be able to describe these properties for a given measure. • To explain the different components of validity (face, content, construct, and criterion validity) in the context of measurements. • To describe sources of variation in measurements. • To differentiate between different types of measurements and to create the appropriate research designs using these concepts. Measurement is the process of systematically assigning numbers or words to physical and behavioral characteristics so that they can be defined, quantified, and differentiated. This approach is simple for objective measures such as height and age but becomes much more complex when we try to measure health-related clinical outcomes that impact patients. Most of these outcomes are actually very complex constructs, made up of many different components. If we consider an outcome as simple as the measurement of the symptom of pain, for example, we soon realize that it is difficult to describe “pain” using the categories or numbers that are essential for statistical analysis required in research. If investigators are interested in developing a research design for an intervention that modified pain, for example, they need an a priori definition of pain. In the context of a research protocol, this is done by assigning values to objects. A classic example of this process is how Wilson and Cleary first defined the concept of health-related quality of life (HRQoL) in 1995 by developing a classification scheme for different measures of health outcomes.1,2 They defined five aspects of health outcomes: biological and physiological factors, symptoms, functioning, general health perceptions, and overall quality of life. They also proposed causal relationships between them. Through this classification scheme researchers could include all these factors when measuring HRQoL and could focus on the aspects of HRQoL that were most relevant to their work. The result of this process has been the development of HRQoL questionnaires made up of a series of questions that include the five aspects of the construct being measured, resulting in summary scores that can be used for analysis. The actual development of these specific measurement tools is very laborious and requires years of selecting and testing the items that should and should not be included in a scale that will measure as closely as possible the concept being measured. Before a measurement tool can be considered usable as a research outcome in future research, it must have been demonstrated to be reliable, valid (Fig. 4.1), and responsive. The development of a magnetic resonance imaging (MRI) scoring system for evaluation of knees and ankles of hemophilic children is one example of this process from the radiology literature.3 Once a given tool or scale or scoring system has been developed, it is specific only for the target population being tested. If one intends to use the same MRI scoring system for healthy adults, for example, he/she should first demonstrate that the measurement tool is reliable, valid, and responsive for assessment of healthy adults. In the HRQoL example, the Short Form (SF)-36 is an example of a questionnaire that assesses quality of life in the general population,4 while the European Organization for Research and Treatment of Cancer Quality of Life (EORTC-QoL) measure is one that is specifically designed for cancer patients.5 Whereas one assumes that the same five components of the construct of HRQoL (biological and physiological factors, symptoms, functioning, general health perceptions, and overall quality of life) will make up the two questionnaires, SF-36 and EORTC-QoL, the actual items of each questionnaire would need to be different in the two populations of interest. The prevalence of symptoms of nausea and vomiting, for example, would be much more relevant for cancer patients as compared to the average population. In addition to the actual questions, the scale of the items of each questionnaire may need to change. Most healthy people, for example, would score around the same for pain (assuming not much pain in daily life), whereas for cancer patients the range of pain scores would be expected to be much greater. Similarly, in the example of an MRI scoring system for assessment of hemophilic arthropathy, the range of soft tissue and osteochondral tissue scores would be expected to be shifted toward more severe stages in places where prophylaxis to joint bleeding is not available to the population and toward less severe stages in places where prophylaxis is offered to the population. It is important that investigators consider the widest possible range of values for individual items of a scale or questionnaire to enable its application in different research settings, conditions, and health care systems. When an investigator is designing his/her own research question, it is important to review the literature as to whether the outcome of interest has been previously measured with a validated measurement tool. Hopefully there will be a tool that approximates what the investigators intend to measure, and if luck is on the investigator’s side, there may be several, and this will allow him/her to choose the tool that most closely matches the target population and the research question. When we state that a measurement tool is reliable, valid, and responsive, what we are really asking is, “How close is the measure from the truth?” The measurement properties of reliability (reproducibility of the measure when repeated multiple times), validity (the degree that the tool measures what it was supposed to measure), and responsiveness (the extent to which an instrument can measure change when change has occurred) are all different aspects trying to quantify and describe how a given measurement tool performs in relation to the truth. Fig. 4.1 illustrates the concepts of reliability and validity in relation to the truth. Measurements of clinical phenomena yield four main types of data: nominal, ordinal, interval, and continuous.6 Nominal data does not have meaning beyond representing unordered categories despite numbers often being used to represent the categories, such as, languages (German, French, English, Spanish), blood types (A, B, O, AB), sex (female, male), or identifiers of patients in a study. The categories are mutually exclusive and every subject fits into a category. When the order among the categories is reflective of more or less of a phenomenon, the data are ordinal. Some examples include a pain scale ranging from 0 to 10 where 0 represents no pain and 10, writhing agony; the Arnold-Hilgartner radiographic scale for assessment of severity of hemophilic arthropathy7 where grade 1 represents mild changes and grade 5, late changes (Fig. 4.2); and synovitis domain of the Outcome Measures of Rheumatoid Arthritis Clinical Trials (OMERACT) ranging from 0 to 3 representing none, mild, moderate, and severe changes, respectively.8 Ordinal scales record information about the rank order of levels or scores. The distance between these levels is not necessarily equivalent even though the levels are one unit apart. Consequently, arithmetic operations do not make sense for these data, and absolute values have little meaning. Despite this, many patient-based questionnaires sum up the responses of these ordinal data to create a summary score that is then considered to be interval level data that can be averaged, added, or subtracted to measure change. Fig. 4.2 Examples of ordinal data whereby data is rank-ordered but the distance between each level is not fixed. (a) A commonly used Likert-type pain scale; (b) the Arnold-Hilgartner plain radiograph scale for assessment of severity of hemophilic arthropathy.7 Interval or discrete data are ordered and have magnitude that is meaningful, such as the number of motor vehicle accidents; height above the sea level; Fahrenheit and Celsius temperatures; dates of imaging examinations; posttest/pretest score differences in a course (educational research design); and radiographic scale for assessment of severity of hemophilic arthropathy based on counting the number of endorsed items (Fig. 4.3). There are equal distances between units or scores; therefore, addition and subtraction operations are acceptable with interval data. Scores are not related to a true zero, and can be negative. Zero simply represents an additional point of measurement. Ratio or continuous data has a true zero and has an unrestricted range in that any number of decimal points may be used depending on the error of measurement, such as, length; weight; quantitative diagnostic tests: signal uptake in time-intensity curves (dynamic contrast-enhanced MRI) (Fig. 4.4); clinical tests such as surrogate measures of exposure (e.g., a series of questions to determine pesticide exposures); and outcomes. Addition, subtraction, multiplication, and division can be applied to ratio data. Fig. 4.4 Continuous data where the levels are unrestricted and related to a true zero. There is no maximum limited allowed for measurement of foot width (a); the signal uptake in the arthritic knee of a rabbit injected with gadolinium contrast agent (b). In a research study with the following research question, “Can rectal physical examination accurately depict the upper (A), lower (B), right lateral (C), and left lateral (D) borders of a tumor in relation to the anal verge as compared with MRI (reference standard)?” (Fig. 4.5), investigators should always aim at picking the data variables highest in the hierarchy (continuous, interval, ordinal, nominal) which are most appropriate for the research question under consideration. Data can be transformed from a higher hierarchical level (continuous) to a lower level (binary), but with a loss of information. The reverse is not true. Irrespective of whether we are interpreting a diagnostic test or a clinical finding, determining eligibility for a study, defining and/or quantifying an intervention or an exposure, or quantifying an outcome, we are using a quantitative measurement system in some form to describe a behavior or characteristic. In each of these situations we must separate the truth versus the possible measurement error for these data. This is also referred to as signal and noise. The signal represents differences we are interested in detecting and noise is the error in the measurement over these differences. Measurement error is a threat to the validity of the data, that is, if the data is truly measuring/representing what it is purporting to measure. In terms of a signal, validity represents the ability to detect the right signal from the data. Measurement error can have many sources. Consider the situation in which the investigators want to evaluate the effectiveness of a new drug (intervention) in patients with osteoporosis. One eligibility criterion is that the subject has obtained baseline (prior to start of treatment) dual energy X-ray absorptiometry (DEXA) measurements. • What are the possible sources of measurement error in a DEXA scan? • What are the possible sources of error in the intervention? Fig. 4.5 Location of colorectal cancer from the anal verge. If the investigators choose to measure the tumoral margins (a–d) in cm, they will be using continuous data. If they measure the distance between one tumoral border and the diagonal opposite border in equal intervals (arbitrarily determined) they will be using interval data. If they grade the proximity of the highest (a) and lowest (b) borders, and lateral borders (c,d) in relation to the anal verge according to a priori established regions (first = 1, second = 2, third = 3, and fourth = 4 areas closest to the anal verge), they will be using ordinal data. If they name points A to D according to where these locations lie in relation to an existing near-far drawing of the rectal region, they will be using nominal data. Suppose that a secondary outcome in this study is a quality of life questionnaire. What are the possible sources of error of measurement for this outcome? Most measurements are subjected to three potential sources of error: those related to the subject (examinee), the examiner or observer, and the instrument (examination) (Fig. 4.6). Subject variability is the intrinsic biologic variability in the characteristic being measured, such as body weight, bone density, or mood. Observer variability is due to the observer, and can result from differences in years of clinical experience, skill in using an instrument, or selection of words in an interview. Instrument variability is the variability in the measurement due to changing environmental factors such as set up of the machine, temperature, or different re-agent lots. Some variability of measurements can be attributed to random error (affecting reliability), and some can be attributed to systematic errors such as bias or confounding variables (affecting validity) (Fig. 4.7). The amount of variability will be determined by how abstract the outcome measure is. Some measures, such as measurement of bone mineral density from DEXA, can be expected to have much less variability than a quality of life or symptom measurement when repeated. This is because in the first case once the DEXA scanner is calibrated (as part of a daily approach for quality control thus minimizing any systematic deviation) and the region-of-interest is determined, a machine provides measurements that should be consistent. Repeated measures in a quality of life or symptoms instrument are much more dependent on subjective variation. Nevertheless, DEXA measurements can also be subjected to random error from minor deviations in positioning of the patient despite strict protocols to minimize the resulting error. In terms of magnitude of the random error, however, a major source of error in the quality of life questionnaire is the context: whether the questionnaire is completed in the clinic or at home, or whether it is a mailed vs. interviewer-administered questionnaire. Some data suggest that higher levels of disability are reported in mailed questionnaires than when interviews are administered, even when the interviewer is impartial.9 Fig. 4.6 Framework for determining sources of measurement error. Strategies to reduce these sources of error are listed within each box. Systematic errors can occur for both single-and multi-source measurements. In the latter case, if measurements of either the test or reference standard or both are incorrect, the (incorrect) difference in measurements between the reference standard and the test will persist if repeated measurements are done, thus resulting in a measurement bias (Fig. 4.7). Different types of measurement bias are described below as related to subject, instrument, or observer. Subject bias is how the subject interprets the measurement based on his/her experiences; it may be conscious or unconscious. Example: Recall bias which is caused by differences in the accuracy or completeness of the recollections retrieved (“recalled”) by study participants regarding events or experiences from the past. Instrument bias is a fault in the instrument itself, in that it does not accurately capture the construct being studied. Example: An instrument needing recalibration and therefore providing wrong results in a systematic way. Observer bias is how the observer interprets the results of the instrument due to his/her own conscious or unconscious expectations. Example: If the observer knows the goals of the study or the hypotheses, he/she may allow this knowledge to influence their observations during the study. Strategies to reduce measurement bias include: 1. Standardize measurement methods: • Educate subjects to follow instructions before assessment (e.g., to drink the amount of oral contrast prescribed prior to a CT scan of the abdomen)—to minimize subject variability • Mandate technique (e.g., standardize imaging protocols in an operations’ manual)—to minimize observer and instrument variability • Calibrate the instrument if appropriate—to minimize instrument variability 2. Train operators (e.g., for ultrasound scanning) —to minimize observer variability 3. Introduce items to assess performance in the middle of the scale—to minimize observer variability 4. Automate outcome measurement (e.g., for data analysis of regions of interest of contrast-enhanced MRI, use a priori determined boxes that are copied and pasted in predefined regions of the images, if appropriate, in all examinations)—to minimize observer variability 5. Eliminate (and explain the cause of) outlier observers—to minimize observer variability 6. Blinding: Blinding is a highly effective strategy used in observational and experimental research to avoid investigators and participants in a trial changing their behavior or reporting of outcomes in a systematic way (i.e., be biased) if they are aware of which patients receive which treatment, procedure, or diagnostic test.10 Whenever possible, researchers should be unaware of the treatment, procedure, or diagnostic test groups to which patients have been selected to so that this knowledge cannot cause them to act differently, thus avoiding differential measurement bias. This bias may jeopardize the internal validity of the study by over- or underestimating causal effects. Blinding can take place in a clinical trial at four levels: (1) treatment/procedure allocation; (2) patients; (3) clinicians; and (4) measurement of outcomes.10 Although in observational radiology studies investigators typically are cautious about blinding of imaging operators (data acquisition phase) and readers (data interpretation phase), one should be aware of the need of blinding at prior stages of the research process. Example: In a cross-sectional study that compares ultrasound scans of hips with clinical suspicion of septic arthritis with those with suspicion of slipped capital femoral epiphysis (SCFE) using culture results from the joint aspirate as the outcome measure, sonographers should be blinded to the patients’ group allocation (septic arthritis vs. SCFE, level 1 of blinding), and pathologists should be blinded to the ultrasound results at the time of measurement of outcomes (level 4 of blinding). There are three main clinimetric properties of measurements: reliability, validity, and responsiveness. Reliability, or precision, is defined as the consistency or reproducibility of the measurement when measured multiple times. The reliability of a given instrument has a very important effect on the power of a study. The more reliable an instrument is, the smaller the sample size needed to estimate a mean with a specified precision or to detect a difference of a given size.11 The reliability of an instrument has been defined as: Therefore, the greater the error, the less reliable the instrument will be. By recognizing the three aforementioned sources of error (subject, observer, and instrument), there are a number of strategies that can be used to improve reliability, depending on the instrument (Fig. 4.6). There are several different ways that reliability of an instrument can be described and tested, by describing its internal and external reliability. Internal reliability, or consistency, evaluates the relationship of the test items in a multi-item scale to each other in order to ensure that all test items are measuring the same concept. Cronbach’s α (alpha) provides a measure of the internal consistency of a test or scale; it is expressed as a number between 0 and 1.12 If the items in a test are correlated between each other, the value of alpha is increased. However, a high coefficient alpha does not always mean a high degree of internal consistency. This is because alpha is also affected by the number of items in the test. If the test length is too short, the value of alpha is reduced. Thus, to increase alpha, more related items testing the same concept should be added to the test.12 A multi-item scale is generally considered internally reliable if a Cronbach’s α (alpha) coefficient is >0.70 for group comparisons.13,14 First used by Lee Cronbach in 1951 for psychology questionnaires, Cronbach’s alpha statistic is widely used in health science research, business, nursing, and other areas whenever the question is raised as to what extent a series of items measure the same thing. Interestingly, Cronbach called it the alpha coefficient because he intended to describe further coefficients.15 It is defined as: where X is the sum of K components (items, questions) such that External reliability is defined by how well the instrument is reproducible when repeated, either by the same observer (intra-rater reliability) or between observers (inter-rater reliability). Intra-rater reliability is generally tested by stability over time in a test–retest situation. For example, if one radiologist looks at the same set of mammograms on two occasions, how likely is that he/she will agree with himself/herself on his/her interpretation? Intra-rater reliability is demonstrated by the consistency of scores across different raters at a point in time. An example of this is when a number of radiologists were asked to interpret the same MRI scans in order develop an MRI scoring system.3 Assuming that the items in this study were continuous variables (e.g., the 10-point progressive and the 20-point additive MRI scoring systems), the intraclass correlation coefficient (ICC) was the estimate used to test the inter- and intra-rater reliability. This is a measure of reliability of two or more continuous measurements made on the same subjects.16 It is a generalized measure of concordance adjusted for chance agreement between sets of measurements that are structured as groups, rather than data structured as paired observations. Often regarded within the framework of a repeated measures analysis of variance (ANOVA) or linear mixed effect models, it takes into account the three sources of random variation: subject, observer, and error.17 We will illustrate the ideas behind reliability of continuous data by examining a case study involving measurement of the superior limb of the hippocampus on MRI (Figs. 4.8, 4.9, 4.10, 4.11, and 4.12).18 MR images of 50 patients were obtained. They were presented in random order to one radiologist and in a different random order to a second radiologist. Each radiologist used the same imaging system and computer monitor to measure the length of superior, lateral, and inferior arms of the hippocampus on each side. They recorded their measurements to the nearest 0.1 mm. Across the 50 subjects, the readings done by the two radiologists differed by at most 0.2 mm. We can gain an informal notion of how reliable the measurements from the two readers were by comparing this to the range of measurements. The range of measurements for one reader was 0.7 mm to 2.6 mm and the range of measurements for the other reader was 1.3 mm to 3.4 mm. There was at least one image where the difference between the two measurements of the same structure (1.9 mm) was essentially as large as the difference in size across 50 people (1.9 mm for reader 1 and 2.1 mm for reader 2). Nevertheless, the difference in measurements of the same hippocampus is measurement error, whereas there may be a real variation in the size of the hippocampus whenever measurements are obtained by different readers. How can we formalize this weighing up of measurement error to true variation? Fig. 4.9 Measurement error including between- and within-subject variability. This figure illustrates an intraclass correlation coefficient model of four readers considering that each reader assesses five subjects. To understand what it means, let’s examine the data that we collect when two readers each make a single measurement of the hippocampus on a series of MRIs, a study that will estimate inter-reader reliability. The observed measurement where
Measurements: Validity, Reliability, and Responsiveness
 Learning Objectives
 Concepts
Measurements
 Types of Data


Example of Types of Data
 Measurement Error and Bias


 How to Control for Measurement Errors?
 Clinimetric Properties of Measurements
Reliability

Internal Reliability

X = Y1 + Y2 + Y3 + Yk. Here,  is the variance of the observed total scores, and
  is the variance of the component i for the current sample. Cronbach’s alpha generally increases as the intercorrelations among test items also increase. Because intercorrelations among test items are highest when all items measure the same construct, Cronbach’s alpha is widely believed to indirectly indicate the degree to which a set of items measures a single construct.
External Reliability
Intraclass Correlation Coefficient

Case Study
Study Design
Results

Understanding Intraclass Correlation Coefficient
Xij (the size of the hippocampus) made by a particular reader (j) on a single subject (i) can be decomposed into three parts:
Xij = μ + Δi + εij
μ = true average value for all

subjects


Δi = true deviation of subject i
from the average μ
εij = measurement error on subject i
read by reader j

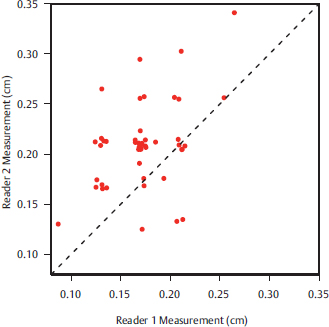
Fig. 4.12 Comparison between (a) scatterplot and (b) and Bland-Altman plot for left-sided hippocampal measurements.
In words, we can write
observed measurement = (true

average) + (true deviation for

subject) + (measurement error)
Measurement error in this example includes both the between-reader variation (how far reader j is on average from the true value for subject i) and also within-reader variation (the effect of reader j making a single read). If reader j were to re-measure the hippocampus, there is no guarantee that the measurement would be the same. With only one measurement of each hippocampus by each reader, both of these sources of variation enter the measurement error εij.
Fig. 4.9 illustrates an intraclass correlation coefficient (ICC) model of four readers considering that each reader assesses five subjects. If we had a perfect, error-free way of measuring subject one, for example, we would obtain the value μ + Δ1, the solid red dot. Differences between repeated measurements of the same value are due to measurement error; some measurements will be larger than this and some will be smaller. The actual values obtained from readers 1, 2, 3, and 4 on subject one are shown by the open red circles and can be shown algebraically as: