Key Points
- ▪
Initially, CT assessment of coronary artery disease was done via assessment of the burden of coronary artery calcium as a surrogate of coronary atherosclerotic plaque severity assessment.
- ▪
The coronary artery calcium burden is associated, on average, with the severity of CAD plaque stenosis, but with a problematically wide standard error.
- ▪
Calcium scoring improves classification of patients deemed to be at intermediate risk by conventional risk factor assessment.
- ▪
Outcome improvement or cost-effectiveness benefits have not yet been established. Weintraub states that “the question is not whether coronary calcium scoring adds additional information but whether it is enough to justify its use—and in which patient groups.”
- ▪
Calcium scoring can be accomplished by several scoring methods:
- ▪
The Agatston score should probably not be abandoned entirely, as it has the greatest amount of literature behind it.
- ▪
Calcium mass offers the greatest reproducibility, and its value is easily interchanged with that of the Agatston score.
- ▪
In many laboratories, calcium scoring is performed before coronary CT angiography (CTA) is (contingently) performed. If the score (for example, the Agatston score) is above a certain amount (for example, >600) the coronary CTA is not performed, because the CTA image quality is not likely to be adequate in the presence of extensive calcification. Thus, calcium scoring as an initial scan may obviate the radiation exposure of CTA.
According to the 1996 ACC/AHA Consensus Statement, “coronary calcification is part of the development of atherosclerosis; it occurs exclusively in atherosclerotic arteries and is absent in the normal vessel wall.” Calcium is a component of some, but not all, coronary atherosclerotic plaques. Calcium accounts for, on average, approximately 20% of the plaque volume, but there is wide variation in the amount of calcium within plaques, and a large plaque or severe stenosis may exist without calcification.
In general (but not always), coronary calcium correlates with plaque volume. CT determinations of coronary calcium compared with those obtained by intravascular ultrasound (IVUS) are excellent.
CT scanning is exquisitely sensitive to the presence of calcification and is easily the best test to detect calcification. The ability of CT to image, and then to quantify, coronary calcium with a calcium “score” launched an entire field of investigation.
Other cardiac structures within the heart and potentially near the coronary arteries, such as the aortic root, valve annuli, valves, pericardium, and myocardium, may calcify, as may other vessels.
Calcium Assessment by Cardiovascular CT is Possible by Different Methods
Cardiovascular CT may be used to assess calcium by any of the following methods:
- □
Agatston score
- □
Volume score
- □
Calcium mass score
Agatston Score
The Agatston score, the original means by which coronary calcification was quantified, was derived from the use of electron beam CT (EBCT) scanning. Calcium scoring by EBCT and cardiac CT, though, are not wholly equivalent.
Most of the literature on coronary calcification was derived using Agatston scoring on now-obsolete EBCT equipment. The determination of coronary calcification by other scores has less presence in the literature.
The Agatston score was derived from two-dimensional axial scans with 3-mm slice thickness, with calcium weighted according to its density as determined by HU (higher weight for greater HUs).
The first problem encountered with calcium scoring by the Agatston EBCT method was reproducibility: its accuracy was ±14% to ±51% (±40% average). Reproducibility even by now-obsolete four-slice CCT appeared superior: ±20%, and by 16-slice CCT reproducibility was even greater: ±13%. The better reproducibility of Agatston score by CCT may be the result of better spatial resolution.
The Agatston score is vulnerable to the partial volume effect. Phantom studies suggest that body size and level of scanning influence attenuation and calcium score. As the intra- and interobserver variability of coronary artery calcium scores by EBCT technology are low, ECG gating should be used to reduce the variability.
Agatston calcium scoring is influenced by the different equipment used for the scan.
In general, the literature suggests that coronary calcium scores lower than 400 by CCT and EBCT are similar but that older-generation CCT may not yield the same correlation as do more contemporary CCT scanners.
Problems with the Agatston score include:
- □
Susceptibility to partial volume effects
- □
Submitral annular calcium sampling
- □
Effects of slice thickness
- □
Effects of cardiac motion
- □
Very long breath-holds needed in EBCT systems
- □
Variability depending on the type and make of equipment used
Use of average density improves reproducibility.
Calcium Volume
The calcium volume score is the product of the number of voxels exceeding threshold multiplied by the volume of a voxel. It is theoretically independent of slice thickness—an improvement over the Agatston score. Calcium volume appears more reproducible than Agatston score: ±14%. However, calcium volume does not have as much literature to back it up.
Calcium (“Hydroxyapatite” or “Mineral”) Mass
Use of calcium or hydroxyapatite (HA) mass as a measure of the total amount of calcification offers improvements over the Agatston score but does not have as much literature to support it. It has become a preferred means of describing coronary calcium because it:
- □
Automatically adjusts/corrects for partial volume effects
- □
Is less affected by scan parameters
- □
Has the best reproducibility: ±9%
- □
Correlates well with Agatston score: r 2 = 0.97, y − 0.1922 x ( Table 14-1 )
TABLE 14-1
Variation of Agatston Score and Mass Score by EBCT and CCT
EBCT
CCT PROSPECTIVE
CCT RETROSPECTIVE
CCT RETROSPECTIVE
CCT RETROSPECTIVE
Width
3 mm
4 x 2.5 mm
4 x 2.5 mm
4 x 2.5 mm
4 x 1.0 mm
Agatston Score
Mean
35.5
20.8
21.6
24.1
28.8
σ
3.3
5.8
6.1
4.8
1.6
CV(%)
9.3
27.9
28.3
19.8
5.9
HA Mass
Mean
6.3
3.9
4.2
4.8
4.9
σ
0.3
0.9
1.0
0.8
0.2
CV(%)
5.3
22.2
23.9
16.1
4.1
CCT, cardiac CT; CV(%), mean coefficient of variance = σ/mean 10 ; EBCT, electron beam CT; HA, hydroxyapatite.
Mass score is 0.2 times the Agatston score.
Protocol of Coronary Artery Identification, Marking, and Calcium Scoring
Calcium Scoring Protocol
- □
Scanning
- •
Breath-hold
- •
3-mm slices
- •
55 mA, 120 kV
- •
- □
Software analysis
- •
Establish the cutoff for determining (coronary) calcium; usually 130 HU
- •
Select the score (e.g., Agatston, volume, or mass)
- •
Review on axial images: scroll from the top down
- •
Use the available software to:
- •
“Highlight” the coronary arteries (software algorithms)
- •
Select each coronary artery one after the other
- •
Mark the calcification that is to be included in the scoring
- •
Calculate the score specific to each artery, and the total score.
- •
See Figures 14-1 through 14-6 .
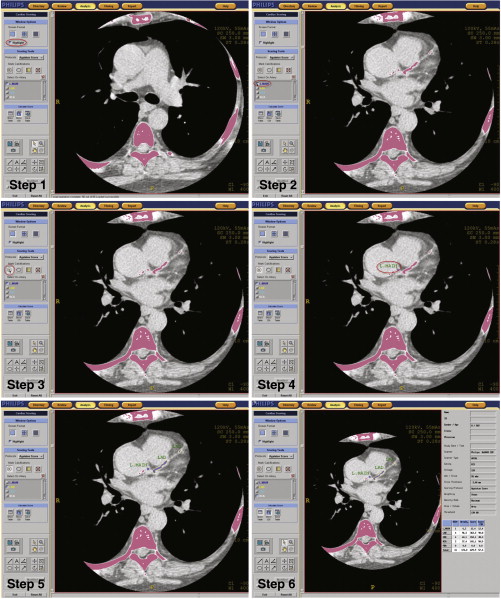
Figure 14-1
Step 1: Select: “Highlight” from the menu. Scrolling up and down through the heart, the coronary arteries, if calcified >130 HU, will become color-encoded. Here, above the coronary arteries, none appear color-encoded. Step 2: Select an artery from the menu. Here the left main coronary artery is selected from the menu. The imaging algorithms have identified calcium (using the 130 HU cutoff) in the aortic wall, the left main coronary artery (LMCA), and the left anterior descending artery (LAD). Step 3: Mark the calcification relevant to the selected artery, using the “mark calcification” cursor. Step 4: The artery and the calcification specific to it are identified by the process of highlighting, artery identification, and calcium marking. Step 5: Repeat selection of artery and marking with cursor, artery by artery (LMCA, LAD, left circumflex, right coronary). Step 6: Calcium scoring quantification.
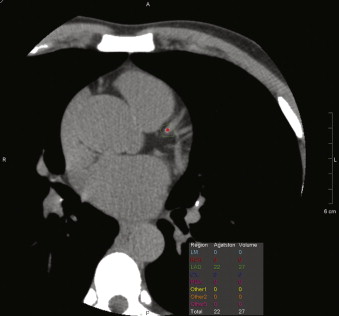
Figure 14-2
Automated coronary calcium Agatston scoring and calcium volume determinations. Note the red pixellation on the proximal LAD denoting calcium detection.
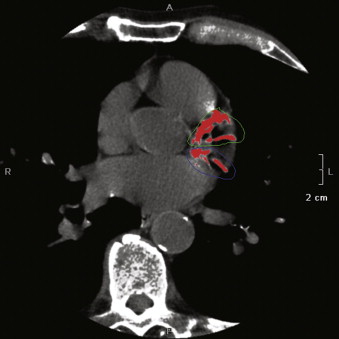
Figure 14-3
Manual separation of left anterior descending (traced green line) and left circumflex (traced blue line) automated coronary calcium detection (red pixels).
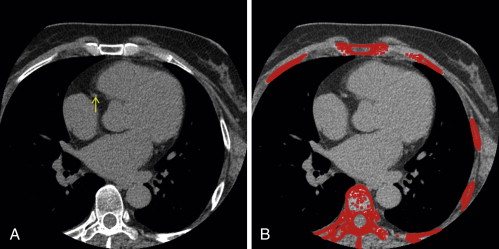
Figure 14-4
Coronary calcification despite a “zero” Agatston score. A, Note the visually apparent focus of calcification in the proximal right coronary artery (RCA; yellow arrow ). B, With the Agatston filter on, which selects voxels with an attenuation > 130 HU, the ribs and spine have been automatically depicted ( red pixelated regions ). Despite the visually apparent calcification within the proximal RCA, the filter has missed the RCA calcification, as the mean voxel attenuation within the RCA is <130 HU due to partial volume averaging of the calcium with lower attenuation material.
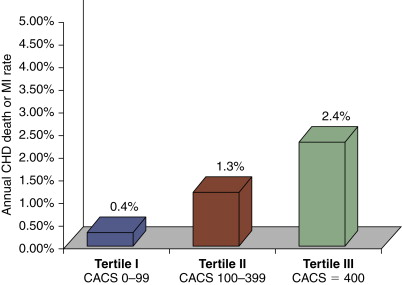
Figure 14-5
Estimated annual risk of coronary heart disease (CHD) death or myocardial infarction (MI) rate. Rate shown is by tertile of the Agatston score in patients at intermediate risk for a CHD event, using definitions of an intermediate Framingham Risk Score (FRS). Intermediate FRS has been variably defined as 10% to 20% risk or more than one cardiac risk factor.
(From Circulation . 2007;115:402-426; originally published online January 12, 2007; doi: 10.1161/CIRCULATIONAHA..107.181425.)
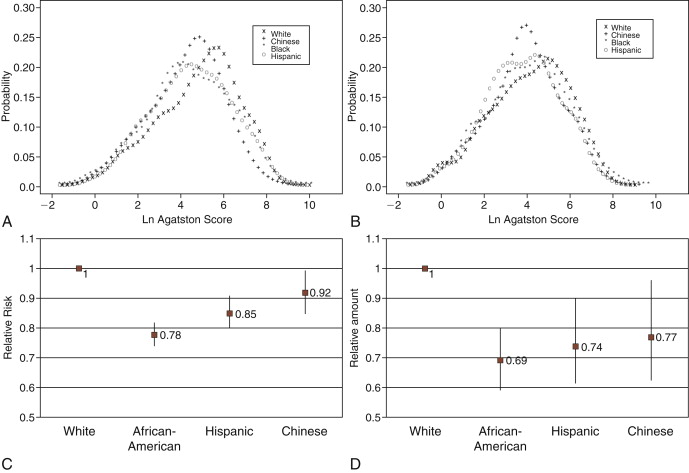
Figure 14-6
Results from the Multi-Ethnic Study of Atherosclerosis (MESA). A, Distribution of coronary calcification among those with detectable calcification by ethnicity, men. B, Distribution of coronary calcification among those with detectable calcification by ethnicity, women . C, Relative risk for presence of coronary calcification by ethnicity, compared with whites. 95% CIs shown. Adjusted for age, gender, education, body mass index (BMI), low-density lipoprotein (LDL) cholesterol, high-density lipoprotein (HDL) cholesterol, smoking, hypertension, diabetes, reported treatment for high cholesterol, and center. D, Relative coronary calcium amount, as measured by Agatston score, by ethnicity compared with whites, among those with detectable calcification. Relative amounts measured by Agatston scores. 95% CIs shown. Adjusted for age, gender, education, BMI, LDL cholesterol, triglycerides, smoking, hypertension, diabetes, reported treatment for high cholesterol, and center.
(Reprinted with permission from Bild DE, Detrano R, Peterson D, et al. Ethnic differences in coronary calcification: the Multi-Ethnic Study of Atherosclerosis (MESA). Circulation. 2005;111(10):1313-1320.)
- •
- •
Coronary Calcium and Electron Beam CT Studies
Adjusting for other risk factors, calcium scoring is a modest predictor of coronary events. CT coronary angiography trumps calcium scoring because it provides independent and incremental value in the prediction of all-cause mortality and a diagnosis.
By convention, a risk of more than 2% per year constitutes “high risk” and legitimizes the use of “aggressive interventions.”
Improved Stratification of Intermediate-Risk Patients
The main advantage of calcium scoring is that it provides improved risk assessment of intermediate-risk patients by conventional risk assessment schemes—for example, to “upgrade” them to high risk, and have them benefit from aggressive interventions. The ability of calcium scoring to add incremental information on coronary risk beyond conventional risk factor assessment has been demonstrated.
In general, there is no strong correlation between coronary calcium and conventional risk factor assessment, suggesting that these two strategies assess by different and what potentially may be complementary means. As predicted by correlation of coronary calcium score and Framingham Risk Score, as well as Adult Treatment Panel III (ATP III) from the National Cholesterol Education Program (NCEP) and PROspective CArdiovascular Münster Study (PROCAM), the 10-year risk events rate is low (0.19–0.28), with elevated coronary calcium scoring present in many patients with lower risk as predicted by traditional risk factors.
Observational Data on Calcium Scoring, Usually by Electron Beam CT, and Coronary Disease
- □
Baseline plaque burden determines coronary artery calcium (CAC) progression.
- □
Coronary calcification has both racial and genetic predisposition.
Observational Data on Calcium Scoring, Usually by Electron Beam CT, and Coronary Disease Outcomes
- □
Among patients younger than 60 years of age with a first infarct, CAC levels were greater than in aged-matched controls (529 ± 901 vs. 119 ± 213; P < .001). CAC scores above the 50th percentile were present in 87% of infarct patients and in 47% of controls, and above the 90th percentile in 61% of infarct patients and 6% of controls.
- □
Progression of coronary calcium scoring is greater (RR: 17.2-fold) in patients who experienced myocardial infarction (MI) versus those who did not.
- □
Annual change in coronary calcium scoring is greater in patients who experienced a coronary event. Among asymptomatic middle-aged individuals, the CAC scores of individuals who experienced MI, revascularization, or death were significantly higher: 764 ± 935 vs. 135 ± 432 ( P < .0001). A coronary calcium score of 160 was associated with odds ratios of 16 for nonfatal MI and 22 for death. Yet the South Bay Heart Watch Study reported an odds ratio of 3.1 ( P < .07) prediction of nonfatal MI and death, a level short of significance.
- □
Association of CAC and risk prediction is present even among the elderly, as reported by the Rotterdam Coronary Calcification Study.
- □
A high calcium score is three times more predictive of infarction/death than is a severe single-photon emission CT (SPECT) abnormality (25% vs. 7.5%; P < .0001).
- □
An extremely high CAC (>1000) poses a high risk of MI or death (36% with 28 months), greater than risk predicted by historical control MPI data.
- □
Screening patients presenting in the Emergency Department with chest pain by calcium scoring. If the calcium score is 0, the risk is low, as long as the prevalence of disease is low.
- □
Combined use of calcium scoring and measurement of plasma C–reactive protein assists in stratifying intermediate risk (nondiabetic) patients as each contributes independent risk prediction of cardiovascular events.
- □
A wide range of calcium scores is observed in older adults.
- □
A positive family history is associated with higher CAC scores.
- □
Coronary vasodilator response correlates inversely with the presence and severity of CAC scores.
- □
No major differences among racial or ethnic groups have been convincingly demonstrated in regard to the predictive value of CAC.
In the Multi-Ethnic Study of Atherosclerosis (MESA)—which included 6722 patients: 38.6% white, 27.7% black, 21.9% Hispanic, and 11.9% Chinese—increasing calcium scores were shown across ethnicities to correlate with increasing coronary risk of major events (myocardial infarction or death from coronary heart disease). No major differences were observed among racial and ethnic groups in the predictive value of calcium scoring. Whether or not calcium predicted or contributed to risk, whether or not renal dysfunction contributed to the observations, and whether or not the study was underpowered with respect to its predetermined event rate engendered discussion. Differences were detected in the presence and quantity of calcium that were not explained by conventional coronary risk factors. The amount of coronary calcification (Agatston score > 0) was greatest among whites (see Figs. 14-5 and 14-6 ). The MESA website ( http://www.mesa-nhlbi.org/CACReference.aspx ) has on-line calculators of measured CAC as a percentile of age, gender, value according to race, and “arterial age.”
Experimental Data on Calcium Scoring, Usually by EBCT, and Coronary Disease Outcomes
- □
Treatment with low-dose atorvastatin and vitamins C and E does not reduce CAC progression (St. Francis Heart Study).
- □
Effect of lipid lowering on coronary calcium scoring as see on EBCT
- •
Median annualized rate of coronary calcium scoring increase in untreated vs. statin-treated: 25% vs. 9%
- •
The extent to which plaque volume decreased, stabilized, or increased related directly to treatment with statins
- •
Calcified plaques are more resistant to medical interventions, because they contain less lipid.
- •
- □
Progression rates
- •
Treated (all risk factors): 15 ± 8%
- •
Untreated: 39 ± 12%/year
- •
A relation of on-treatment cholesterol levels (under standard and intensive atorvastatin regimens) and CAC progression by EBCT was not demonstrated (over a 12-month period).
Outcomes Data on Calcium Scoring, Usually by Electron Beam CT, and Coronary Disease Outcomes
- □
There are no outcomes data on calcium scoring versus coronary disease outcomes to date.
- □
The most relevant outcomes data on calcium scoring is that intermediate-risk (10-year 10–120% risk) patients, by Framingham scoring, would have better survivals if they were to undergo CT and were reclassified.
Cost-effectiveness Data on Calcium Scoring, Usually by Electron Beam CT, and Coronary Disease Outcomes
There are no cost-effectiveness data to date.
Caveats, Concerns, and Controversy
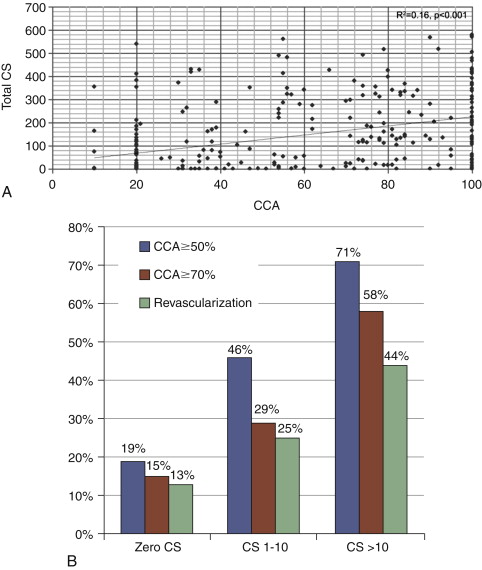
However, a calcium score of 0 does not always predict no/low risk.
- □
Core-64
- •
Of 72 patients with a calcium score of 0:
- •
56% had a stenosis >50%
- •
a calcium score of 0 has limited negative predictive value for stenosis <50% ( Fig. 14-7 ; Table 14-2 )
- •
- •

