RADIOLOGY
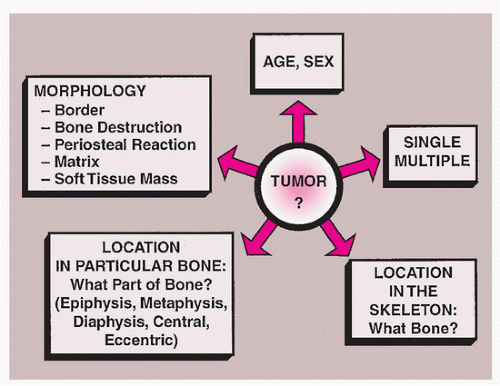
Musculoskeletal tumors are commonly suspected on the basis of the history and physical examination. They are most often revealed on conventional radiographic examination. The imaging of these tumors serves three purposes: (1) detection, (2) diagnosis and differential diagnosis, and (3) staging.
In spite of the spectacular advances in imaging technology that have taken place over the past few decades,
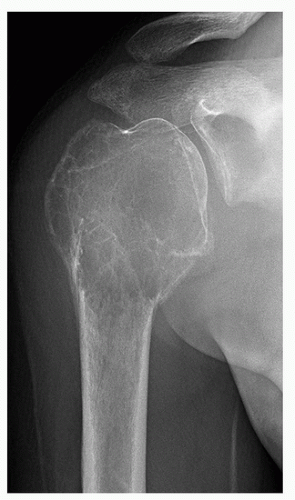
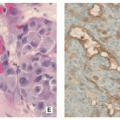
radiography still figures most prominently in determining a diagnosis and in providing a basis for differential diagnosis. It offers the most useful data concerning location and morphology of a tumor, including information about zone of transition, periosteal reaction, ossifications, calcifications, and type of bone destruction (
Fig. 1.1).
Some techniques have more limited, but still valuable, diagnostic functions. Scintigraphy, for instance, can distinguish multiple myeloma from metastases that are similar in appearance, or a bone island from a sclerotic tumor, but is only sometimes instrumental in making a precise diagnosis. Ultrasonography only seldom yields data that can be used to differentiate malignant from benign tumors. Arteriography sometimes can reveal abnormal tumor vessels and can help distinguish bone abscess from osteoid osteoma. Its main functions, though, are (1) to map out the lesion in the bone and determine the extent of disease and (2) to reveal the vascular supply of the tumor, localize vessels for preoperative intra-arterial chemotherapy, and pinpoint the area most suitable for open biopsy, as the most aggressive parts of a tumor lie within the most vascular sections of a tumor.
The most dramatic radiologic advances that have been made in the past couple of decades concern the staging
(evaluation) of bone tumors.
Computed tomography (CT) and
magnetic resonance imaging (MRI) are indispensable in tumor staging for the following reasons: (1) their multiplanar capacities and outstanding soft-tissue contrast; (2) their ability to ascertain, with great accuracy, the tumor size, configuration, and location; (3) their capability in showing the intramedullary and extramedullary extension of tumors; and (4) their ability to reveal the relationship of tumors to nearby joints, as well as to muscles, muscle compartments, neurovascular bundles, and fascial planes. MRI, more than any other imaging modality, provides the most accurate anatomic staging. It should be noted that MRI, however, is not always successful in distinguishing benign from malignant tumors, even though attempts have been made to delineate the following markers: signal intensity patterns, the presence of edema, the appearance of tumor margins, and neurovascular bundle involvement.
Two techniques in particular are important in staging— single photon emission computed tomography (SPECT) and scintigraphic techniques using technetium-99m (99mTc), gallium-67 (67Ga) citrate, and indium-111 (111In)-labeled white blood cells. The radiopharmaceutical labeling enables these methods to yield information about the location and size of a tumor, as well as the pathophysiologic status of bone and the soft tissues surrounding it.
Positron emission tomography (PET), the most recent imaging modality to be applied to the diagnosis of musculoskeletal tumors alone or in combination with CT or MRI (PET-CT, PET-MRI), is able to correct for tissue attenuation signal loss and has relatively uniform spatial resolution. Because of these unique qualities, PET has gained wide acceptance. This technique has been able to supply information about the metabolism of musculoskeletal lesions, on the basis of high glycolysis rates in malignant tissues; whole-body 18F-labeled 2-fluoro-2-deoxyglucose (18FDG)-PET scanning has been of particular value in identifying primary, recurrent, and metastatic malignancies.
Conventional Radiography
Conventional radiographs provide abundant information about bone lesions:
Location of the lesions in the skeleton and individual bone (topography of the lesion).
Zone of transition (borders of the lesion).
Type of bone destruction.
Periosteal reaction (type of periosteal response to the lesion).
Extent and quality of soft-tissue involvement.
Composition of the tumor tissue (type of lesion matrix).
In the diagnosis of bone tumors, determining whether a lesion is solitary or multiple and the age of the patient are starting points.
Primary malignant tumors, including fibrosarcoma, malignant fibrous histiocytoma, Ewing sarcoma, chondrosarcoma, and osteosarcoma, do not often present as multiple lesions. Malignancies that are multifocal usually indicate multiple myeloma, metastatic disease, or lymphoma. Benign bone lesions with multifocal sites of involvement include, among others, polyostotic fibrous dysplasia, enchondromatosis, multiple cartilaginous exostoses (multiple hereditary osteochondromata), Langerhans cell histiocytosis (eosinophilic granuloma), hemangiomatosis, and osseous fibromatosis.
The patient’s age is the most important item of clinical information that can be used along with the radiographic studies to reach a diagnosis. Certain bone tumors are found almost exclusively in certain age groups. For instance, metastatic lesions, conventional chondrosarcoma, and myeloma are usually seen in patients 40 years of age and older, and giant cell tumor of bone almost always arises after skeletal maturity (growth plate closure). In contrast, chondroblastoma, aneurysmal bone cyst, and chondromyxoid fibroma rarely are encountered in patients over 20 years old. When tumors do occur outside of their typical age group, they may not appear in the usual locations or may have a different radiographic appearance. This is the case with the simple bone cysts (so-called unicameral bone cysts). Before skeletal maturity, they usually arise in the proximal humerus or proximal femur. After skeletal maturity, however, they may be found in the calcaneus, scapula, or pelvis, among other places; with aging, they may look somewhat unconventional on radiography.
Site of the Lesion
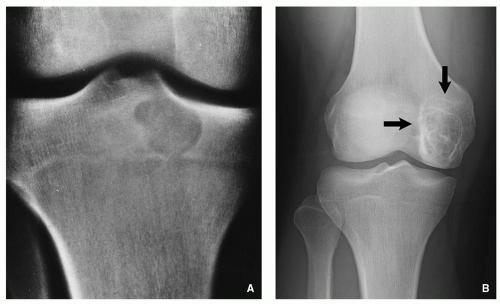
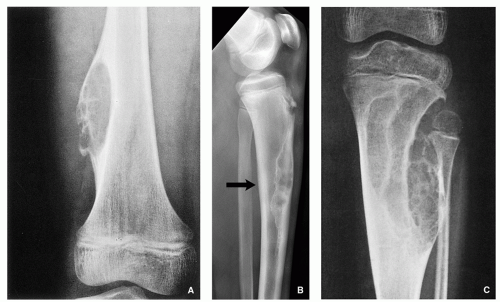
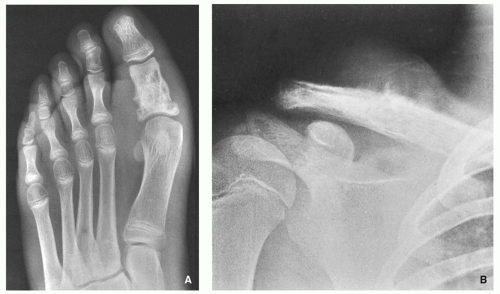
A number of tumors have a predilection for specific bones or sites in bones, a fact that aids in diagnosis. The specific location is the result of developmental anatomy of the tumorinvaded bone and of the laws of field behavior. An example of such a tumor is chondroblastoma, which occurs mainly
in the epiphysis of the long bones before skeletal maturity has taken place (
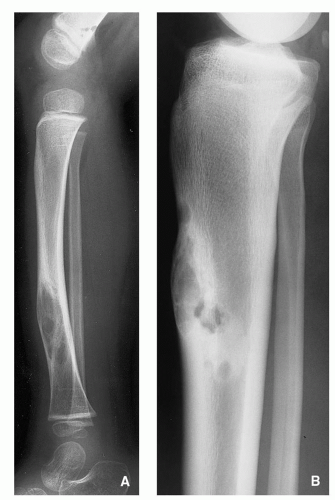
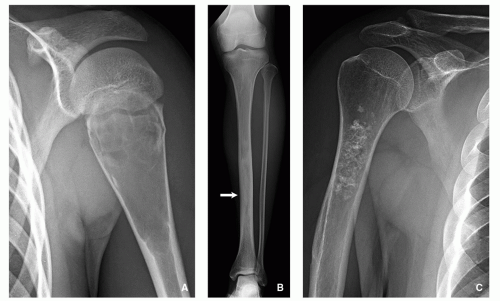
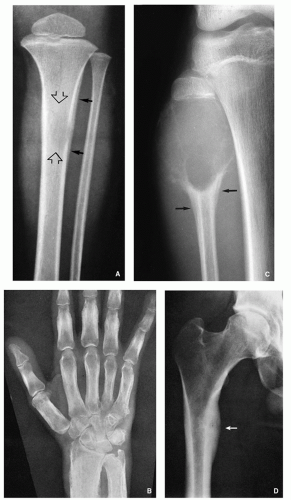
Fig. 1.2). Similarly, adamantinoma and osteofibrous dysplasia show a strong preference for the tibia (
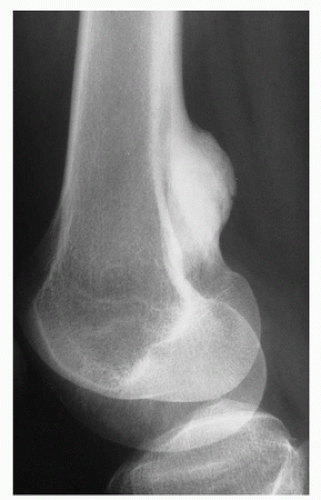
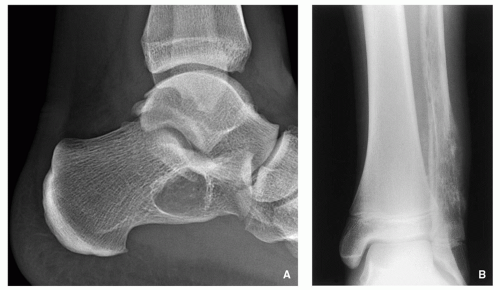
Fig. 1.3). Sometimes the location is so characteristic of the tumor that it alone can indicate the diagnosis, as in the case of parosteal osteosarcoma, which is found in most cases in the posterior aspect of the distal femur (
Fig. 1.4). The site of the lesion can also be used in differential diagnosis. Because giant cell tumors are rarely found in another location than in the articular end of a bone, for instance, this diagnosis essentially should not be entertained if the lesion in question occurs in any other place (
Fig. 1.5).
The relation of tumor to the central axis of the bone— especially a long tubular bone like the humerus, radius, tibia, and femur—is an equally significant component in assessing the site of the lesion. Some lesions appear centrally located; these include simple bone cyst (
Fig. 1.6A), a focus or fibrous dysplasia (
Fig. 1.6B), or enchondroma (
Fig. 1.6C). An eccentric location is more typical of aneurysmal bone cyst (
Fig. 1.7A), nonossifying fibroma (
Fig. 1.7B), and chondromyxoid fibroma (
Fig. 1.7C).
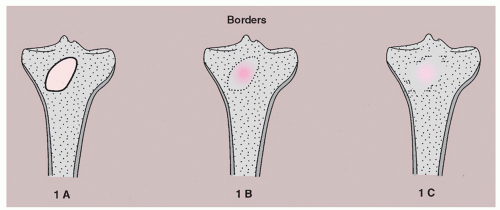
Borders of the Lesion
The lesion borders, or margins, can reveal much about how fast a lesion grows and thereby shed light on whether it is benign or malignant. A well-defined border indicates a slower growth rate and hence a greater likelihood of benignity (
Fig. 1.8A). In contrast, an ill-defined border reflects a faster growth rate and thus a higher probability of malignancy (
Fig. 1.8B).
The margins can be divided into three types: (1) one sharply demarcated by sclerosis between the host bone and the peripheral aspect of the tumor (type IA margin); (2) one around the periphery of the lesion showing sharp demarcation but with no sclerosis (type IB margin); and (3) one with an ill-defined region where the lesion and host bone meet, involving either part of all of the circumference (type IC margin) (
Fig. 1.9).
Benign tumors, such as aneurysmal bone cyst, chondromyxoid fibroma, simple bone cyst, and nonossifying fibroma, nearly always exhibit sharply defined borders (narrow zone of transition) with sclerosis at their margins (see
Figs 1.7 and
Fig. 1.8A). Conversely, malignant tumors, or those that are aggressive, instead are marked by indistinct borders (a wide zone of transition) (see
Fig. 1.8B). Although radiotherapy or chemotherapy of malignant lesions can produce sclerosis, and thus a narrow zone of transition, in general, malignant or benign but aggressive tumors do not have sclerotic borders on radiographs. Such tumors include among others fibrosarcoma, malignant fibrous histiocytoma, multiple myeloma or solitary plasmacytoma, lymphoma, and metastases from primary tumors in the gastrointestinal tract, thyroid, and kidney.
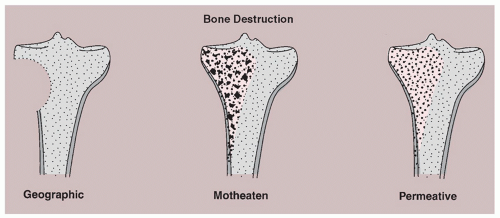
Type of Bone Destruction
Destruction of bone may be caused by the tumor cells themselves. It may also result from the reaction of normal osteoclasts in the host bone to the growing pressure of the mass and to tumor-associated hyperemia. Although trabecular bone is destroyed at a faster rate than is cortical bone, cortical bone loss appears earlier on radiographs because its density is highly homogeneous compared with that of trabecular bone. About 70% of mineral content must be lost before trabecular bone loss shows on radiographs.
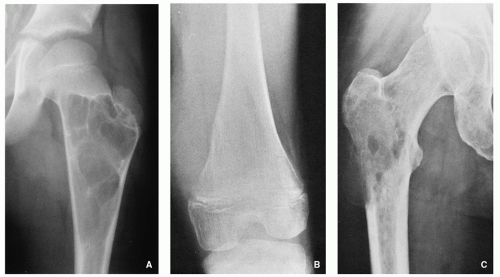
Three types of bone destruction can be defined, with the type of loss reflecting growth rate of the tumor. These types are (1) geographic (type I), marked by an area that is uniformly destroyed lying within sharply outlined borders; (2) moth-eaten (type II), characterized by small, multiple lytic areas, often clustered; and permeative (type III), showing as very small oval radiolucencies or lucent streaks that are ill defined (
Fig. 1.10). These features alone do not define any specific tumors, but they are of help in differentiating benign from malignant lesions. Benign, slow-growing tumors, such as giant cell tumor, simple bone cyst, enchondroma, or chondromyxoid fibroma, show geographic bone destruction (
Fig. 1.11A). In contrast, malignant tumors such as fibrosarcoma, Ewing sarcoma, myeloma, or lymphoma— all fast-growing and rapidly infiltrating tumors—have type II (
Fig. 1.11C) or type III (
Fig. 1.11B) destruction. It should be noted that some nonmalignant lesions may show this aggressive pattern. Examples include osteomyelitis, which may show both moth-eaten and permeative types of destruction, and hyperparathyroidism, which may produce a permeative pattern. Often, the same lesion may contain both types II and III, and distinguishing between them may present a challenge.
Periosteal Reaction
Like bone destruction, the periosteal reaction reveals the biologic activity of a lesion. It should be noted that no single periosteal response is unique to a particular lesion (
Table 1.1). A periosteal process may manifest as any irregularity or broadening of the bone contour. Bone tumors produce periosteal reactions of two basic types: continuous (uninterrupted) and discontinuous (interrupted). The solid reaction, referred to as cortical thickening, can be a single solid layer or multiple closely apposed and fused layers of new bone that are joined to the cortex on its outer surface.
Although the periosteal response is not a hallmark of any given lesion, as noted above, it has diagnostic value. A continuous reaction is likely to represent a benign lesion that is slow growing and usually indolent. The solid periosteal response may take many forms: (1) a single lamellar reaction, as seen with osteomyelitis, stress fracture, and Langerhans cell histiocytosis (
Fig. 1.12A); (2) an undulating shape, seen in long-standing varicosities, chronic lymphedema, periostitis, pulmonary osteoarthropathy, and, rarely, with neoplasms (
Fig. 1.12B); (3) a solid buttress, such as accompanying aneurysmal bone cyst and chondromyxoid fibroma (
Fig. 1.12C); and (4) a solid elliptical or smooth layer, for example, present in osteoblastoma and osteoid osteoma (
Fig. 1.12D).
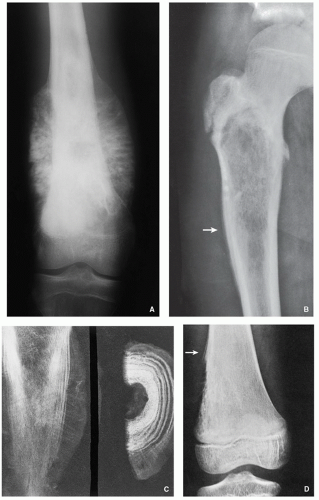
In contrast, a discontinuous pattern most likely indicates primary malignant tumors and, less frequently, metastases and extremely aggressive nonmalignant lesions. The periosteal reaction in such tumors may have a characteristic sunburst (
Fig. 1.13A) or onionskin arrangement (
Fig. 1.13B and C). Another radiographic feature of note is the Codman triangle; this landmark is created when the tumor has invaded beyond the cortex and destroys newly lamellated bone, the remnants of which, on both ends of the breakthrough area, form this triangle (
Fig. 1.13D).
Soft-Tissue Mass
The presence of a soft-tissue mass is a reliable indicator of an aggressive or malignant process. In contrast, benign bone neoplasms are not associated with soft-tissue mass, with certain exceptions, including among others desmoplastic fibroma, aneurysmal bone cyst, and giant cell tumor. Some nonneo-plastic processes can produce soft-tissue masses, as well; an example is osteomyelitis. In a condition such as this, the mass lacks sharp definition and the fatty tissue layers appear obliterated. Masses related to malignancy look quite different; they usually are well defined and extend through the damaged cortex, with tissue planes remaining intact (
Fig. 1.14).
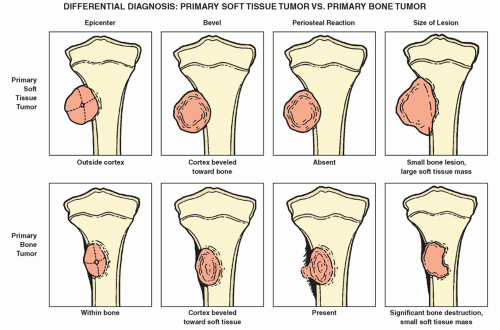
An important issue regarding soft-tissue masses is whether the mass is an extension of a primary bone tumor or is it a primary soft-tissue tumor invading bone. Making this determination often is challenging, as there are no hard-andfast rules to follow. Careful observation may suggest answers. For example, if the bone lesion is small in relation to the soft-tissue mass, the bone lesion likely represents secondary bone involvement. Note, however, that in a small number of primary malignancies—notably, Ewing sarcoma—the bone lesion may be smaller than the accompanying soft-tissue mass. The periosteal response yields another clue. Primary malignant bone tumors usually elicit a periosteal response when they break through the cortex and invade neighboring soft tissues; conversely, primary soft-tissue tumors impinging on bone generally elicit no such response as they destroy the adjacent periosteum (
Fig. 1.15).
Composition of Tumor Tissue (Type of Lesion Matrix)
Matrix, produced by mesenchymal cells, is intercellular material consisting of chondroid, myxoid, collagen, osteoid, and bone elements. A radiographic study of the matrix frequently can yield sufficient findings to differentiate between chondroblastic and osteoblastic processes and may help in distinguishing between lesions similar in appearance. Nonetheless, at times, it can be difficult to determine whether the matrix is osseous or cartilaginous. On the one hand, osseous matrix will appear fluffy, occasionally more organized, and trabecular. Conversely, cartilaginous matrix is more amorphous, typically with calcifications.
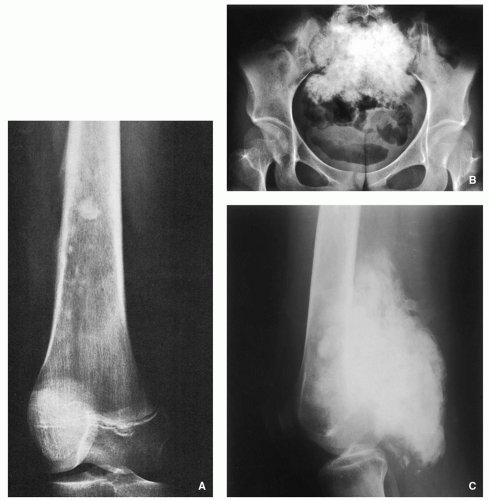
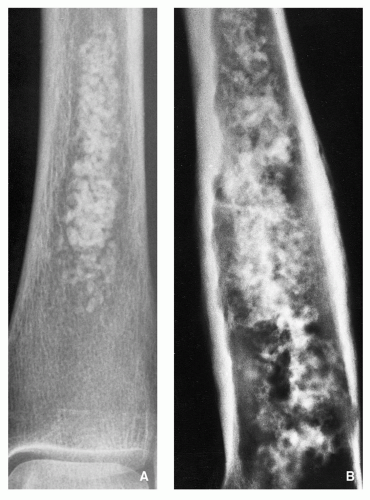
Osteosarcoma should be strongly considered if irregular, not fully mineralized bone matrix is identified on the radiograph as well as if cloud-like densities in the medullary cavity and neighboring soft tissues can be discerned (
Fig. 1.16). It must be remembered, however, that tumor bone may bear a striking resemblance to reparative new bone generated after bone destruction by a process such as callus formation or reactive sclerosis.
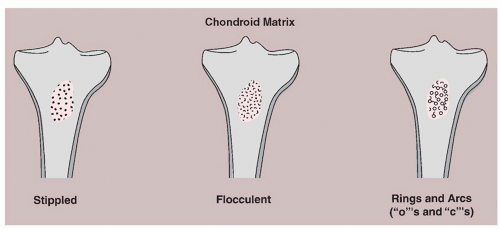
In contrast to the cottony densities indicative of tumor bone, calcifications that lie within the tumor matrix suggest chondrogenic processes. They may take on any of three types of appearance: (1) stippled, or punctate; (2) flocculent, or irregularly shaped; or (3) annular or comma-shaped rings and arcs, producing a curvilinear look (
Fig. 1.17). Calcifications occurring in a benign tumor or in a malignant tumor that is well differentiated may be the product of endochondral ossification. In making a differential diagnosis of the three types of calcifications, the following tumors may be considered: chondrosarcoma, chondroblastoma, and enchondroma (
Fig. 1.18 A,B).
If a lesion appears radiolucent, its origin could be either fibrous or cartilaginous. However, tumor-like lesions, such as an intraosseous ganglion or a simple bone cyst, that produce hollow structures may appear radiolucent, as well.
Benign versus Malignant Nature
Radiography alone is sometimes not sufficient for distinguishing between benign and malignant lesions. However, certain characteristics of the radiographic presentation can help the radiologist lean in one direction or the other. Malignant lesions show the following features:
Borders that are poorly defined, with a wide zone of transition.
A moth-eaten or permeative pattern to the bone destruction.
A periosteal reaction with an interrupted, onionskin, or sunburst arrangement, with a neighboring soft-tissue mass.
On occasion, benign tumors may demonstrate aggressive characteristics such as those listed above. In general, however, benign lesions show the following features:
Borders that are sharply defined and sclerotic.
A geographic type of bone destruction.
A periosteal reaction that is uninterrupted and solid, with no accompanying soft-tissue mass.
Computed Tomography and Magnetic Resonance Imaging
In determining whether tumor is present in the cortex, trabecular bone, or marrow cavity, CT and MRI have a high degree of accuracy. CT is not really of use in reaching a specific diagnosis, but it has great value because of the following capabilities: (1) it can clearly show a bone tumor that lies within an anatomically complex structure such as the pelvis, sacrum, or scapula; (2) it delineates with great precision how far a bone tumor extends and may reveal invasion of the cortex and surrounding soft tissues; (3) it shows surface lesions that occur on the bone, including juxtacortical chondrosarcoma, parosteal osteosarcoma, osteochondroma, and periosteal chondroma; and (4) three-dimensional CT images may offer a sharper and more complete view of the tumor.
The radiologist must decide when to use CT versus MRI. The choice is based on radiographic observations. If radiography does not reveal extension of the bone tumor into soft tissue, then CT is used because it can demonstrate, with precision, cortical invasion and periosteal reaction, along with how far the tumor extends within the bone. If, however, radiography does show a soft-tissue mass together with cortical disruption or destruction, MRI would be the technique of choice because of its exceptional soft-tissue contrast and ability to reveal the extraosseous growth of the tumor. In fact, this attribute of providing superior soft-tissue contrast gives MRI a definite edge over CT. Furthermore, because of its ability to image on multiple planes (sagittal, coronal, axial, and oblique) and because it is not marked by beamhardening artifacts from cortical bone, MRI is able to delineate intraosseous tumor extension, as well.
Spin echo (SE), short-time inversion recovery (STIR), gradient-recalled echo (GRE), and fast T2 or fat-suppressed T2-weighted sequences may be used to assess bone tumors. For identifying and staging most bone tumors, SE sequences are preferred, as the signal intensity for normal tissues is predictable. Bone marrow and fat display high signal intensity on T1 sequences; on T2 sequences, however, the signal intensity decreases to intermediate. Fluid shows intermediate signal intensity on T1-weighted images and high signal intensity on T2-weighted images. On both T1- and T2-weighted images, muscle has intermediate intensity. On both sequences, bone and fibrocartilage have low signal intensity. In imaging bone tumors (whose T1 and T2 relaxation times are increased relative to normal tissue), T1-weighted SE sequences show low or intermediate signal intensity, and T2-weighted sequences exhibit high signal intensity (
Table 1.2). It should be noted that T1 and T2 images reveal different MRI characteristics of a bone tumor. On the one hand, contrast between tumor and bone, tumor and bone marrow, and tumor and fatty tissue is increased on T1-weighted SE sequences; on the other hand, contrast between tumor and muscle, as well as highlighting of peritumoral edema, is enhanced with T2-weighted SE, T2-weighted GRE, and other fluid-sensitive, such as STIR sequences (
Fig. 1.19A-D).
Contrast-enhanced MRI with intravenous injection of gadopentetate dimeglumine (gadolinium diethylenetriaminepenta-acetic acid [Gd-DTPA]) offers further advantages. This enhancement reduces the T1 relaxation time on conventional T1-weighted sequences, allowing for higher signal intensity in the lesion and thus for enhanced delineation of the lesion (
Figs. 1.20 and
1.21). This enhancement is especially notable in compressed tissue situated around the tumor, in heavily vascularized areas, and in muscle that is atrophic but greatly vascularized. Static and dynamic Gd-DTPA images are also of value in assessing musculoskeletal tumors. On T1 weighting, those areas showing contrast enhancement are usually more vascular; those not showing it generally consist of necrotic tissue. If a chemical shift (CHESS sequences) or fat suppression technique is used, an even greater advantage is conferred. In this technique, the fat signal is greatly
suppressed, and the contrast-enhanced tumor shows a high signal intensity, resulting in an improved interface between tumor and reactive zone, tumor and peritumoral edema, and tumor and adjacent muscle.