For over 20 years, conventional MR imaging has been used for assessing brain tumors. However, conventional MR imaging tends to underestimate the extent of the tumor, perhaps leading to suboptimal treatment. New MR imaging tools have been widely used to determine the grade, heterogeneity, and extent of brain tumors. Diffusion-weighted imaging has been studied extensively, helping in tumor grading, differential diagnosis, and postoperative evaluation. Diffusion tensor imaging can apparently delineate more accurately the tumor versus the infiltrating tumor between the peritumoral edema and the normal brain parenchyma. This article shows the main clinical applications of these sequences.
In the United States, approximately 40,000 new cases of malignant and nonmalignant brain neoplasm are diagnosed annually, and it is estimated that brain tumors cause the deaths of 13,000 patients every year. The prevalence of primary neoplasms of the central nervous system (CNS) is around 15,000 to 17,000 new cases each year. Although this incidence annually represents only 1.3% of all new cases of cancer, brain tumors correspond to 2.3% of all deaths caused by cancer. Brain metastases occur in around 100,000 persons annually with malignancy elsewhere in the body, approximately 30% of all patients with disseminated cancer. When metastatic lesions are included, brain tumors are estimated to cause the death of 90,000 patients every year. Gliomas are the leading cause of primary CNS tumor, accounting for 40% to 50% of cases and 2% to 3% of all cancers. The mortality rate of primary malignant brain tumors is around 4 per 100,000 person-year. Despite new treatment approaches, patient survival still remains very low, varying between 16 and 53 weeks.
For more than 20 years, conventional MR imaging, typically T1- and T2-weighted imaging, has been used for assessing brain tumors including initial detection, diagnosis, guiding intervention, monitoring after therapy, and overall prognosis. Surgical excision of the visible abnormality is often attempted, despite a consensus that conventional MR imaging has a tendency to underestimate the extent of the tumor, which in turn, many suspect, leads to suboptimal treatment. In part this is because most primary brain neoplasms, especially high-grade gliomas, infiltrate the brain parenchyma out beyond the enhancing portion of the lesion. This infiltration appears to follow the main fiber bundles, possibly along the vessel channels, without disrupting the blood-brain barrier. Many other imaging techniques are under development to attempt to address these and other issues.
New advanced MR imaging tools have been widely used to determine the grade, heterogeneity, and extent of brain tumors. Diffusion-weighted imaging (DWI) has been studied extensively in the evaluation of brain tumors; helping, for example, in tumor grading, differential diagnosis, and postoperative evaluation. Diffusion tensor imaging (DTI) has the apparent ability to illustrate the relationship of a tumor with the nearby main fiber tracts, delineating more accurately the tumor versus the infiltrating tumor between the peritumoral edema and the normal brain parenchyma. More recently, it has been suggested that DTI might be used to aid in surgical planning, be helpful in radiotherapy planning, and to monitor the tumor recurrence and tumor response to treatment. A preoperative approach that maps, even imperfectly, the tumor and its relationship to nearby functional structures may facilitate the patient’s outcome because a complete-as-possible lesion resection that does not harm vital brain functions is always desired. Although these new applications have not been proven or even widely studied in multicenter clinical trials, many individual practitioners are actively using DTI.
Clinical use
Assessment of Extracranial Tumors
Epidermoid Tumor
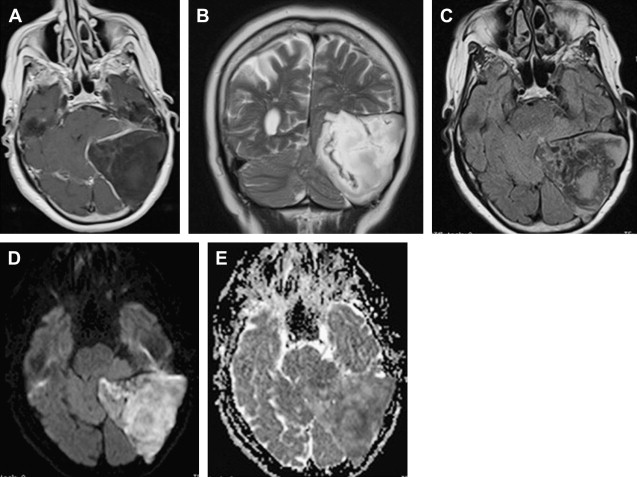
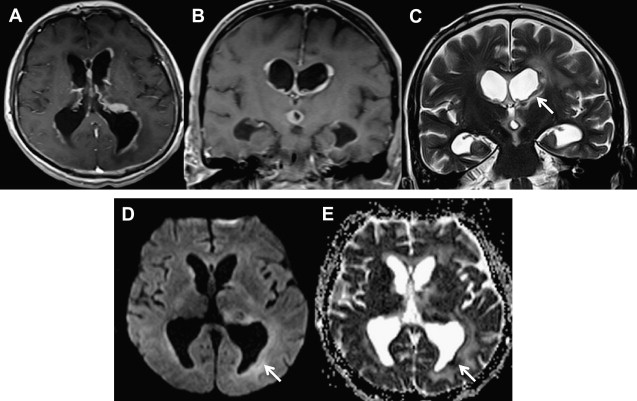
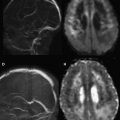
As the signal intensity of epidermoid tumor is frequently quite similar to cerebrospinal fluid on conventional T1- and T2-weighted images, its diagnosis can be challenging in clinical practice. Arachnoid cysts may have a similar appearance on conventional MR imaging, complicating the differential diagnosis between these two extra-axial lesions. DWI can be used as an effective way of differentiating an arachnoid cyst from epidermoid tumors. Both lesions present the same T1 and T2 signal intensity characteristic of cerebrospinal fluid. On DWI, epidermoid tumors are hyperintense, because they are solidly composed ( Fig. 1 ), whereas arachnoid cysts are hypointense, demonstrating high diffusivity ( Fig. 2 ). Apparent diffusion coefficient (ADC) values of epidermoid tumors are similar to those of the brain parenchyma or may be slightly reduced, impeded by tumor contents, such as keratinous debris. Whereas ADC values of arachnoid cysts are similar to those of cerebrospinal fluid. As a result, DWI can be used to better assess follow-up of surgically resected epidermoid tumors, proving efficacious in the detection of residual lesions.
Meningioma
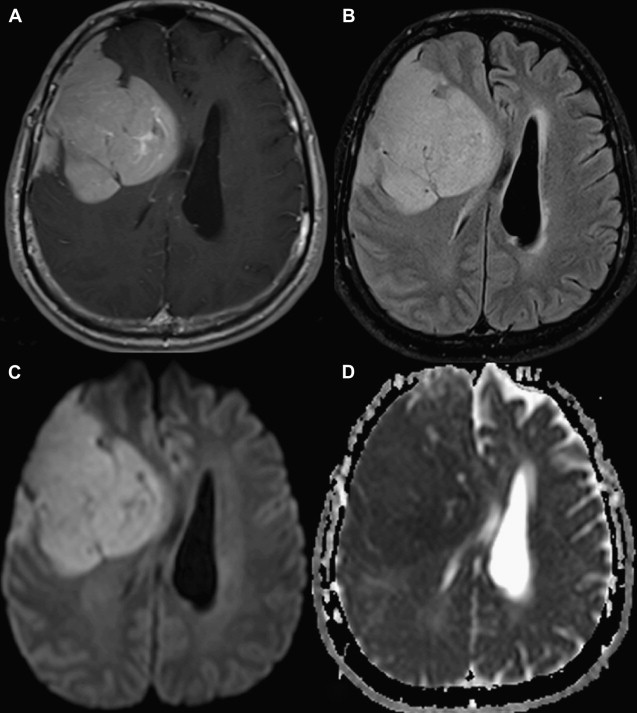
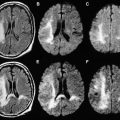
Most meningiomas, especially malignant and atypical samples, have a restricted diffusion ( Fig. 3 ), displaying low ADC values, when compared with typical meningiomas ( Fig. 4 ). Some aspects have been postulated to contribute to decrease ADC values in malignant and atypical meningiomas, including hypercellularity, a high nuclear-to-cytoplasmic ratio, prominent nucleoli, and decreased extracellular water. The preoperative measurement of ADC values may predict the malignancy of meningiomas, which may be useful to decide on the surgical strategy or to prescribe the adjunctive therapy. As a consequence, a more accurate prognosis may be obtained. A more recent report suggested that DTI could be also useful in such differentiation. The investigators demonstrated a significantly intratumoral microscopic disorganization in classic meningioma, based on lower fractional anisotropy (FA) and greater λ 2 and λ 3 , when compared with atypical meningioma.
Characterization of Intracranial Cystic Masses
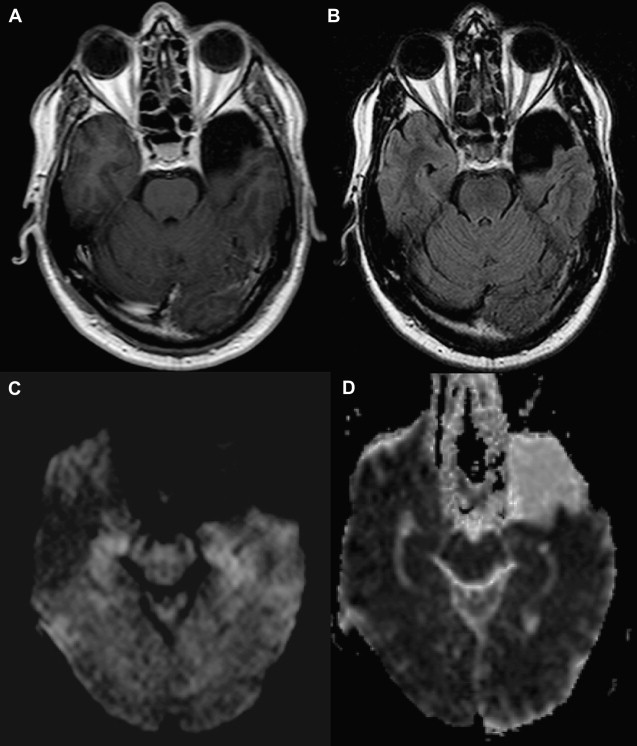
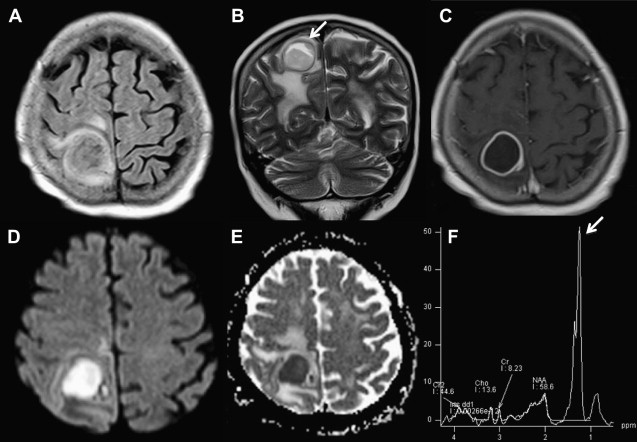
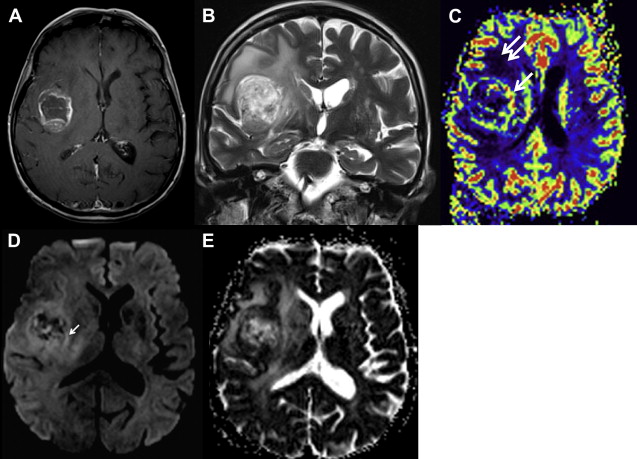
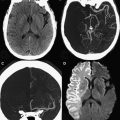
DWI can also provide a sensitive and specific method for differentiating tumor from abscess in certain settings. The abscesses have a high signal on DWI and a reduced ADC within the cavity ( Fig. 5 ). This restricted diffusion is probably related to the characteristic of the pus in the cavity. Because pus is a viscous fluid and may, in turn, lead to reduced water mobility, lower ADC, and bright signal on DWI. On the other hand, necrotic and cystic tumors display a low signal on DWI with an increased ADC as well as isointense or hyperintense DWI signal intensity in the lesion margins ( Fig. 6 ). Although these findings can be helpful, they are of course not absolute: under certain conditions, restricted diffusion has been documented in hemorrhagic metastases, radiation necrosis, and cystic astrocytoma.
Tumor Grading
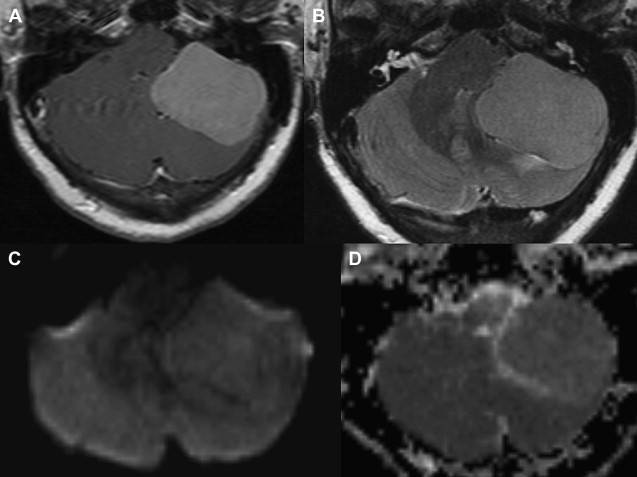
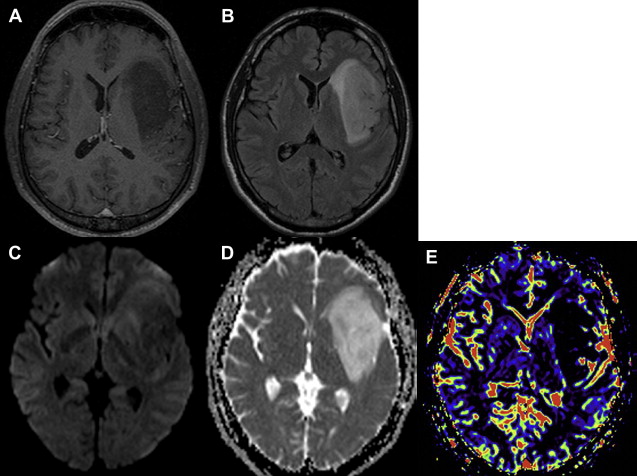
Tumor grading is very important in treatment decision and evaluation of prognosis. In certain settings diffusion imaging appears to increase both the sensitivity and specificity of MR imaging in the evaluation of brain tumors by providing information about tumor cellularity, which may, in turn, improve the prediction of tumor grade ( Fig. 7 ). Free water molecules’ diffusivity is restricted by cellularity increases present in high-grade lesions. The reduction in extracellular space as well as the high nuclear-to-cytoplasmic ratios of some cancer cells causes a relative reduction in the ADC values. A correlation between ADC values and tumor cellularity has been described, with lower ADC values suggesting high-grade lesions. In some studies, however, ADC values found in high- and low-grade gliomas have overlapped somewhat. Thus, evaluation of tumor grade with diffusion image remains uncertain and still cannot be considered a reliable tool for this purpose.
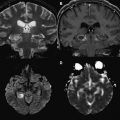
DWI has also been shown to assist in assessing high cellularity of other brain neoplasms. In some studies, lymphoma, a highly cellular tumor, has been found to present hyperintense signal intense on DWI and reduced ADC values ( Figs. 8 and 9 ).
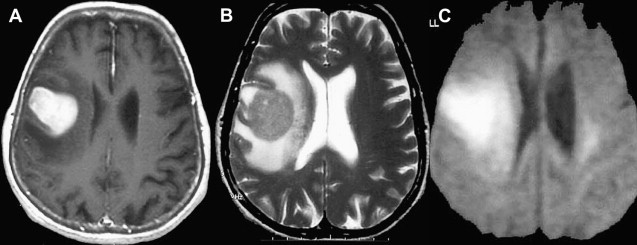
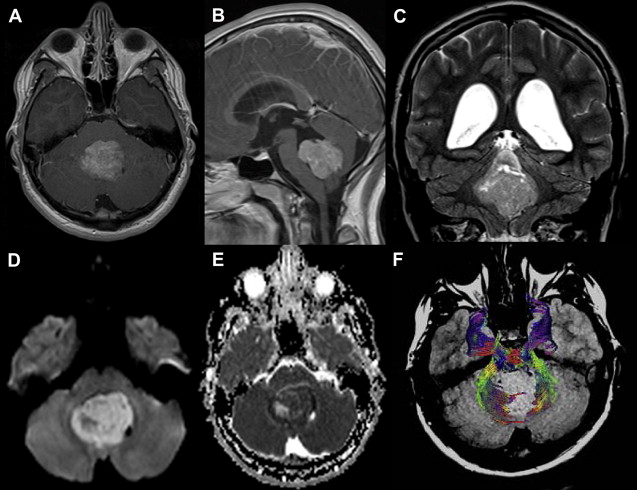
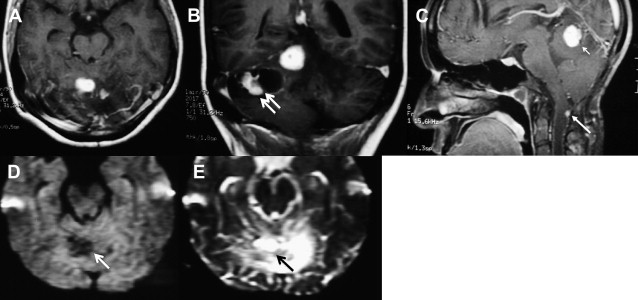
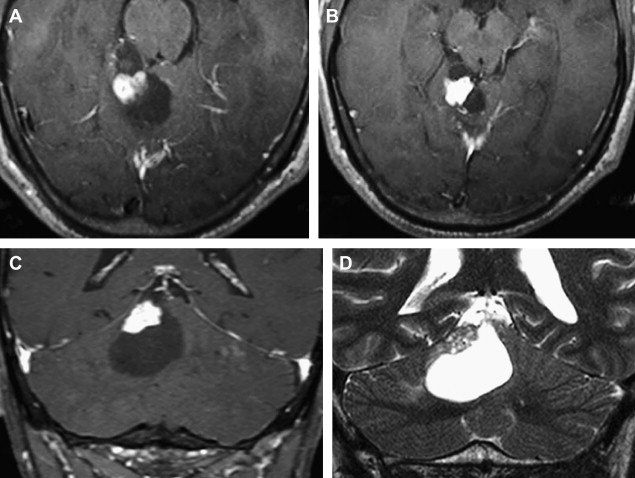
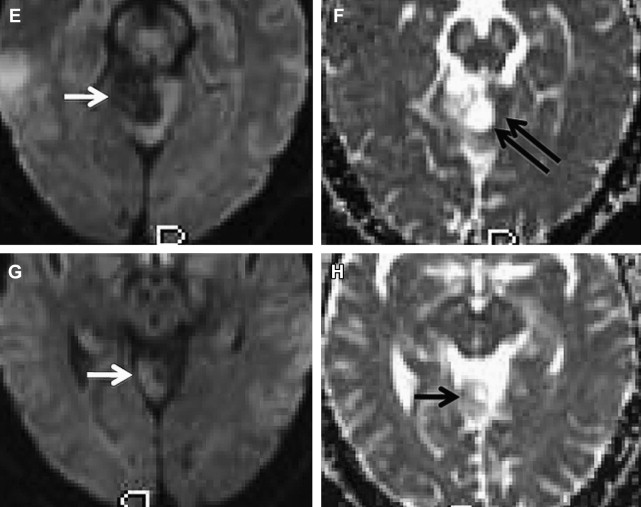
DWI may also be helpful in distinguishing medulloblastoma, which displays a restricted diffusion ( Fig. 10 ) from other pediatric brain tumors, also presumably because of the densely packed tumor cells and high nuclear-to-cytoplasmic ratio. In one report, the solid enhancing portion of cerebellar hemangioblastomas on postcontrast T1-weighted images was, together with other posterior fossa neoplasms, the only one to demonstrate hypointensity on DWI ( Fig. 11 ). The main explanation for the high ADC values in these tumors was suggested to be due to the rich vascular spaces present in hemangioblastomas. Pilocytic astrocytoma usually does not present restricted or facilitated diffusibility. ADC values seem to be similar to the brain parenchyma ADC values ( Fig. 12 ).
DTI has also been used to attempt grading of brain neoplasms and seems to provide some utility by assessment of tumor cellularity. To date, the additional information provided by DTI has not yet been shown to correlate with tumor cellularity, given that a high degree of fiber tract disorganization in the tumor core is thought to be present. Nevertheless, one report has argued that FA can distinguish high-grade gliomas from low-grade gliomas. This study found a significant difference between FA values when only the solid portion of the lesion was analyzed, avoiding the necrotic and cystic portions. The FA values in high-grade gliomas were higher than those in the low-grade gliomas, which was taken to suggest higher symmetry of histologic organization. However, these results are somewhat contradictory to the usual understanding of the microstructure of high-grade gliomas. The histologic characteristics of high-grade gliomas compared with those of low-grade gliomas typically reveal pleomorphologic structures and a regressive organization rather than an increase in parallel histologic organization. A separate report found no differences between low- and high-grade gliomas with regard to FA values in the tumor center. This may be consistent with the disorganization of fiber tracts in the center of both entities, resulting in a loss of structural organization.
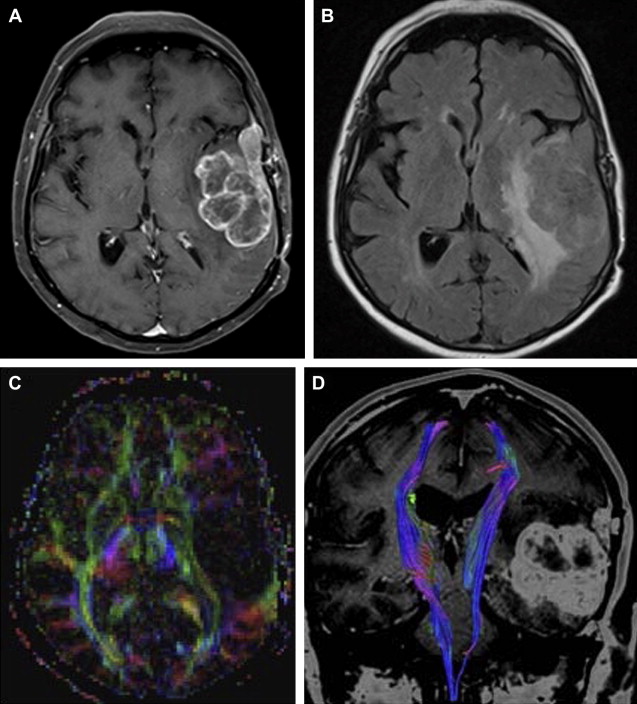
Preoperative Planning and Peritumoral Margins
The goal of a surgical approach to the brain neoplasm is the complete resection of the tumor, coupled with minimum neurologic deficit. Thus, the precise determination of the margins of the tumor is considered to be of the utmost importance to the management of brain tumors. Although a variety of approaches have been used, diffusion imaging has also been enlisted in the attempt to determine the margins of tumors in the brain. It is suggested that DWI can provide information about peritumoral neoplastic cell infiltration, perhaps even help discriminate the boundaries between tumor, infiltrating tumor, peritumoral edema, and normal brain parenchyma. However, not all studies have found DWI to be helpful in the evaluation of tumor extensions, most likely because of the difficulty in finding the borders of some tumors, even on histopathology. Due to the challenges of obtaining a histologic standard of reference (“gold standard”), it is reasonable to question DWI’s ability distinguish neoplastic cell infiltration beyond the enhancing portion of the lesion on the abnormal hyperintense T2-weighted image, which traditionally is thought to represent vasogenic edema with or without tumor invasion.
Some investigators believe that metastases with perilesion edema have higher ADC values than a primary brain tumor with peritumoral edema, and these investigators have suggested that higher ADC values may allow better differentiation between metastases and primary lesions. In high-grade gliomas, the abnormal hyperintense T2-weighted image is thought to represent not only vasogenic edema but also infiltrative neoplasms cells. The normal white matter extracellular space contents a complex matrix, which restricts the free motion of water molecules. Cell infiltration alters the integrity of extracellular matrix, reducing the obstruction for free water molecules to diffuse. However, this logic is somewhat speculative and vasogenic edema with neoplasm cells infiltration may be found in high-grade gliomas; whereas, in cases of meningiomas, metastases and low-grade gliomas vasogenic edema without neoplasm infiltration are seen—both with similar ADC values.
Although the specific biophysics of perilesional edema remains unclear, and ADC alone may not differentiate peritumoral edema with infiltration from peritumoral edema without infiltration, a number of investigators have reported that DTI can detect variations in FA values around lesions. This has led to speculation that these variations may be due to the presence of infiltrative tumor. However, it is not clear if an infiltrating tumor will destroy fibers and, therefore, result in lower FA, or if the tumor infiltrating along the fibers actually increases FA by having more ultrastructure aligned with the fibers. Any significant difference in the FA values of either the enhancing or nonenhancing portion of the two tumoral lesions was previously described, whereas another report has verified that the periphery of low-grade gliomas, without abnormal hyperintense signal on the T2-weighted images, contains a considerable amount of preserved fiber tracts (high FA values), whereas most tracts are disarranged in high-grade gliomas (low FA values). Diffusion-tensor imaging seems to demonstrate that the periphery of low-grade gliomas contains preserved fiber tracts, whereas most tracts are disarranged in high-grade gliomas. However, the presence of edema can obscure fiber tracts that are present.
Patterns of white matter tracts involvement
The involvement of the white matter tracts can often be identified in brain tumor patients by using either FA maps or tractography. Based on DTI findings, resulting from studies of brain tumor patients, the white matter involvement by a tumor can be arranged into five categories :
Displaced: maintained normal or slightly decreased anisotropy relative to the contralateral tract in the corresponding location but situated in an abnormal T2-weighted image signal intensity area or presented in an abnormal orientation ( Figs. 13 and 14 )
Related posts:
 Diffusion Magnetic Resonance Imaging in Multiple Sclerosis
 Diffusion MR Imaging: Basic Principles
 Clinical Applications of Diffusion MR Imaging for Acute Ischemic Stroke
 Diffusion Imaging in Brain Infections
 Diffusion-Weighted Imaging in Neonates
 Diffusion MR Imaging for Monitoring Treatment Response

Stay updated, free articles. Join our Telegram channel

Full access? Get Clinical Tree


