Magnetic resonance (MR) imaging has been used by investigators and clinicians to assess the development of the brain in childhood to understand both patterns of normal growth and patterns by which a maturing brain may deviate from normal. Advanced MR techniques such as diffusion tensor imaging (DTI) have gained prominence as a means of assessing brain development. This review explains the sequence of brain maturation and the means by which DTI can be used to assess it in normal children.
Magnetic resonance (MR) imaging has been used by investigators and clinicians alike to assess the development of the brain in childhood to understand both patterns of normal growth and patterns by which a maturing brain may deviate from normal. Advanced MR techniques such as diffusion tensor imaging (DTI) have gained prominence as a means of assessing brain development. This review explains the sequence of brain maturation and the means by which DTI can be used to assess it in normal children.
Development changes during early brain maturation
Maturation of the white matter (WM) tracts of the brain occurs in an orderly and predictable fashion, beginning during intrauterine development and continuing into early adulthood. This maturation process is governed by several complex processes, including myelination and changes in axonal numbers (including not only increases of numbers of axons in many regions but also decreases in a process termed axonal pruning).
Such changes are delineated in postmortem studies, which have shown that myelination typically occurs in a standard fashion in the prenatal and neonatal brain ( Fig. 1 ). Such fixed-tissue studies have helped identify the microstructural changes (eg, axonal proliferation and the process of myelination), which imaging studies are designed to depict. As a general rule, maturation of the WM occurs in 2 major patterns: (1) beginning within deep central structures and proceeding peripherally and (2) proceeding from posterior structures anteriorly.
Conventional MR imaging assessment
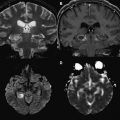
When interpreting MR imaging studies of the newborn infant brain, one often wishes to assess whether WM development is occurring at a normal rate. Conventional MR imaging can allow this assessment of the newborn brain, but only within certain limits. For instance, on a T2-weighted image, the newborn brain appears largely diffusely hyperintense. In general, it is recognized that T1-weighted images are more valuable in determining brain maturation during the first 6 months or so of life; thereafter T2-weighted images seem to be more valuable.
In the newborn, one can reliably attend to only a few specific landmarks (eg, middle cerebellar peduncle and posterior limb of internal capsule) to determine whether age-appropriate development has occurred. In these regions, normal maturation is determined based on whether hyperintense signal has begun to appear in these regions on T1-weighted images by the time of birth. However, assessment of the remainder of the brain is more difficult because such landmarks are generally not present. Similarly, on T2-weighted images of the newborn infant (see Fig. 1 ), some of these same landmark regions appear hypointense relative to the (almost uniformly) hypointense background of WM. However, early in postnatal life, these regions are few in number; most infant brain structures cannot be adequately assessed on conventional MR images because they appear relatively isointense to one another (see Fig. 1 ).
MR signal changes within the developing WM are considered to occur because of several factors. One major factor is change in brain water content. Specifically, the infant brain contains high water content compared with the adult brain. The high water content in early life produces an increase in T1 relaxation time that corresponds to hypointense signal on a T1-weighted image; similarly, the increased water content results in an increased T2 relaxation time and hyperintense signal within WM on T2-weighted images. With the onset of brain maturation (which is manifested by increases in myelination and axonal numbers), the ratio of water to macromolecules decreases, producing an increase in signal intensity on T1-weighted images and a decrease in signal intensity on T2-weighted images (see Fig. 1 ). Other factors influencing this change in appearance include increased numbers of cells and their components (eg, axons, dendrites, cell membranes, and intracellular organelles) and increased amounts of myelin. During this process, major compact WM structures (eg, the corpus callosum) undergo standard and predictable changes in signal intensity, which can serve as milestones that can be used by the radiologist to determine whether brain maturation is proceeding at the expected rate throughout the remainder of the first year of life.
The signal intensity changes in the corpus callosum can serve as an example of this maturational process. At birth, the entire corpus callosum appears relatively isointense with surrounding cerebral WM tracts at birth on both T1-weighted and T2-weighted pulse sequences. At approximately 4 months after birth the splenium and the adjacent posterior body of the corpus callosum begin to appear hyperintense relative to adjacent WM on T1-weighted images. As maturation proceeds from posterior to anterior, the genu of the corpus callosum appears hyperintense relative to nearby WM at approximately 4 to 6 months of life. Similarly, on T2-weighted images, the splenium of the corpus callosum begins to appear hypointense at approximately age 4 to 6 months, and the genu appears hypointense at approximately 5 to 8 months of life. These changes have the advantage of being evident on visual inspection (and hence seen without the need for computational analysis). Nonetheless, they are solely qualitative (as opposed to quantitative) in nature and are subject to substantial interobserver variability. Furthermore, as outlined earlier, the number of regions in which such pronounced changes are seen in the infant brain (which can serve as markers of brain development) are few in number. Hence, the development of quantitative methods that are less observer dependent and which can be applied to the entire WM (such as diffusion imaging and DTI) are expected to be of great value in understanding brain maturation.
Conventional MR imaging assessment
When interpreting MR imaging studies of the newborn infant brain, one often wishes to assess whether WM development is occurring at a normal rate. Conventional MR imaging can allow this assessment of the newborn brain, but only within certain limits. For instance, on a T2-weighted image, the newborn brain appears largely diffusely hyperintense. In general, it is recognized that T1-weighted images are more valuable in determining brain maturation during the first 6 months or so of life; thereafter T2-weighted images seem to be more valuable.
In the newborn, one can reliably attend to only a few specific landmarks (eg, middle cerebellar peduncle and posterior limb of internal capsule) to determine whether age-appropriate development has occurred. In these regions, normal maturation is determined based on whether hyperintense signal has begun to appear in these regions on T1-weighted images by the time of birth. However, assessment of the remainder of the brain is more difficult because such landmarks are generally not present. Similarly, on T2-weighted images of the newborn infant (see Fig. 1 ), some of these same landmark regions appear hypointense relative to the (almost uniformly) hypointense background of WM. However, early in postnatal life, these regions are few in number; most infant brain structures cannot be adequately assessed on conventional MR images because they appear relatively isointense to one another (see Fig. 1 ).
MR signal changes within the developing WM are considered to occur because of several factors. One major factor is change in brain water content. Specifically, the infant brain contains high water content compared with the adult brain. The high water content in early life produces an increase in T1 relaxation time that corresponds to hypointense signal on a T1-weighted image; similarly, the increased water content results in an increased T2 relaxation time and hyperintense signal within WM on T2-weighted images. With the onset of brain maturation (which is manifested by increases in myelination and axonal numbers), the ratio of water to macromolecules decreases, producing an increase in signal intensity on T1-weighted images and a decrease in signal intensity on T2-weighted images (see Fig. 1 ). Other factors influencing this change in appearance include increased numbers of cells and their components (eg, axons, dendrites, cell membranes, and intracellular organelles) and increased amounts of myelin. During this process, major compact WM structures (eg, the corpus callosum) undergo standard and predictable changes in signal intensity, which can serve as milestones that can be used by the radiologist to determine whether brain maturation is proceeding at the expected rate throughout the remainder of the first year of life.
The signal intensity changes in the corpus callosum can serve as an example of this maturational process. At birth, the entire corpus callosum appears relatively isointense with surrounding cerebral WM tracts at birth on both T1-weighted and T2-weighted pulse sequences. At approximately 4 months after birth the splenium and the adjacent posterior body of the corpus callosum begin to appear hyperintense relative to adjacent WM on T1-weighted images. As maturation proceeds from posterior to anterior, the genu of the corpus callosum appears hyperintense relative to nearby WM at approximately 4 to 6 months of life. Similarly, on T2-weighted images, the splenium of the corpus callosum begins to appear hypointense at approximately age 4 to 6 months, and the genu appears hypointense at approximately 5 to 8 months of life. These changes have the advantage of being evident on visual inspection (and hence seen without the need for computational analysis). Nonetheless, they are solely qualitative (as opposed to quantitative) in nature and are subject to substantial interobserver variability. Furthermore, as outlined earlier, the number of regions in which such pronounced changes are seen in the infant brain (which can serve as markers of brain development) are few in number. Hence, the development of quantitative methods that are less observer dependent and which can be applied to the entire WM (such as diffusion imaging and DTI) are expected to be of great value in understanding brain maturation.
Diffusion imaging and DTI
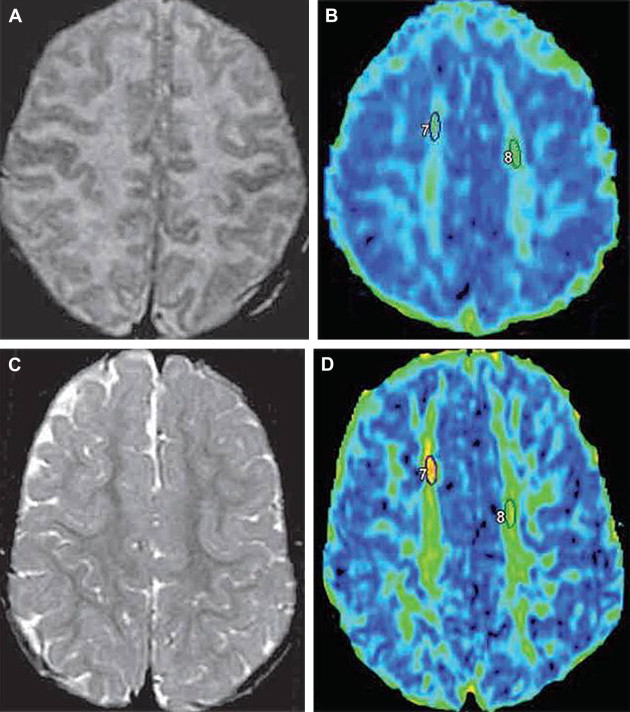
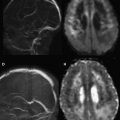
The primary advanced MR imaging techniques used for assessing brain development are diffusion-weighted imaging (DWI) and DTI. DWI is based on application of diffusion gradients in 3 orthogonal directions; this technique allows measurement of rate of water motion, which is needed for measurement of the apparent diffusion coefficient (ADC) value. In many studies, ADC values have been found to be useful as a marker to assess WM maturation.
Whereas DWI typically uses 3 orthogonal diffusion gradient directions, DTI uses diffusion gradients in at least 6 orthogonal directions. This increase in number of encoding gradients allows estimation of the diffusion tensor, which is a mathematical representation of directionality of microscopic water motion within each pixel. Once the diffusion tensor can be estimated, the degree of anisotropy (ie, tendency of microscopic water motion to proceed in a single direction, as opposed to randomly) and the predominant direction of water diffusion can be determined. Such information is typically depicted by means of a fractional anisotropy (FA) map, from which representation of WM pathways can be visualized via a process termed tractography ( Fig. 2 ). DTI has been used successfully to quantitatively evaluate milestones in brain development.
Both DWI and DTI are sensitive to microstructural changes such as increases in cell density and development of myelination. These techniques can show WM changes that are inapparent on conventional MR imaging (discussed later).
Uses of DWI to study normal brain maturation
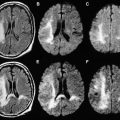
DWI has been used to image the maturing brain. For instance, in 1 study of 30 infants and children between the ages of 1 month and 17 years, the investigators used DWI to study D av (which is a measure of isotropic water diffusion within voxels and is a similar measurement to ADC) in the developing brain. The study found that the average diffusion constant, D av , decreased as age increased. This finding occurred throughout the whole brain, the genu and splenium of the corpus callosum, and the periventricular WM, with D av decreasing fastest during the first 2 years of life. This period of rapid ADC decrease correlates with the known period of rapid water content decrease within brain tissue. Other studies have shown that ADC values decrease over time in various WM regions throughout infancy and childhood and that the correlation of ADC decrease with age is strong, although dependent on the structure studied. For instance, the correlation of ADC decrease with age in 1 study was strongest in the subcortical WM, and the correlation in deep compact WM regions (eg, the posterior limb of internal capsule) was only moderately strong. Whereas the correlation within WM regions was generally good, the correlation was weak in gray matter regions.
Because comparing both ADC values and values obtained from DTI (eg, FA) against a reference standard (eg, histologic determination of degree of myelination) has not been widely performed, the merit of each type of measurements relative to one another is difficult to fully determine.
Related posts:
 Diffusion Magnetic Resonance Imaging in Multiple Sclerosis
 Diffusion Imaging in Traumatic Brain Injury
 Clinical Applications of Diffusion MR Imaging for Acute Ischemic Stroke
 Diffusion Imaging in Brain Infections
 Diffusion-Weighted Imaging in Neonates
 Diffusion MR Imaging for Monitoring Treatment Response
Stay updated, free articles. Join our Telegram channel

Full access? Get Clinical Tree


