Digital Radiographic Image Processing and Manipulation
Objectives
On completion of this chapter, you should be able to:
• Describe the formation of an image histogram.
• Discuss automatic rescaling.
• Compare image latitude in digital imaging with film/screen radiography.
• List the functions of contrast enhancement parameters.
• Describe the effects of improper algorithm application.
• Discuss the purpose and function of image manipulation factors.
Key Terms
Aliasing
Archive query
Automatic rescaling
Contrast manipulation
Critical frequency
Edge enhancement
High-pass filtering
Histogram
Image annotation
Image orientation
Image sampling
Image stitching
Look-up table (LUT)
Low-pass filtering
Manual send
Nyquist theorem
Patient demographics
Shuttering
Smoothing
Spatial frequency resolution
Window level
Window width
Once x-ray photons have been converted into electrical signals, these signals are available for processing and manipulation. This is true for both photostimulable phosphor (PSP) systems and flat-panel detector (FPD) systems, although a reader is used only for PSP systems. Processing parameters and image manipulation controls are also similar for both systems.
Preprocessing takes place in the computer where the algorithms determine the image histogram. Postprocessing is done by the technologist through various user functions. Digital preprocessing methods are vendor specific, so only general information on this topic can be covered here.
PSP Reader Functions
The PSP imaging plate records a wide range of x-ray exposures. If the entire range of exposure were digitized, values at the extremely high and low ends of the exposure range would also be digitized, resulting in low-density resolution. To avoid this, exposure data recognition processes only the optimal density exposure range. The data recognition program searches for anatomy recorded on the imaging plate by finding the collimation edges and then eliminates scatter outside the collimation. Failure of the system to find the collimation edges can result in incorrect data collection, and images may be too bright or too dark. It is equally important to center the anatomy to the center of the imaging plate. This also ensures that the appropriate recorded densities will be located. Failure to center the imaging plate may also result in an image that is too bright or too dark. The data within the collimated area produce a graphic representation of the optimal densities called a histogram (Figure 3-1). The value of each tone is represented (horizontal axis), as is the number of pixels in each tone (vertical axis). Values at the left represent black areas. As tones vary toward the right, they get brighter, with the middle area representing medium tones. The extreme right area represents white. A dark image will show the majority of its data points on the left, and a light image will show the majority of its data points on the right.
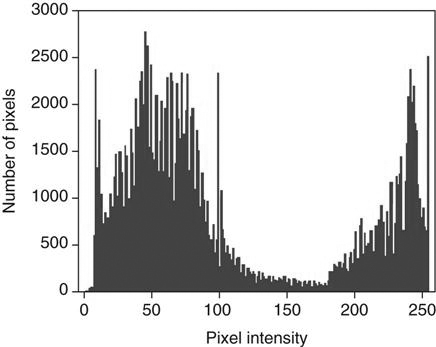
A graphical representation of the number of pixels with a particular intensity.
Because the information within the collimated area is the signal that will be used for image data, this information is the source of the vendor-specific exposure data indicator.
Image Sampling
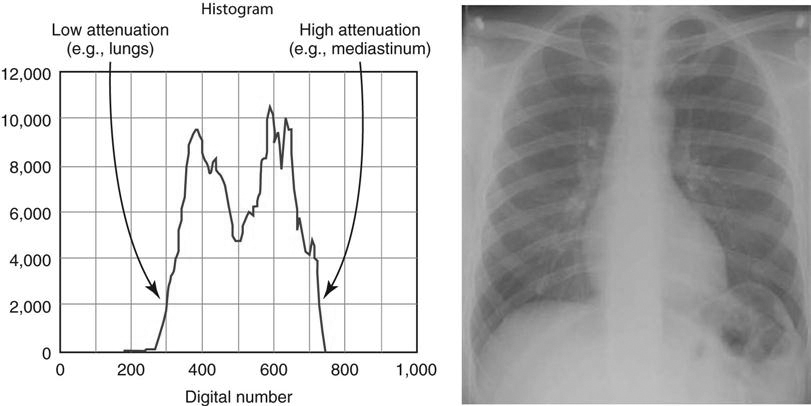
With image sampling, the plate is scanned and the image’s location is determined. The size of the signal is then determined, and a value is placed on each pixel. A histogram is generated from the image data, which allows the system to find the useful signal by locating the minimum (S1) and maximum (S2) signal within the anatomic regions of interest on the image and then plots the intensities of the signal on a histogram. The histogram identifies all intensities on the imaging plate in the form of a graph on which the x-axis is the amount of exposure read, and the y-axis is the number of pixels for each exposure. This graphic representation appears as a pattern of peaks and valleys that varies for each body part. Low energy (low kilovoltage peak [kVp]) gives a wider histogram; high energy (high kVp) gives a narrower histogram. The histogram shows the distribution of pixel values for any given exposure. For example, if pixels have a value of 1, 2, 3, and 4 for a specific exposure, then the histogram shows the frequency (how often they occurred) of each of those values, as well as the actual number of values (how many were recorded).
Analysis of the histogram is very complex. However, it is important to know that the shape of the histogram is anatomy specific, which is to say that it stays fairly constant for each part exposed. For example, the shape of a histogram generated from a chest x-ray on an adult patient will look very different than a knee histogram generated from a pediatric knee examination. This is why it is important to choose the correct anatomic region on the menu before processing the image plate. The raw data used to form the histogram are compared with a “normal” histogram of the same body part by the computer, and the image correction takes place at this time (Figure 3-2).
Digital Radiography Image Sampling
The Nyquist Theorem
In 1928 Harry Nyquist, who was a researcher for AT&T, published the paper “Certain Topics in Telegraph Transmission Theory.” He described a way to convert analog signals into digital signals that would more accurately transmit over telephone lines. He found that since an analog signal was limited to specific high frequencies, it could be captured and transmitted digitally and recreated in analog form on the receiver. He said that the sampling rate would need to be at least twice the highest frequency to be reproduced. In 1948 Claude Shannon presented a mathematical proof of Nyquist’s theory, allowing it to be called the Nyquist theorem. Since that time, a number of scientists have added to and revised the theory. In fact, it could be called the Nyquist–Shannon–Kotelnikov, Whittaker–Shannon–Kotelnikov, Whittaker–Nyquist–Kotelnikov–Shannon (WNKS), etc., sampling theorem, as well as the Cardinal Theorem of Interpolation Theory. It is often referred to simply as the sampling theorem.
The Nyquist theorem states that when sampling a signal (such as the conversion from an analog image to a digital image), the sampling frequency must be greater than twice the frequency of the input signal so that the reconstruction of the original image will be as close to the original signal as possible. In digital imaging, at least twice the number of pixels needed to form the image must be sampled. If too few pixels are sampled, the result will be a lack of resolution. At the same time, there is a point at which oversampling does not result in additional useful information. Once the human eye can no longer perceive an improvement in resolution, there is no need for additional sampling.
The number of conversions that occur in PSP imaging—electrons to light, light to digital information, digital to analog signal—results in loss of detail. Light photons do not travel in one direction, so some light will be lost during the light-to-digital conversion because light photons spread out. Because there is a small distance between the phosphor plate surface and the photosensitive diode of the photomultiplier, some light will spread out there as well, resulting in loss of information. In addition, even though the imaging plate is able to store electrons for an extended period of time, the longer the electrons are stored, the more energy they lose. When the laser stimulates these electrons, some of the lower energy electrons will escape the active layer, but if enough energy was lost, some lower energy electrons will not be stimulated enough to escape and information will be lost. All manufacturers suggest that imaging plates be read as soon as possible to avoid this loss.
Although FPD systems lose fewer signals to light spread than PSP systems, the Nyquist theorem is still applied to ensure that sufficient signal is sampled. Because the sample is preprocessed by the computer immediately, signal loss is minimized but still occurs.
Aliasing


Stay updated, free articles. Join our Telegram channel

Full access? Get Clinical Tree


