ECHOCARDIOGRAPHY
 DOPPLER PRINCIPLES
The concept of color and pulsed Doppler ultrasonography is derived from the Doppler effect, which is based on the apparent variation in frequency of a light or a sound wave as its source approaches or moves away, relative to an observer (1). When an ultrasound wave with a certain transmitted frequency insonates a blood vessel, the reflected frequency or frequency shift is directly proportional to the speed with which the red blood cells are moving (blood flow velocity) within that particular vessel (Fig. 8-1). This frequency shift is also proportional to the cosine of the angle that the ultrasound beam makes with this vessel (the angle of incidence) and to the frequency of the insonating ultrasound wave (see Fig. 8-1). The Doppler frequency shift therefore reflects but does not actually measure the velocity of blood flow.
In spectral Doppler ultrasonography, the frequency spectrum is displayed in a graphic form (Fig. 8-2). In this display, the vertical axis represents the frequency shift, and the horizontal axis represents the temporal change of this frequency shift as it relates to the events of the cardiac cycle (see Fig. 8-2). The frequency shift can therefore be easily measured at any point along the cardiac cycle.
In clinical applications, Doppler velocimetry is mostly used to assess for the downstream resistance to the flow of blood (2). This is based on the concept that the mean flow is proportional to the mean pressure and inversely proportional to the mean downstream resistance (Qm = Pm/Rm). This concept, however, only applies to steady nonpulsatile flow conditions. In a medical setting where flow is pulsatile, vascular impedance rather than vascular resistance describes opposition to flow (3). Downstream resistance is just one component of vascular impedance which is also dependent on the pulse frequency, blood inertia, distensibility of the vessel wall, and wave reflection (3). In a laboratory setting where the ability to measure vascular impedance is present, Doppler indices correlate well with impedance to pulsatile flow, pressure pulsatility, and vascular resistance (4). The frequency shift therefore provides information on the downstream impedance to flow of whichever vascular bed is being studied.
 DOPPLER WAVEFORM QUANTIFICATION
Several Doppler indices are available for waveform quantification (5–7). Doppler indices are ratios of frequency shifts obtained from the same cardiac cycle and are thus independent of the angle of insonation. Figure 8-3 lists the three most commonly used Doppler indices in obstetrics. Although Doppler indices are widely used in the evaluation of the fetal peripheral circulation, Doppler waveform quantification at the cardiac level has mostly relied on measurements of absolute frequencies which, unlike Doppler indices, are angle dependent. In order to obtain accurate Doppler indices in fetal echocardiography, the sample volume is placed distal to the respective valves, the insonating angle should be within 15–20 degrees of the direction of blood flow, Doppler waveforms should be obtained during fetal apnea, and multiple measurements should be made. Obtaining several measurements at different cardiac cycles will also ensure reproducibility of results. Color Doppler is used to direct placement of the sample volume; placing the sample volume at the brightest colors of the blood flow segment will ensure the best measurements. Table 8-1 lists the optimum approach to Doppler echocardiography. The following is a list of waveform measurements that are commonly used in Doppler echocardiography:
Peak velocity: The maximum velocity on the Doppler spectrum (cm/sec) (Fig. 8-4).
Time-to-peak velocity (TPV): The time from onset to peak velocity (msec), also referred to as acceleration time (see Fig. 8-4).
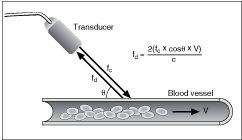
Figure 8-1. Doppler effect in ultrasonography. When an ultrasound wave insonates a blood vessel, the frequency shift of the reflected ultrasound wave (fd) is directly proportional to the frequency of the insonating ultrasound wave (fc); the velocity of blood flow within the vessel (V); the cosine of the angle that the ultrasound beam makes with this vessel (theta); and inversely proportional to a constant (C), which reflects the milieu that the ultrasound beam is traversing.
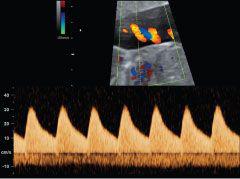
Figure 8-2. Spectral Doppler ultrasonography of the umbilical artery. The vertical axis represents the frequency shift (velocity scale) (cm/sec) and the horizontal axis represents time. In this spectrum, the temporal change of the frequency shift is displayed as it relates to the events of the cardiac cycle.
Related posts:
Stay updated, free articles. Join our Telegram channel

Full access? Get Clinical Tree


