Figure. 3.1
Illustration of the Doppler shift . When a moving target reflects a sound, the frequency of the reflected sound wave is altered. The frequency is shifted up by an approaching target and shifted down by a receding target. The amount the frequency is shifted is proportional to the velocity of the moving object
Ultrasound utilization of the Doppler shift falls into three main categories. Analysis of the Doppler frequency spectrum allows for calculation of velocity, pulsatility index, and resistive index and is primarily used in vascular studies. Color-flow Doppler and power Doppler superimpose a color image representing motion onto a B-mode image to illustrate location and degree of motion (blood flow).
In thyroid applications, Doppler imaging is used predominantly to assess the vascularity of tissues. The role of Doppler ultrasound in thyroid imaging has recently experienced a significant change. The prior belief that power Doppler imaging plays an important role in the prediction of the likelihood of malignancy in a thyroid nodule has undergone a reassessment and will be discussed in detail. Other applications of Doppler imaging include helping to determine the etiology of hyperthyroidism, assessing the etiology or subtype of amiodarone-induced thyrotoxicosis or thyroiditis, and clarifying images.
Analysis of the Doppler spectrum allows for determination of flow velocity and calculation of resistance to flow. By analyzing the waveform, the peak systolic and diastolic velocities can be calculated. Resistive index (RI) and pulsatility index (PI) can be calculated using the formulas below but are typically calculated directly by the ultrasound machine. While these values are more often used in studies of peripheral vascular disease, the peak flow velocity and resistive index are also used to provide a reproducible quantification in reporting the degree of vascularity of thyroid tissue.
Resistive Index = (systolic velocity − diastolic velocity)/systolic velocity |
Pulsatility Index = (systolic velocity − diastolic velocity)/mean velocity |
For most thyroid imaging, color-flow Doppler and power Doppler are utilized. In color-flow Doppler, a unique color (or brightness) is assigned to an individual frequency. Typically a greater frequency shift (corresponding to a higher velocity) is assigned a brighter color. Analysis of the color-flow image gives a graphic illustration of the direction and speed of blood flow within soft tissue. In contrast, power Doppler considers all frequency shifts to be equivalent, integrating the total amount of motion detected. The assigned color represents the total amount of flow present, independent of the speed and direction of flow. The color image therefore is indicative of the total amount of flow present, without information regarding velocity (Figs. 3.2 and 3.3).
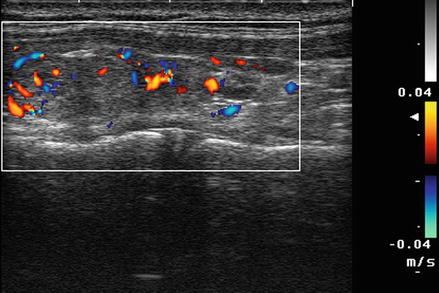
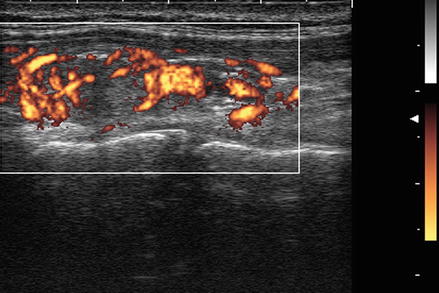
Figure. 3.2
Color Doppler . In color-flow Doppler a unique color (or brightness) is assigned to an individual frequency. Typically a greater frequency shift (corresponding to a higher velocity) is assigned a brighter color. Analysis of the color-flow image gives a graphic illustration of the direction and speed of blood flow within soft tissue
Figure. 3.3
Power Doppler . In contrast, power Doppler considers all frequency shifts to be equivalent, integrating the total amount of motion detected. The assigned color represents the total amount of flow present, independent of the velocity. Power Doppler has increased sensitivity for the detection of low degrees of flow, has less noise interference, and is less dependent on the angle of incidence between the ultrasound waves and the moving object
Color-flow Doppler provides information regarding both direction and speed and is more useful in vascular studies. In contrast, power Doppler does not provide information regarding velocity. However, it provides increased sensitivity for the detection of low degrees of flow, has less noise interference, and is less dependent on the angle of incidence between the ultrasound waves and the moving object. Power Doppler is generally the preferred imaging technique for assessing the vascularity of thyroid tissue [1].
Doppler Analysis of Thyroid Nodules for the Assessment of Probability of Malignancy
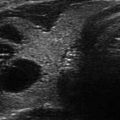
Figure 3.4 shows a follicular carcinoma in the inferior pole of the thyroid, with a very high degree of blood flow. The inferior thyroid artery can be seen feeding the nodule. In contrast, Fig. 3.5 shows a nodule with no significant intranodular vascularity, with only scattered blood vessels around the periphery. This nodule was a benign follicular adenoma.
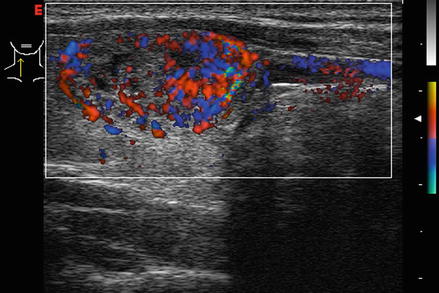
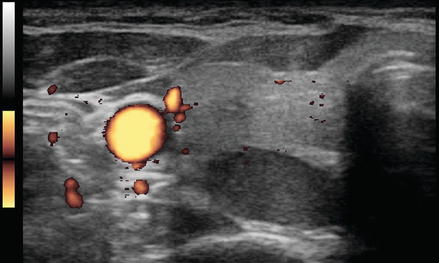
Figure. 3.4
Vascular nodule . A follicular carcinoma is present in the inferior pole of the thyroid, with a very high degree of blood flow. The inferior thyroid artery can be seen feeding the nodule
Figure. 3.5
Avascular nodule . This benign follicular adenoma has no intranodular blood flow
The assessment of whether Doppler plays a role in the determination of malignant potential of a nodule has undergone a major change over the last decade. In 2002 Papini et al. reported on 494 consecutive patients with nonpalpable nodules measuring 8–15 mm. All patients had a Doppler ultrasound study performed prior to fine-needle aspiration biopsy. An intranodular vascular pattern was observed in 74% of all nodules with thyroid cancer. Eighty-seven percent of the cancers were solid and hypoechoic, and 77% of the cancers had irregular or blurred margins. Only 29% of the cancers had microcalcifications. Independent risk factors for malignancy included irregular margins (RR = 16.8), intranodular Doppler blood flow (RR = 14.3), and microcalcifications (RR = 5) [2].
In 2002 Berni et al. analyzed 108 patients with thyroid nodules demonstrated to be hypofunctioning on nuclear medicine study. All of the patients had subsequent surgical excision of the nodule. Half of the patients were found to have malignancy, so this clearly was not a random population. Of the 108 patients, 92 would have been correctly diagnosed based on their color Doppler pattern. There were six false-negative cancers with no blood flow and ten false-positive benign lesions with significant intranodular flow. The calculated sensitivity was 88.8%, and the specificity was 81.5%. The positive predictive value of blood flow was 83%, and the negative predictive value was 88% [3]. The following year Frates et al. demonstrated a 42% rate of malignancy in solid hypervascular nodules, compared to 14% in solid nonhypervascular nodules [4]. In 2006 Appetecchia and Solivetti reported that the addition of Doppler pattern to conventional gray-scale ultrasound modestly improved sensitivity and specificity from 75 and 71.9% to 83.3 and 75.4% [5].
More recently, in 2010 Moon et al. reported a retrospective review of Doppler images of 1083 nodules (with 269 malignancies) in 1024 patients and determined that vascularity was not associated with malignancy [6]. Vascularity was classified as none, peripheral, and intranodular. Vascularity was present in 31% of the benign nodules and only 17% of papillary cancers. Absent vascularity was more common in malignant nodules (60%) than in benign nodules (43%). It is not clear why such disparate results were seen in the Moon study when compared to the earlier studies. It is possible that it relates to a very high number of (small) papillary cancers in the Moon series (>97% classic papillary cancers). Moon suggests that prior studies may have suffered from selection bias, analyzing only hypoechoic, cold nodules, or nodules only >1 cm. In contrast, Moon included nodules regardless of size, echogenicity, or results of radioisotope scan [6]. It has been suggested that a pattern of central versus peripheral vascularity may be more predictive of malignancy, but this was not considered in the Moon series [7, 8]. Similarly, in a recent study of over 1500 nodules measuring larger than 1 cm, Rosario et al. found no additional predictive value for adding Doppler ultrasound to gray-scale ultrasound in assessing the benign or malignant nature of thyroid nodules [9].
Several studies have investigated whether quantifying the degree of vascularity using spectral Doppler analysis would help predict the probability of malignancy in thyroid nodules. Bakhshaee et al. concluded that Doppler US parameters of resistive index (RI), pulsatility index (PI), and the vascular pattern of malignant versus benign nodules show significant overlap. He concluded that malignant nodules could not be distinguished reliably from benign nodules on the basis of Doppler US characteristics including RI, PI, or the vascular pattern [10]. Algin et al. measured RI and PI and reported that central, peripheral, and mean resistive and pulsatility index values were significantly higher in malignant nodules according to spectral Doppler measurements. However, the overall predictive values were poor, with substantial overlap of all values [11].
Several studies have attempted to improve the predictive value of Doppler imaging by utilizing ultrasonographic contrast material. Ma et al. reported that contrast-enhanced Doppler images added predictive value to gray-scale parameters but found that color Doppler ultrasound without contrast had no predictive value [12]. Similarly, in a preliminary study, Zhang et al. determined that peripheral ring enhancement was more predictive of benign lesions (PPV 94%), whereas heterogeneous internal enhancement was associated with malignancy (PPV 92.5%) [13]. Both of these studies were relatively small, and further investigations of the value of contrast-enhanced Doppler are warranted. Future studies will need to explore the cost benefit ratio and practicality of contrast administration. In addition, currently ultrasound contrast agents are not approved for thyroid imaging in the United States.
The prior 2009 ATA and 2010 AACE/AME guidelines for the management of thyroid nodules considered intranodular vascularity to be a risk factor for cancer [14, 15]. However, guidelines published by the Korean Society of Radiology eliminated vascularity as a risk factor, initially in 2011 and again in the revised guidelines published in 2016 [16]. The 2015 American Thyroid Association guidelines no longer integrate nodule vascularity in the assessment of the probability of malignancy in thyroid nodules [17]. The revised AACE/AME guidelines published in 2016 similarly removed vascularity as a risk factor for papillary carcinoma but maintained vascularity as a concerning feature for follicular nodules [18].
Doppler Analysis of Nodules with Follicular Cytology
Doppler ultrasound may play a role in prediction of malignancy in nodules with microfollicular (Bethesda 4) cytology, but this remains controversial [16]. Fukunari et al. studied 310 patients with a solitary thyroid nodule in which a prior fine-needle aspiration biopsy had demonstrated a follicular lesion. All patients underwent a color Doppler flow-mapping study prior to surgery. The amount of flow in the nodule was classified on a four-point scale. Grade 1 nodules had no flow detectable. Grade 2 nodules had only peripheral flow, without intranodular flow. Grade 3 nodules had low-velocity central flow, and grade 4 nodules had high-intensity central flow (Figs. 3.6, 3.7, 3.8, 3.9, and 3.10). For purposes of statistical analysis, the absence of intranodular flow (grade 1–2) was considered a negative result, and the presence of central flow (grade 3–4) was considered a positive result. Of 177 benign adenomatous nodules, 95% were grade 1 or 2, and only 5% were grade 3. No benign adenomatous nodules had grade 4 blood flow. Of 89 benign follicular adenomas, 66% showed grade 1 or 2 Doppler flow, and 34% showed grade 3 or 4 flow. Of the 44 follicular carcinomas diagnosed, none showed grade 1 Doppler flow, 13.6% showed grade 2 flow, and 86.4% showed either grade 3 or 4 flow [19].
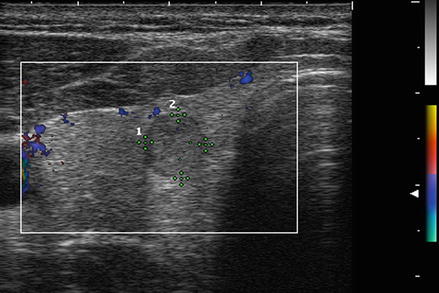
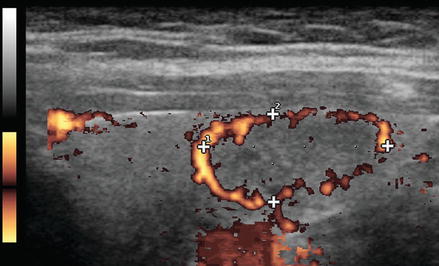
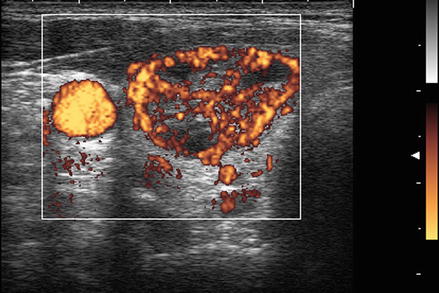
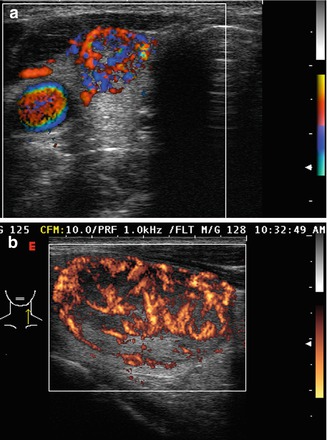
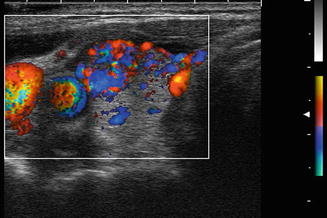
Figure. 3.6
Grade 1 Doppler flow. Grade 1 lesions have no intranodular flow and no flow to the periphery
Figure. 3.7
Grade 2 Doppler flow. Grade 2 lesions have peripheral flow only, without intranodular flow
Figure. 3.8
Grade 3 Doppler flow. Great 3 lesions have low to moderate velocity central flow. The pattern illustrated here, with peripheral vascularity greater than central, is often felt to be of lower suspicion for malignancy
Figure. 3.9
Grade 4 Doppler flow. Grade 4 lesions have high-intensity central blood flow. (a) Illustrates color Doppler imaging and (b) shows power Doppler imaging
Figure. 3.10
Grade 4 Doppler flow in a benign nodule. While intranodular vascularity was previously felt to reflect an increased risk of malignancy, more recent data suggests no relationship between vascularity and the risk of papillary carcinoma. Note the similarity of this image of a benign nodule to the malignant nodule shown in Fig. 3.9a
Using the data of Fukunari, the sensitivity of intranodular blood flow in predicting malignancy in a microfollicular nodule was 86%. The specificity was 85%, and the diagnostic accuracy was 81%. The prevalence of cancer in this group of follicular nodules was 14% [19].
In a similar analysis, De Nicola et al. studied 86 patients in whom nodules had prior follicular biopsies. The flow pattern was characterized on a scale from 0 to 4, with 0 defined as no visible flow, 1 as peripheral flow only, 2 as peripheral flow with a small amount of central flow, 3 as peripheral flow plus extensive intranodular flow, and 4 as central flow only. Patterns 0–2 were grouped as negative results, and nodules with pattern 3–4 were considered positive. Of 59 nonneoplastic nodules, 93% were grade 0–2, and only 7% were grade 3. No nonneoplastic nodules had grade 4 blood flow. Of 14 benign follicular adenomas, 71% showed grade 0–2 Doppler flow, and 29% showed grade 3 or 4 flow. Of the 10 carcinomas, 20% showed grade 0–2 Doppler flow, and 80% showed grade 3 or 4 flow. Based on this analysis, sensitivity was 80% and the specificity was 89% [20].
Applying Bayes’ theorem to the data of Fukunari and De Nicola suggests that follicular nodules with no intranodular flow have only a 3% probability of malignancy rather than the generally accepted 15–20% likelihood in unselected follicular nodules. Conversely, vascular nodules with a prior microfollicular biopsy have a probability of malignancy approaching 50% [21, 22].
Miyakawa et al. compared the vascular pattern and spectral parameters between patients with follicular adenoma and follicular carcinoma. Eighty percent of the carcinoma patients showed a moderate increase in intranodular vascularity, whereas 84% of adenoma patients showed only a peripheral rim of vascularity (sensitivity 87.5%, specificity 92%). Use of spectral parameters increased sensitivity slightly to 90% and decreased specificity slightly to 89% [23].
Conversely other studies have failed to show Doppler imaging to be useful in predicting malignancy in nodules with follicular biopsy. While Choi et al. found a statistically significant higher incidence of peripheral color flow present in benign nodules compared to malignant nodules (37.1 vs. 22.2%) and internal central vascularity in malignant nodules (77.8 vs. 62.9%) (p = 0.03), the clinical applicability of this finding is limited [24]. Trimboli et al. studied 93 patients with prior cytology indicating follicular neoplasm and found a low value for color-flow Doppler in predicting malignancy in biopsy proven follicular neoplasms. Of 15 nodules with follicular cancer, eight demonstrated no internal vascularity and seven had internal vascularity. However, of the 78 benign nodules, 37 had internal flow, and 41 showed no internal flow. Thus there was no predictive value to the Doppler analysis [25].
If vascularity is considered a risk factor for malignancy in follicular nodules but not in papillary cancer, how is the clinician to use the Doppler information? Doppler imaging may be irrelevant in a deeply hypoechoic nodule with microcalcifications and infiltrative margins (suspicious for papillary carcinoma) but may remain relevant in an ovoid, isoechoic nodule with a variable thickness peripheral halo (suspicious for a follicular lesion).
In summary, the absence of flow in a nodule with a prior follicular biopsy makes malignancy much less likely, and conversely significant intranodular flow increases the risk of malignancy. The power Doppler flow pattern should be interpreted along with other ultrasonographic characteristics including echogenecity, edge definition, and calcifications, as well as clinical features such as nodule size, age, and sex of the patient to help in the decision regarding the need for biopsy, and the need for, and extent of surgery.
Doppler Ultrasound of Amiodarone-Induced Thyrotoxicosis
Amiodarone may cause thyroid dysfunction in 15–20% of treated patients. Doppler ultrasound has been shown to help in the differentiation of the etiology of amiodarone-induced thyrotoxicosis. Type 1 amiodarone thyrotoxicosis resembles Graves’ disease. It typically occurs in patients with preexisting thyroid autoimmunity. The gland is hyperthyroid, overproducing thyroid hormone. It may respond to treatment with thionomides and perchlorate. (Perchlorate is not available currently in the United States.) Typically type 1 amiodarone-induced thyrotoxicosis is associated with normal or increased vascularity on Doppler ultrasound. Type 2 amiodarone-induced thyrotoxicosis more closely resembles painless thyroiditis. In this entity, inflammation and destruction of thyroid tissue results in the release of preformed thyroid hormone. It may respond to glucocorticoid therapy and typically does not respond to thionomides or perchlorate. Typically type 2 amiodarone thyrotoxicosis is associated with absent or a very low degree of vascularity on power Doppler analysis [26, 27]. An elevated serum interleukin-6 level has been described as indicative of type 2 amiodarone thyrotoxicosis, but its predictive value is poor [28].
Related posts:

Stay updated, free articles. Join our Telegram channel

Full access? Get Clinical Tree


