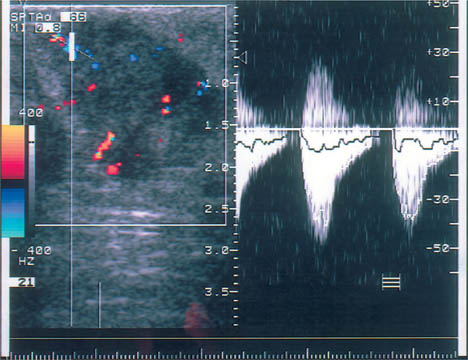
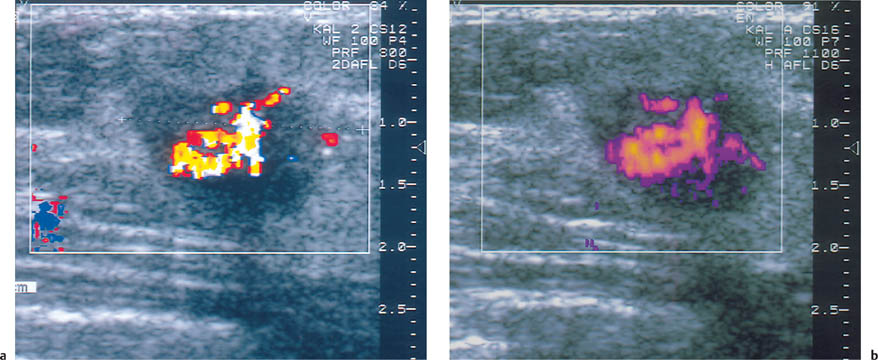
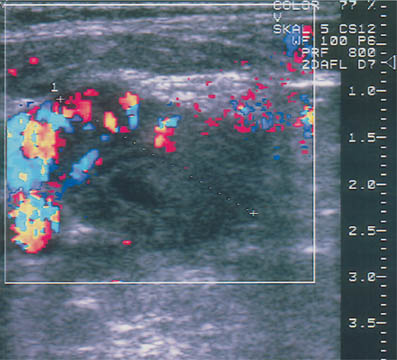
19 Doppler Ultrasound The vascularization of malignant tumors is a phenomenon well known from pathologic, biochemical, and angiographic studies, and we know that the degree of neovascularization correlates with the biologic behavior of the tumor. Thermography, once widely used as an adjunct to clinical examination, can detect the change in surface temperature associated with the focal increase in blood flow to a breast malignancy. However, it has been discredited as a screening method for breast cancer because of its low sensitivity, poor specificity (inflammatory processes as well as cancer are associated with local heat), and lack of precise anatomic localization (Williams et al., 1990). Contrast-enhanced MRI is also based on angiogenesis in malignant tumors as well as other factors such as membrane permeability. For many cancers, but certainly not all, there is an intense rapid rise followed by signal washout after the administration of a paramagnetic contrast agent, most commonly a gadolinium chelate such as gadopentate dimeglumine. The measurement of tumor blood flow is more applicable to lesion characterization than to screening. But there are anatomic situations that hamper evaluation of the breast tissue, and there are tumors that do not display typical diagnostic features, and the measurement of tissue blood flow can be helpful in evaluating problem cases of this kind. It should be understood, however, that the measurement of tumor blood flow is a nonspecific assessment that cannot differentiate lesions with absolute confidence. The degree of blood flow correlates with tissue metabolism. Thus, while fast-growing malignancies generally have a copious blood supply, blood flow is also increased in proliferative benign tumors, in pregnancy and lactation, and in inflammatory conditions. Doppler ultrasound has been used for more than 20 years to analyze blood flow in breast tumors. Initially only continuous-wave (CW) Doppler systems were available. These devices are very sensitive, but they require an experienced user and it is difficult to examine nonpalpable lesions. Pulsed Doppler systems became popular in the early 1980 s, as they allow for selective flow sampling in vessels that are located by ultrasound imaging. Tumor vessels are very small, however, and usually cannot be visualized in the B-mode image. It is tedious to move the Doppler sample volume through the image while searching the tumor and its surroundings for blood vessels. Also, most of the older duplex scanners used a low frequency and were relatively insensitive in detecting tumor vessels. As a result, duplex scanning did not find significant applications in tumor diagnosis. Color flow imaging paved the way for the use of Doppler ultra-sound in tumor diagnosis. The first instruments had poor sensitivity. By the 1990 s, however, color Doppler technology had advanced sufficiently to permit the effective localization of tumor vessels (Fig. 19.1). This was achieved through the use of higher Doppler frequencies and improved signal processing. The recording of Doppler spectra was also improved and provides additional information on tumor blood flow (Fig. 19.2). Nevertheless, color Doppler demonstrates only a portion of the vessels. This is due to the limited sensitivity of Doppler in detecting microscopically small vessels and the dependence of the Doppler principle on the beam–vessel angle. Vessels that are perpendicular to the beam direction are poorly detected. Blood flowing in the direction of the beam results in a higher frequency shift and a better recorded signal. Fig. 19.1 Color Doppler image of invasive ductal carcinoma. The greatest vascular density is found at the periphery of the tumor. Note the predominantly radial pattern of vessels converging on the tumor. The high sensitivity setting, with a PRF of 800 Hz, often leads to aliasing in the vessels due to the high flow velocities. This must be tolerated, since increasing the PRF would decrease Doppler sensitivity and reduce the number of detectable vessels. Fig. 19.2 Color Doppler and duplex sonography for the measurement of blood flow. Again, most vessels are found at the tumor periphery. The Doppler spectrum shows a high systolic blood flow velocity (37.9 cm/s) and an absence of flow in diastole (RI = 1.0). This high resistance pattern is typical of breast carcinoma. Breast carcinomas often have a firm consistency, exerting a pressure that collapses the blood vessels within the tumor. As a result, only peripheral vessels can be seen in most cases and the flow resistance is high. To improve the visualization of small vessels and avoid the problem of insonation angle, a different method of signal processing was developed. This technique, called power Doppler, does not register the angle-dependent frequency shift but the intensity (amplitude) of the reflected signals, which depends on volume flow. As a result, the course of tumor vessels is more clearly visualized (Fig. 19.3 a, b). This technique is susceptible to artifacts, however, and much experience is needed to interpret the images correctly. Another disadvantage is that, for the present, power Doppler imaging yields nonquantitative information. The image is interpreted subjectively, and there are no objective parameters that can be used for tumor differentiation. For these reasons, color Doppler is still preferred. It is easily combined with duplex technology for concomitant flow imaging and flowmetry. However, this requires a sensitive instrument with optimum settings. Given the range of variation among different instruments, standardization is difficult to achieve. In our previous studies at the University of Freiburg, we used the ATL UM9 HDI (Philips Medical Systems, Bothell, WA) color flow imager with a 10–5-MHz linear-array transducer. We used a 50–100 Hz filter and a pulse repetition frequency (PRF) of 800–1000 Hz. The power and gain were set as high as possible, that is, just below the noise level. Doppler ultrasound is used to investigate focal abnormalities rather than to scan the entire breast. Given the variability of tumor blood flow, all vessels should be sampled for the quantitation of flow. Because vessels often are not visualized within malignant tumors, particular attention should be given to feeding vessels that enter the periphery of the mass. With just enough pressure to maintain contact, the transducer should be placed lightly on the breast to avoid vascular compression. Before any vessels are sampled, various insonation angles should be tested to obtain an optimum Doppler signal. First a slow scan through the tumor is done in the color Doppler mode so that all the vessels can be located and counted. Then the examination is completed by analyzing flow signals in the duplex mode. Usually the course of the vessels can be seen, and so the probe angle can be adjusted to ensure an accurate measurement of flow velocity. Duplex analysis should include the determination of maximum systolic velocity (S) and end-diastolic velocity (D). This provides information on total blood flow and makes it possible to calculate indices from the Doppler spectra. The most important index to be determined is usually the resistance index (RI) or the AB ratio: RI = (S – D)/S AB ratio =S/D The pulsatility index (PI) is less frequently determined because it requires fitting an envelope curve to the Doppler spectrum. This is time-consuming and fraught with potential errors. Our comparative measurements have shown, moreover, that this index correlates closely with the RI and the AB ratio. Flow velocity analysis provides a basis for various calculations. For example, the vessel with the highest-velocity flow can be used for tumor differentiation. It is also possible to calculate the mean value for all the flow velocities measured in a particular tumor. Because carcinomas are supplied by many small, low-flow vessels in addition to a few large vessels, the mean velocity may be low despite a high total blood flow. A better way to assess total blood flow is to add together all the flow velocities measured in the tumor. It would be simpler and more accurate to use a computer to extract the total blood flow from the color Doppler data. Fig. 19.3 a, b Color Doppler and power Doppler images of a solid cellular carcinoma. The relatively soft consistency of this tumor accounts for the central vascular density. a Branching vessels can be identified in the color Doppler image. b The course of the vessel is seen somewhat more clearly in the power Doppler image, but individual vascular branches are not defined. Malignant tumors are associated with an increased number of blood vessels (Fig. 19.1, Table 19.1), which converge on the tumor and enter it in a radial pattern. Often, however, only vessels at the tumor periphery are visualized while vessels inside the tumor are collapsed as a result of the very firm consistency of most carcinomas. Although the vessels in malignancies often communicate through shunts and do not have a muscular coat, the hard tumor consistency leads to a high flow resistance (Fig. 19.2). Even so, the flow velocities in most tumor vessels are increased but are highly variable. The same applies to the Doppler spectra that are sampled from the vessels.
Clinical Principles
Historical Development
Examination Technique
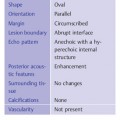
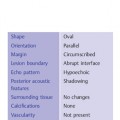
Interpretive Criteria