Fig. 31.1
Schematic of relationship of attenuation of iodine (y-axis) to photon energy (x-axis). Note peak in attenuation that occurs at 33.2 keV, the k-edge of iodine. The k-edge of iodine is just above the k-shell binding energy of the element. Dual energy CT is typically performed at 80 and 140 kVp (Circle)
The k-edge varies for each element and increases with atomic number (Table 31.1). Imagine a mixture of two elements. In the laboratory setting, it is possible to compute the percentage that each element contributes to the mixture by imaging at two energies near the k-edges of each element and using post-processing techniques.
Table 31.1
Atomic number and K-edges for organic elements and elements used in contrast material
Substance | Atomic number (Z) | K-edge (keV) |
|---|---|---|
Hydrogen | 1 | 0.01 |
Carbon | 6 | 0.28 |
Nitrogen | 7 | 0.40 |
Oxygen | 8 | 0.53 |
Calcium | 20 | 4.00 |
Iodine | 53 | 33.2 |
Barium | 56 | 37.45 |
Gadolinium | 64 | 50.20 |
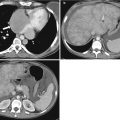
Translating this concept to the human body is somewhat challenging as the primary elemental constituents of the human body (carbon, nitrogen, oxygen, and hydrogen) have such similar k-edges that they cannot be distinguished with current dual-energy techniques. However, the k-edge of iodine is sufficiently different from the above-listed organic elements that it can be distinguished at CT [3, 10]. Similarly, the k-edge of calcium is sufficiently different from the other organic elements that it can also be distinguished. Note Fig. 31.2 in which two high-attenuating areas are visible in the spleen at arterial phase imaging. These two structures remain visible in the virtual noncontrast images generated using dual-energy techniques indicating that they are calcified granulomas rather than arterially enhancing lesions.
To perform this material decomposition, data sets are acquired at two energies (usually 80 and 140 kVp). Using complex equations and post-processing techniques, data sets such as iodine only and virtual unenhanced images are created (Fig. 31.3). Three-material decomposition is used to reconstruct iodine only and virtual noncontrast images from dual-source dual-energy CT images [6]. Three-material decomposition is used to determine, the iodine content of every voxel [6]. For the liver, the three main components are fat, soft tissue, and iodine [6]. An algorithm assigns a ratio of fat and soft tissue to a given voxel, and CT numbers from the two energies are used to compute the iodine content [6].
Generating a calculated unenhanced data set that perfectly replicates an acquired true unenhanced data set is challenging. For example, variables including organ-specific enhancement and patient body habitus can impact attenuation. Accounting for variables such as organ-specific enhancement and patient body habitus has been shown to improve the accuracy of algorithms used to create virtual noncontrast data sets [11].
A related concept exploited with dual-energy imaging is the idea that iodine-containing structures are more attenuating at lower as compared to higher energies. Refer back to Fig. 31.1 and note how the attenuation of iodine-containing structures increases with decreasing kVp as kVp approaches the k-edge of iodine. This concept is illustrated in Fig. 31.4 where the attenuation of iodine-containing structures is seen to be greater in the lower energy (80 kVp) as compared to the higher-energy (140 kVp) data set.
Dual-energy CT applications in the abdomen take advantage of both the ability to perform material decomposition and the relatively increased attenuation of iodine at lower as compared to higher kVp (Fig. 31.5). Specific applications of dual-energy CT in the abdomen are presented below.
Implementation of dual-energy CT varies by vendor, and options range from a software upgrade to hardware designed specifically for dual-energy imaging. With a dual-energy software upgrade, the CT gantry rotates around the patient two full times, once at each energy [12]. Since images are not acquired simultaneously at both energies, there may be temporal misregistration of the two data sets which can compromise post-processing.
Dual-energy hardware varies by vendor, and different platform options include a dual-source scanner with dual detector arrays, a single-source scanner with fast kilovoltage switching, and a single-source scanner with dual detector layers. The dual-source scanner with dual detector array system (Somatom Definition and Definition FLASH, Siemens Healthcare) consists of two separate tube and detector pairs [12, 13]. One pair acquires the low-energy data set and the other pair acquires the high-energy data set [12, 13]. These data sets are acquired simultaneously [12, 13]. The high-energy tube detector pair is physically separated from the low-energy tube pair by 90° [12]. A limitation of this technology is that one tube detector pair has a smaller field of view (26 cm in first-generation machine and 33 cm in second-generation machine) [13]. When using such equipment, it is important to position the patient such that the area of interest is included within the field of view of both tube detector pairs. Without attention to this detail, lateral renal masses, for example, may be excluded from the smaller field of view.
A different hardware implementation of dual-energy technology includes a single source capable of rapidly switching between low and high energy during a single rotation around the patient (Discovery CT705HD, GE Healthcare) [12, 13]. An additional different hardware implementation of dual-energy technology includes a sandwich-type detector with different layers of the detector capable of detecting lower and higher energies [12, 13]. To date, limited literature is available comparing the impact of these different platforms on clinical imaging.
Fig. 31.2
Material decomposition. Initial arterial phase post-contrast image (a) demonstrates two small areas of increased attenuation in the splenic parenchyma (arrows). Differential possibilities would include calcified granulomas versus perfusional abnormalities. The two structures are visible in the virtual noncontrast image (b) indicating that they are tiny calcified granulomas
Fig. 31.3
Typical workflow for dual-energy CT. Images are acquired at 80 and 140 kVp. These source images are sent to the image interpretation station along with iodine overlay and virtual noncontrast images generated using dual-energy techniques. The smaller field of view of the lower-energy data set is a relic from the technology’s cardiac imaging origins
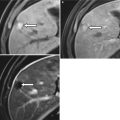
Fig. 31.4
Increased attenuation of structures at lower kVp. Images acquired at (a) 140 kVp and 98 mA and (b) 80 kVp and 549 mA. Attenuation values of various structures at 140 kVp and 80 kVp are reported in panel (c). Patient had also previously received intravenous contrast material for a different study, hence contrast material in the renal collecting systems bilaterally
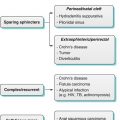
Fig. 31.5
Applications of dual-energy CT in the abdomen include material decomposition and low kVp imaging
Adrenal
Incidentally discovered adrenal nodules occur in up to 32 % of patients in autopsy studies [14] and in up to 7 % of patients at CT [15]. Statistically, the majority of these nodules are nonfunctioning, benign adrenal adenomas [14]. Various criteria including attenuation <10 HU at CT [16], percent of washout at delayed enhanced CT [16], and signal loss at out-of-phase imaging at MR [17] are diagnostic of an adrenal adenoma.
However, not uncommonly, adrenal nodules are encountered at portal venous phase contrast-enhanced CT that measure more than 10 HU in attenuation. Definitive characterization with imaging would require additional studies such as an adrenal protocol CT with noncontrast and washout images or MR with in- and out-of-phase imaging.
The ability to obtain virtual noncontrast images generated using dual-energy techniques has the potential to reduce the number of callbacks for additional imaging. Figure 31.6 demonstrates a right adrenal nodule that measured 34 HU at portal venous phase CT and was therefore indeterminate. However, in the virtual noncontrast data set, the nodule measured 1 HU which indicates that the nodule is most likely an adenoma.
Figure 31.7 demonstrates a left adrenal nodule that measured 38 HU at portal venous phase CT and was therefore also indeterminate. In virtual noncontrast images generated using dual-energy techniques, the nodule measured 3 HU, and in true noncontrast images, the nodule measured 4 HU which is diagnostic of an adrenal adenoma.
That virtual noncontrast images generated using dual-energy techniques are reasonably accurate in the diagnosis of adrenal adenomas has been reported in two recent studies. Ho et al. compared adrenal nodule attenuation values in true unenhanced images and calculated unenhanced images generated using dual-energy techniques [18]. Using a cutoff of <10 HU as diagnostic of an adenoma, diagnostic agreement regarding whether a nodule measured ≤10 HU on both the true and virtual unenhanced images ranged from 83 to 91 % for the three readers in the study. Diagnostic discrepancies involved lipid poor adenomas, and no adenomas were misdiagnosed as metastases or vice versa.
Gnannt et al. found that the accuracy of virtual unenhanced images for characterizing adrenal masses as probably benign was 78–86 % with true unenhanced images used as the reference standard [19]. Between the two readers, there were 5/102 discordant diagnoses where a nodule measured <10 HU in the virtual noncontrast data set but measured >10 HU in the true noncontrast data set. Concordance between the virtual unenhanced and true unenhanced data sets was better for nodules >1 cm.
These studies suggest that virtual noncontrast images generated using dual-energy techniques are a promising tool for the characterization of adrenal masses. However, further improvements in post-processing algorithms are needed before virtual noncontrast images can replace true noncontrast images in this particular clinical scenario.
Fig. 31.6
A 72-year-old man with right adrenal nodule (arrows). Nodule measures 34 HU in the initial portal venous phase CT (a). In the virtual noncontrast image from a dual-energy CT (b), the nodule measures 1 HU which is suggestive of an adrenal adenoma
Fig. 31.7
A 66-year-old male with 1.8 cm left adrenal nodule (arrows). Nodule measures 38 HU at portal venous phase CT (a) and is therefore indeterminate. Nodule measures 3 HU on a virtual unenhanced image (b) generated using dual-energy techniques and 4 HU on a true unenhanced data set (c) compatible with an adenoma
Kidney
Renal Masses
Renal masses that measure greater than fluid in attenuation (20 HU, [20]) at contrast enhanced CT are a common occurrence. It has been estimated that more than half of adults >50 years of age will have at least one renal mass at imaging [21]. Without noncontrast images to evaluate for mass enhancement, differential possibilities would include a hemorrhagic or proteinaceous cyst or a solid mass. Patients with such masses are frequently recommended to return for additional imaging such as a renal mass protocol CT with pre- and post-contrast images or MRI.
The ability to generate accurate virtual noncontrast images from a contrast-enhanced dual-energy data set would allow for the accurate assessment of mass enhancement, thereby potentially eliminating the need to obtain additional imaging to better characterize an incidentally discovered renal mass.
Two recent studies have shown that using virtual noncontrast images and iodine overlay images generated using dual-energy techniques was 93–95 % accurate in characterizing renal masses as benign or malignant [22, 23]. In one study, the average weight of patients with discordant lesions (in other words, lesions that were mischaracterized as enhancing or nonenhancing based on dual-energy techniques) was greater than the average weight of patients with concordant renal masses [23]. This finding suggests that the current post-processing algorithms used to perform material decomposition and generate calculated virtual unenhanced data sets may be compromised in larger patients.
Figure 31.8 demonstrates a renal cyst characterized as such at both true unenhanced imaging and virtual unenhanced imaging. Figure 31.9 illustrates limitations of using virtual noncontrast images generated using dual-energy techniques to characterize renal masses.
In conclusion, as of this writing, the published literature suggests that dual-energy techniques are approximately 90–95 % accurate in characterizing renal masses as enhancing or nonenhancing. A limitation of dual-energy techniques at this point is the fact that calculated unenhanced images are not identical to acquired true unenhanced images in all patients. It is expected that continued improvements in post-processing algorithms used to generate virtual unenhanced images will ultimately lead to accurate calculated unenhanced images in all patients and eliminate the need for callbacks for repeat multiphase imaging.
Fig. 31.8
A 72-year-old man with right renal cyst (arrows). Right renal cyst measures 7 HU post contrast (a), 4 HU in the virtual noncontrast data set (b), and 3 HU in the true noncontrast data set (c). The patient also has an aorto biliac stent graft
Fig. 31.9


Limitations of dual-energy CT in characterizing renal lesions due in part to imperfections in current virtual noncontrast data sets. A 75-year-old female with lesion upper pole right kidney. The lesion appears to enhance when post-contrast images at 140 kVp (a) and 80 kVp (b) are compared to a virtual noncontrast image (c). However, the lesion does not appear to enhance when its attenuation value in a true noncontrast image (d) is compared to attenuation values in corticomedullary phase (e) and excretory phase images (f)
Related posts:
Stay updated, free articles. Join our Telegram channel
Full access? Get Clinical Tree
