Chapter 10
Dynamic Imaging
Fluoroscopy
After completing this chapter, the reader will be able to perform the following:
1. Define all the key terms in this chapter.
2. State all the important relationships in this chapter.
3. Differentiate between fluoroscopic and radiographic imaging.
4. Recognize the unique features of an image-intensified fluoroscopic unit and explain how the image is created and viewed.
5. Explain the process of brightness gain and conversion factor during image intensification.
6. Define automatic brightness control and state its function.
7. Explain how using the magnification mode affects image quality and patient exposure.
8. Identify common types of image degradation resulting from image-intensified fluoroscopy.
9. Differentiate among the types of television cameras used to convert the output phosphor image for viewing on a television monitor.
10. List the types of recording devices available for image-intensified fluoroscopy.
11. Compare and contrast features of image-intensified units from digital fluoroscopic units.
12. State radiation safety procedures used to reduce exposure to the patient and personnel.
13. Recognize the need for quality control on fluoroscopic units.
Fluoroscopy
Image Intensification
Image intensification (Figure 10-1) is the process in which the exit radiation from the anatomic area of interest interacts with the input phosphor (a light-emitting material, such as cesium iodide), for conversion to visible light. The light intensities are equal to the intensities of the exit radiation and are converted to electrons by a photocathode (photoemission). The electrons are focused by electrostatic focusing lenses and accelerated toward an anode to strike the output phosphor (coated with light-emitting crystals, such as zinc cadmium sulfide) and create a brighter image.
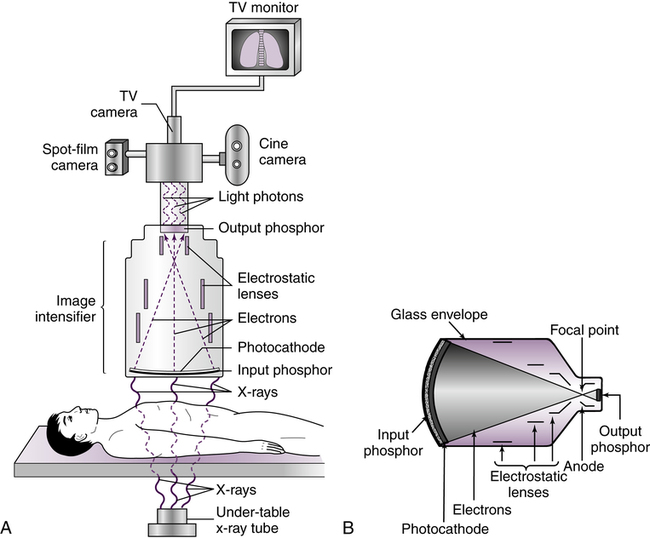
 Important Relationship
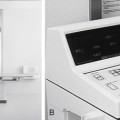
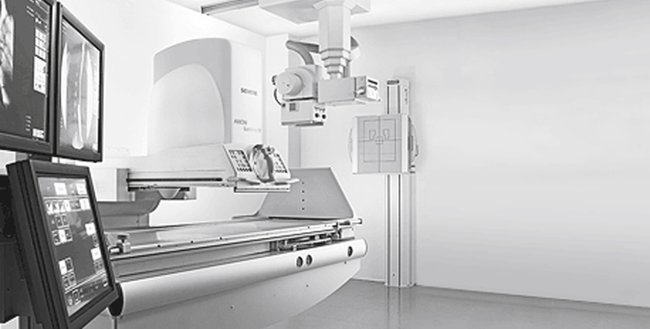
The image light intensities from the output phosphor are converted to an electronic video signal and sent to a television monitor for viewing. Figure 10-2 is an example of a typical radiographic and image-intensified fluoroscopic unit. Additional filming devices such as spot film or cine (movie film) can be attached to the fluoroscopic system to create permanent radiographic images of specific areas of interest.
Brightness Gain
 Important Relationship
Although the term brightness gain continues to be used, it is now common practice to express this increase in brightness with the term conversion factorConversion factor is an expression of the luminance at the output phosphor divided by the input exposure rate, and its unit of measure is the candela per square meter per milliroentgen per second (cd/m2/mR/s). The numeric conversion factor value is roughly equal to 1% of the brightness gain value. For example, a brightness gain of 20,000 would have a conversion factor of 200. The higher the conversion factor or brightness gain value, the greater the efficiency of the image intensifier. See Box 10-1 for brightness gain and conversion factor formulas.


Magnification Mode
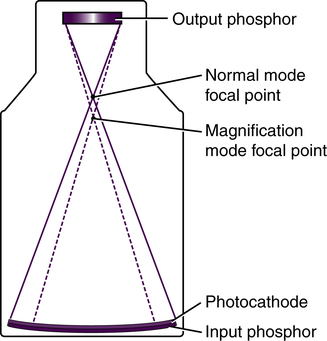
Another function of some image intensifiers is multifield mode or magnification mode. Most image intensifiers in use today have this capability. When operated in magnification mode, the voltage to the electrostatic focusing lenses is increased. This increase tightens the diameter of the electron stream, and the focal point is shifted farther from the output phosphor (Figure 10-3). The effect is that only the electrons from the center area of the input phosphor interact with the output phosphor and contribute to the image, giving the appearance of magnification. For example, a 30/23/15–cm trifocus image intensifier can be operated in any of those three modes. When operated in the 23-cm mode, only the electrons from the center 23 cm of the input phosphor interact with the output phosphor; the electrons about the periphery miss and do not contribute to the image. The same is true of the 15-cm mode. Selecting magnification mode automatically adjusts x-ray beam collimation to match the displayed tissue image and avoids irradiating tissue that does not appear in the image. The degree of magnification (magnification factor [MF]) may be found by dividing the full-size input diameter by the selected input diameter. For example: MF = 30 ÷ 15 = 2× magnification.
 Important Relationship
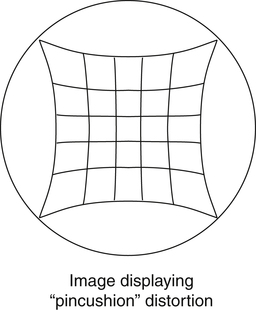
Distortion is also an issue with image-intensified fluoroscopy. In radiography, distortion is a misrepresentation of the true size or shape of an object. In the case of fluoroscopy, shape distortion can be a problem. In fluoroscopy, distortion is a result of inaccurate control or focusing of the electrons released at the periphery of the photocathode and the curved shape of the photocathode. The combined result is an unequal magnification (distortion) of the image, creating what is called a “pincushion appearance” (Figure 10-4). This problem also causes a loss of brightness around the periphery of the image, which is referred to as vignetting.
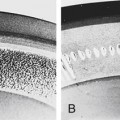
One last factor to consider with image intensifiers is noise. Image noise results when insufficient information is present to create the image. In the case of fluoroscopy, this lack of image-forming information ultimately goes back to an insufficient quantity of x-rays. If too few x-rays exit the patient and expose the input phosphor, not enough light is produced, which decreases the number of electrons released by the photocathode to interact with the output phosphor. A “grainy” or “noisy” image results (Figure 10-5). Although other factors in the fluoroscopic chain may contribute to noise, the solution generally comes back to increasing the mA (quantity of radiation). See Box 10-2 for common quality control tests specific to fluoroscopic equipment.
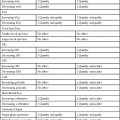
BOX 10-2 Fluoroscopic Equipment Inspection Checklist
| Inspect: | Ensure that: |
| Bucky slot cover | When the Bucky is parked at the foot of the table, the metal cover should expand and cover the entire opening. |
| Protective curtain | The curtain should be in good condition and move freely into place when the tower is moved to the operating position. |