Directed interactions
Freq/time domain
Multi/bivariate
Linear
Sensitive to field spread
Amplitude envelope correlation
–
f
b
+
+
Coherence
–
f
b
+
+
Cross-correlation function
+
t
b
+
+
Cross-frequency interactions
–
f
b
–
+
Directed transfer function
+
t
m
+
+
Dynamic causal modelling
+
t/f
m
–
+
Granger causality
+
t/f
b
+
+
Imaginary part of coherency
+
f
m
–
–
Mutual information
–
t/f
b
–
+
Partial directed coherence
+
f
m
+
+
Phase lag index
+
f
b
–
–
Phase locking value
–
f
b
–
+
Phase slope index
+
f
b
–
–
Synchronization likelihood
+
t
b
–
–
Transfer entropy
+
t/f
b
–
–
2.1 Connectivity Measures can be Grouped Along Different Dimensions
It may be useful to group the different connectivity measures along several different dimensions. One key distinction which is often made is that of functional versus effective connectivity (Friston 1994). Measures of functional connectivity (undirected interaction measures) quantify statistical dependencies between neuronal signals, without explicitly addressing directed interactions. On the other hand, measures of effective connectivity (or directed interaction measures) quantify the directed influence of one neuronal system over another. This distinction has its implications for the interpretation of the analysis results. Per definition, undirected interaction measures do not allow for an interpretation of causality.
Another important distinction is that between time and frequency domain measures of connectivity. This directly refers to the underlying physiological mechanisms by means of which neuronal interactions are thought to occur. One view, which has gained a lot of interest in the past few decades, is that neural interactions are reflected in changes in the synchronization of rhythmic activity between brain regions (Fries 2005). In light of this proposed mechanism of interaction, it makes sense to use connectivity measures that are defined in the frequency domain, and where an estimate of the phase difference is used to compute the connectivity.
Yet another distinction pertains to whether the connectivity measure is a bivariate or a multivariate one. Although typically connectivity measures are estimated between pairs of signals, some measures account for the influence of ‘third party signals’ on the connection under consideration, yielding a potentially clearer interpretation of the interaction being direct or indirect (e.g. due to common input from a third source of activity).
Some connectivity measures assume the interaction between signals to be linear and/or use linear estimation techniques. Other measures don’t rely on these assumptions. This constrains the interpretation of the estimated connectivity results. Also, in general non-linear measures are often based on estimates of probability distributions and require more computing time, and also more data to be computed reliably.
Finally, in the context of MEG, it is crucial to consider whether the connectivity measure is sensitive to the effects of electromagnetic field spread. This will be outlined and discussed in more detail in Sect. 3.
2.2 Frequency Domain Measures of Undirected Interactions
Amplitude envelope correlation refers to the correlation coefficient between amplitude envelope time courses, which are typically computed on bandpass-filtered data, and as such this measure classifies as a frequency domain connectivity measure.
Coherence (Gross et al. 2001) is the frequency domain analogue of the cross-correlation coefficient, and is usually computed using non-parametric spectral estimation techniques, such as the Fourier transform, or a wavelet transform. As such coherence confounds the estimated consistency of a fixed phase difference with the correlation of the signals’ amplitudes. It’s a very popular measure, because it’s easy to compute and it has a straightforward interpretation in terms of frequency-resolved linear predictions.
Amplitude effects can be disentangled from the consistency of the phase difference by means of the phase locking value (PLV). This measure can be obtained by normalising the complex-valued frequency domain single trial values with respect to their amplitudes, prior to estimating the interaction between the signals (Lachaux et al. 1999). This phase synchronisation analysis has been used in source connectivity analysis to complement traditional coherence analysis (Jerbi et al. 2007). Both coherence and PLV are symmetric measures and do not allow direct inference about directionality of information flow between areas. However, time delays can be estimated from the slope of the cross-spectral densities between time series under favourable conditions (Nolte et al. 2008).
Recent years have seen an increased interest in cross–frequency interactions, inspired by the notion that neuronal signals typically show rhythmic activity in several distinct frequency bands, and that neuronal interactions thus may also be reflected in statistical dependencies between these frequency bands (Jensen and Colgin 2007). Several types of interactions can be considered here, e.g. amplitude-amplitude coupling (where there is a correlation across observations of the amplitude envelopes of different frequency bands) or phase-amplitude coupling (where the phase of a slow oscillation systematically modulates the amplitude of a fast oscillation).
2.3 Measures of Directed Interactions
Directed interactions can be inferred in one of the following conceptually different ways. The simplest concept is based on estimating the time lag between events occurring in a pair of signals (Nolte et al. 2008; Gross et al. 2000). This is linked to the principle that a cause must precede its effect, but it should be noted that temporal precedence does not provide direct evidence for causal interactions (Atukeren 2008). In the time domain, the cross correlation function can be used to estimate time lags between signals. However, this technique is hardly used in MEG-research. It is more common to explore the time lag in the frequency domain, where one can exploit the principle that a fixed time delay translates into linearly increasing phase differences with increasing frequency. Hence, the slope of the phase difference spectrum is a direct estimate of this time-delay. The phase slope index (Nolte et al. 2008; Haufe et al. 2013) is a measure that is based on this principle. The phase lag index (PLI) (Stam et al. 2007) quantifies the deviation of the phase difference distribution from 0, thus allowing for the inference of one signal leading (or lagging) the other.
Related to the concept of temporal precedence is the concept of Wiener–Granger causality (Bressler and Seth 2011), which is based on the prediction of a signal (let’s call this signal A for the time being) based on the past values of itself, and based on the past values of another signal (signal B). If the quality of the prediction of signal A is substantially improved when past values of B are taken into account, signal B is said to cause signal A. This principle has been originally formulated by Wiener (1956), and is operationalized in the measure of Granger causality (Granger 1969). Granger causality in its original formulation is defined in the time domain. It is usually implemented by means of fitting a series of multivariate autoregressive models (MVAR-models) (Schloegl et al. 2006) and by exploring the residuals of the model fit. Based on work by Geweke, frequency-resolved Granger causality can also be computed, and from the Fourier transform of the autoregressive model coefficients a series of related measures can be derived such as the directed transfer function (DTF) (Kaminski and Liang 2005) and partial directed coherence (PDC) (Baccala and Sameshima 2001). Common to these measures is that they assume that the interaction is linear. Transfer entropy (TE Schreiber (2000)) is an implementation of Wiener’s principle of causality that is free of an explicit model of the signals and their interaction. A non-linear formulation of Granger causality also exists (Marinazzo et al. 2011).
Finally, rather than using a data-driven approach, one can try and create generative model of the measured data, where the model entails not only the activation patterns of the underlying neural sources, but also their interactions. This approach is implemented in Dynamic Causal Modelling (DCM) (Moran et al. 2007; Kiebel et al. 2008; David and Friston 2003). The generative model specifies how input activates a system of pre-specified interconnected neuronal populations, leading to the measured signal. As such DCM provides an estimate of coupling parameters and source parameters in a single step (Kiebel et al. 2008). DCM had originally been devised for the analysis of evoked responses (Garrido et al. 2007). Recent developments have extended the functionality of this promising technique to induced responses (Chen et al. 2008), steady state responses (Moran et al. 2007) and phase-coupling (Penny et al. 2009).
3 MEG Sensor Level Connectivity Analysis
A central issue in the interpretation of MEG data is the problem of electromagnetic field spread. Although it is a well-known problem and described elsewhere (Winter et al. 2007), it merits discussion in the context of connectivity analysis because it severely confounds many connectivity measures and therefore complicates the correct interpretation of the results. In the following sections we will outline this problem in the context of connectivity analysis, and describe two strategies, which attempt to diminish this problem: the analysis of experimental contrasts, and the use of connectivity measures that are less sensitive to electromagnetic field spread.
3.1 Electromagnetic Field Spread
Field spread refers to the phenomenon that the magnetic fields that are associated with electrical currents (of neural and non-neural origin) are not confined to the vicinity of the current generators, but are measurable far away from their source. For any neuronal source this leads to a widespread representation at the level of the sensor array. As a matter of fact, thanks to this feature, it is possible in the first place to measure MEG extracranially and to build models of the underlying neural sources. Yet, electromagnetic field spread also has important consequences for the interpretability of connectivity measures estimated between pairs or sensors. The reason for this is that any single source of neural (or non-neural) electric activity is visible to many sensors at once. This is illustrated by Fig. 1a. The spatial topography shows the correlation between one channel and the rest, from simulated data containing one single dipole plus uncorrelated sensor noise. Obviously, MEG sensor recordings represent the superposition of the activity of multiple sources, which are either or not functionally connected. Also with multiple sources present, even if the underlying sources are ‘unconnected’, many connectivity measures estimated between pairs of sensors will yield spurious estimates due to the instantaneous mixing process. To illustrate this we simulated the activity of 821 temporally uncorrelated dipoles, with an orientation parallel to the axis between the nasion and the midpoint of the interauricular line, and that were randomly distributed on the cortical sheet. Clearly, the orientations chosen are physiologically not meaningful, but are appropriate to demonstrate the effect of field spread on connectivity analysis. Using FieldTrip (Oostenveld et al. 2011), we simulated 50 s of data for a 275-channel CTF axial gradiometer system, by using a single shell volume conductor model (Nolte 2003) and uncorrelated sensor noise. Figure 1b shows the absolute value of the correlation coefficient between all MEG sensor pairs as a function of their distance. Even though the underlying source activities are temporally uncorrelated, many sensor pairs show high values of correlation.
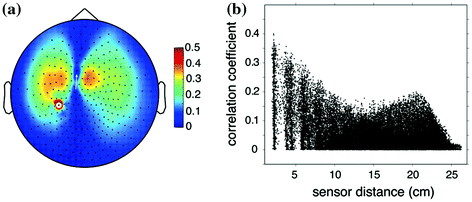

Fig. 1
The effects of field spread confound sensor level estimates of connectivity measures. a Sensor-level connectivity between a seed sensor and the rest of the sensor array in the presence of a single underlying source. b The absolute value of the correlation coefficient between all pairs of measured signals as a function of sensor distance, where the underlying 821 sources were uncorrelated
3.2 Addressing Electromagnetic Field Spread with Statistics
In order to reduce the interpretational difficulties caused by field spread, one potential strategy could be to analyze changes in connectivity caused by an experimental manipulation, rather than the strength of the connectivity as such. The rationale for using experimental contrasts in this context is based on the assumption that the effects of electromagnetic field spread are identical across the experimental conditions and therefore subtract out. Unfortunately, the spatial structure of field spread is highly dependent on changes in the signals, and on changes in the noise. As a consequence, estimated modulations in connectivity do not necessarily always reflect modulations in actual connectivity between relevant neuronal sources. Experimental manipulations will most likely always lead to changes in activity of the underlying sources, or in the activation of different sources. Also, in studies that involve the comparison between different groups of subjects (e.g. patients versus controls), it is not unlikely that difference in the distribution and activity of the underlying sources exist. These potential confounds in the interpretation of estimated differences in connectivity should therefore always be taken into account. This is illustrated in Fig. 2. Here, we simulated two dipoles oscillating at 20 Hz in left and right ‘motor cortex’, at a phase difference of 90°, against a background of 821 uncorrelated dipoles evenly distributed across the cortical sheet. We generated 2 conditions of data where the amplitude of the motor cortex dipoles was twice as large in condition 1 compared to condition 2 (Fig. 2a). We computed coherence and the imaginary part of coherency (see Sect. 3.3) across all channel pairs and display the sensor pairs in which the difference in connectivity across the conditions exceeded a certain threshold. Clearly there is interesting spatial structure in the differential coherence and imaginary coherency maps, that cannot be accounted for by a change in actual connectivity (which as a matter of fact in both conditions was simulated to be equal to 1).
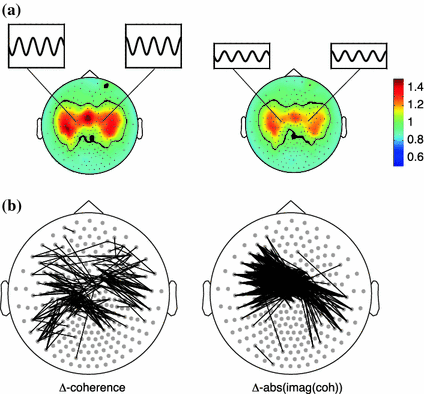

Fig. 2
Changes in source strength yield widespread changes in sensor-level connectivity. a spatial topography of simulated activity with 821 randomly distributed, uncorrelated dipoles, and 2 strong, highly correlated dipoles in approximately left and right motor regions. The amplitude of the ‘motor’ sources is two times higher in the left panel than in the right panel. b Thresholded differential connectivity patterns (high amplitude condition minus low amplitude condition), where each line represents a sensor pair where the differential connectivity exceeded a threshold of 0.2. Two different connectivity metrices were used: coherence (left panel) and the imaginary part of coherency (right panel)
For the reasons outlined above, field spread is problematic in the interpretation of sensor-level connectivity estimates, and an important motivation to perform the connectivity analysis at the source level. Also, contrasting connectivity between two experimental conditions in sensor space will likely reduce (but not abolish) negative effects of field spread (Schoffelen and Gross 2009). In addition to this, there are other important motivations to perform the analysis on the source level. First of all, there is a more direct indication of the anatomical location of the interacting brain regions. Secondly, source level analysis facilitates subsequent group analysis because the data can be averaged in a meaningful standardized space.
3.3 Addressing Electromagnetic Field Spread with Clever Measures of Connectivity
Another strategy to address interpretation problems associated with electromagnetic field spread is to use connectivity measures that are insensitive to this effect. In general, this type of measure can be divided into two categories. The first category consists of measures that are derived from conventional linear measures. The imaginary part of coherency (Nolte et al. 2004) is a well-known example of this type of measure. Another example is amplitude-envelope correlation with the zero time-lag correlation removed (Hipp et al. 2012) (see Sect. 5). The other category consists of measures that are derived from the non-linear dynamics framework. This type of measure includes the phase lag index (Stam et al. 2007) synchronization likelihood (Stam and Van Dijk 2002) and transfer entropy (Vicente et al. 2011).
Measures that are insensitive to field spread usually exploit the fact that field spread caused by point sources has an instantaneous effect on the sensors. In other words, field spread causes cross-correlation effects between sensors at a time lag of 0 ms, or equivalently at a phase difference of 0 or 180°. Explicitly removing the zero ms time lag contribution to the estimate of connectivity reduces the risk of falsely interpreting the estimate as true interaction. In the case of the imaginary part of coherency the removal of the 0° phase difference contribution is achieved by projection of the vector representation of the complex-valued coherency onto the imaginary axis.
An important caveat needs to be raised here, which is related to the fact that spurious connectivity is addressed only when contributing sources can be modeled as single point sources (equivalent current dipoles). This is illustrated in Fig. 3 where we present results of an analysis of the weighted phase lag index (WPLI) at 10 Hz (Vinck et al. 2011). For each channel, we computed the average WPLI between that channel and the rest of the channels and represented this in a spatial topography (panel A). Red here means that the underlying channels on average have a positive phase difference with the other channels, blue means that the underlying channels on average have a negative phase difference with the other channels. Thus the picture suggests a fronto-occipital gradient of time-lagged neural oscillations at 10 Hz, where the frontal channels ‘lead’ the occipital channels. However, the data that was used to generate this topography was constructed by back-projecting two independent components that were estimated from a few minutes of resting state MEG data. The time course of these components and their corresponding spatial topographies are shown in panel B. Clearly, these two components mainly represent cardiac activity. The slight time lag between the individual components in combination with the different topographies leads to a non-trivial mixing with significant interaction at non-zero time lag.
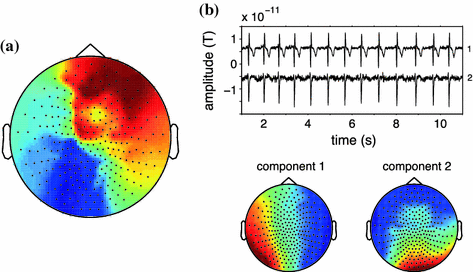

Fig. 3
Sources that cannot be described as a single equivalent dipole yield non-zero phase-lagged connectivity estimates. a Spatial topography displaying for each sensor the average of the weighted-phase lag index between that sensor, and the rest of the sensor-array, yielding a distinct pattern of ‘information flow’ from frontal to posterior sensors. b Fragment of the time courses and spatial topographies of the independent components underlying the data that was used to generate the topography in panel (a)
For the reasons outlined above it is increasingly acknowledged that the functional interactions should be studied at the level of the neuronal sources.
4 MEG Source Level Connectivity Analysis
Stay updated, free articles. Join our Telegram channel

Full access? Get Clinical Tree


