Magnetic resonance imaging (MRI) is a relatively rarely used modality in the emergency department, most often applied to acute neurologic conditions such as stroke and spinal cord injury. MRI offers outstanding soft-tissue contrast and can be used to evaluate acute musculoskeletal complaints when other imaging modalities do not provide the diagnosis. Most musculoskeletal MRI can be deferred to the outpatient setting, but certain high-risk musculoskeletal complaints may warrant emergent imaging. In this chapter, we review basic principles and technical features of MRI relevant to its emergency department use, exploring its potential benefits and limitations. We discuss the cost and time required for MRI, which are significant barriers to its emergency department use. We examine the scientific evidence for the diagnostic accuracy of MRI, comparing the performance of MRI to other imaging modalities, including computed tomography (CT) and nuclear medicine. We review the role of MRI in the diagnosis of occult hip and scaphoid fractures and spinal epidural abscess, which remain clinically challenging. Because of the expense and limited availability of MRI, we review alternative imaging strategies when MRI cannot be readily performed. Finally, we discuss the role of gadolinium contrast agents and the risks associated with their use, and we consider contraindications to MRI.
Emergency Department Utilization of Magnetic Resonance Imaging
MRI availability in emergency departments is limited, with poor night and weekend access even in large academic medical centers. Rankey et al. described routine availability of MRI at a single academic center as 7 am to 11 pm Monday through Friday and 7 am to 3 pm Saturdays, with no routine MRI availability on Sundays or holidays. In their study, only 15.5% of emergency department MRIs were performed “after hours,” a disproportionately small number given that the after-hours period represented more than 47% of the hours in a week. A survey of radiologists found that MRI scanners are physically present in only 3% of U.S. emergency departments, though they may be available in other areas of the hospital. National data on emergency department MRI utilization rates is lacking, but a retrospective review of emergency department utilization at a single tertiary care academic center from 2000 to 2005 showed a 390% increase. Most of this increase was the result of MRI and magnetic resonance angiography (MRA) examinations of the head and spine, which constituted 98% of all MRI examinations. For lumbar spine MRI, suspected osteomyelitis or discitis was one of the top five indications, accounting for 6.4% of lumbar spine examinations. Lower extremity MRI was performed only 23 times during the study period, constituting 1% of total examinations. Dominguez et al. found that 11% of patients with suspected hip fracture and negative x-rays of the hip underwent hip MRI as part of their emergency department evaluation at the Mayo Clinic (Phoenix, Arizona).
Costs of Musculoskeletal Magnetic Resonance Imaging
The cost of emergency MRI varies considerably, depending on the hospital charge, radiologist fee, and negotiated fees through insurance carriers. MRI contrast materials are also expensive; additional fees of between $150 and $300 are often levied for contrast, depending the contrast agent and dose, which is based on patient weight. Table 15-1 lists approximate charges for MRI of the hip, wrist, and spine, based on 2007 coding information from the insurance industry.
| Procedure Description | Procedure Charge or Technical Fee |
|---|---|
| Hip MRI, without contrast | $800 |
| Wrist MRI, without contrast and again with contrast | $1800 * |
| Spine MRI, without contrast | $800-$900 |
| Spine MRI, without contrast and again with contrast | $1800 |
Duration of Magnetic Resonance Imaging EXAMINATIONS
The duration of an MRI study depends on the number and types of pulse sequences performed. An MRI of the wrist, hip, or single region of the spine requires approximately 45 minutes. More limited sequences may be adequate for some diagnoses and are more rapid to perform. For example, a single T1 coronal sequence of the hip can be acquired in 5 minutes, though the sensitivity for fracture has not been validated in large studies.
Patients often find the MR examination challenging and may require sedation because of the claustrophobic environment of closed MRI units, which are typically cold, loud, and require the patient to be fully surrounded by the MRI tubular gantry. The patient must remain stationary for the duration of the examination to avoid motion artifact. Sometimes, sequences must be repeated because of patient motion, adding to examination duration. Good analgesia is critical to allow the patient to remain comfortably motionless for this period. Image reconstruction is rapid with today’s fast computer processing, but the tremendous number of images generated with multiple pulse sequences can result in long interpretation times.
Basic Principles of Magnetic Resonance Imaging
Emergency physicians need not understand the complex physics underlying MRI, but a basic understanding of MRI principles can clarify why some pathologic processes may be better seen with MRI than with other imaging modalities. At the same time, an understanding of basic MRI principles may reveal why MR image abnormalities require interpretation and may not always represent acute pathology.
MRI is not simply a “radiation-free CT scan.” MRI does not use ionizing radiation, unlike CT and x-ray. Instead, in MRI, an applied magnetic field and an applied radio signal induce changes in the magnetic moment of protons (hydrogen ions) within the field. As the protons return to their original state, energy is released, producing the signal used to generate magnetic resonance (MR) images ( Figure 15-1 ). Complex computer algorithms construct images based on properties of the emitted signal.

Because the images created by CT and MRI depend on different physical properties of body tissues, they convey different clinical information. Let’s consider the features that create strong signal in CT and MR and the effect on the information in the resulting images.
Computed Tomography Signal and Images
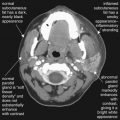
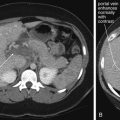
When a CT scan is performed, ionizing radiation passes through the patient’s body, and a receptor records the strength of the x-ray emerging from the body. The attenuation of the x-ray beam varies, depending on the body tissues through which the beam passes. The degree of attenuation is essentially proportional to the physical density of the tissue (see Figure 15-1 ). Physically dense tissues such as bone attenuate x-ray to a greater degree than do less dense tissues. The relative density of tissues on CT can be remembered by considering the analogy of a glass of water into which different materials are placed. Air is least dense and remains above the water. Oil (fat) poured into the glass floats on the surface of the water because fat is less dense than water. Soft tissues such as a piece of meat sink to the bottom of the glass because they are slightly denser than water (remember that soft tissues consist of cells, which are composed predominantly of water). Bone is densest and falls to the bottom of the glass. On CT, a standardized density scale is applied, called the Hounsfield scale, measured in Hounsfield units. On this scale, air has a density of −1000 Hounsfield units, fat has a density of around −50 to −100 Hounsfield units, water has a density of 0 Hounsfield units, soft tissues have a density of around +50 to +100 Hounsfield units, and bone has a density of several hundred to +1000 Hounsfield units. A gray scale is assigned by density. The densest tissues are whitest, and the least dense are blackest, with intermediate densities assigned corresponding intermediate gray shades. Although the gray shade on CT can be adjusted to accentuate the appearance of certain tissues, a process called windowing, the relative brightness or darkness of tissues remains fixed because it depends on their fixed relative densities. Air is always blacker than bone. Pathologic processes can often be recognized on CT scan by changes in the density of tissues. For example, soft-tissue inflammation or edema results in an increase in the water content of adjacent fat, increasing its density. This results in an increase in the brightness of fat, called stranding. Abnormal fluid collections within soft tissues are usually visible on CT because they are lower in density than the normal soft tissue and appear darker. Air within soft-tissue infectious collections is black and is readily seen. Fractures in bone may be seen as discontinuities in the bright white cortex of bone.
Magnetic Resonance Signal and Appearance of Tissues in Resulting Images
A full description of the physics of MRI is beyond the scope of this text, as we focus on features important to emergency diagnosis. When MRI is performed, a magnetic field and radio frequency signal are applied, resulting in an emitted signal from tissue protons flipping their magnetic moment. The brightness of a tissue is therefore not proportional to physical density but rather proportional to proton richness and the characteristics of the applied magnetic field and radio signal, which can be varied to achieve different diagnostic effects (see Figure 15-1 ). Proton-rich tissues such as water can generate a strong signal; proton-poor tissues cannot generate a strong signal. Tissues devoid of protons, such as cortical bone and air, generate no signal.
A strong MR signal is assigned a bright (white) color on all MRI sequences. A weak signal is assigned black, with intermediate signal strengths receiving intermediate gray shades. The brightness of tissues on MR images therefore depends on the strength of the emitted signal from protons in response to a given pulse sequence (magnetic field and radio frequency manipulation). For example, air and calcified bone have a paucity of protons, emit no signal regardless of the magnetic field manipulation, and appear black on all MRI pulse sequences. Note this difference from CT, in which air and bone occupy opposite ends of the gray scale because of their widely different physical densities and x-ray attenuations.
Excluding air and cortical bone, other tissues have variable appearances on MRI depending on the character of the applied magnetic field and radio frequency signal, which can be manipulated in many ways. A given manipulation is called an MRI pulse sequence. Protons in tissues of various types respond differently to variations in the applied magnetic field and radio signal, depending on the other properties of the tissue. In response to some pulse sequences, water-rich tissues emit a strong signal and appear white. In response to other pulse sequences, they emit a weaker signal and appear black. Hematopoietic bone marrow is hyperintense to (brighter than) skeletal muscle on all pulse sequences. Fat in marrow may be bright (T1) or dark: T2, fast T2 with fat saturation, or short T1 inversion recovery (STIR)—see the later descriptions of these pulse sequences ( Figure 15-2 ). Table 15-2 lists the appearance of various tissue types on MRI sequences.

| Tissue | Appearance | Best Sequence |
|---|---|---|
| Air | Black on all sequences | Not applicable |
| Bone | Black on all sequences |
|
| Articular cartilage | Variable |
|
| Meniscus | Dark on all sequences |
|
| Labrum | Dark on all sequences |
|
| Tendons or ligaments | Usually dark on all sequences except the anterior cruciate ligament, which has a striated appearance |
|
| Muscle | Intermediate intensity on all sequences |
|
| Fat | Variable |
|
| Synovium | Invisible unless pathologically thickened |
|
We discuss the clinical applications of common pulse sequences later in this chapter.
Signal Strength and Image Resolution in Magnetic Resonance Imaging
An ideal MR image would have good signal-to-noise ratio and high spatial resolution. Unfortunately, these characteristics are inversely related because of the way that MR images are created ( Figure 15-3 ). MR images are generated from the signals emitted from three-dimensional tissue volumes. The total signal from a given tissue volume is displayed as a single pixel, also called a volume element or “voxel” because of its three-dimensional source. The number of protons in a voxel is proportional to the volume of the voxel. The resolution of the image is inversely proportional to the voxel size. Using many small tissue volumes results in a high-resolution image composed of many small voxels. However, because the number of protons in each of these small volumes is also small, the signal from each voxel is weak compared with the background noise. The signal-to-noise ratio can be improved by increasing the size of the voxels, but this necessarily reduces the resolution of the image. The signal-to-noise ratio can be improved by moving the MRI coil (the source of the magnetic field) closer to the imaged body part, allowing high-resolution extremity images to be acquired while maintaining good signal strength by using dedicated extremity coils.

Two- and Three-Dimensional Imaging With Computed Tomography and Magnetic Resonance
Both CT and MRI use complex computer algorithms to generate images, which can be displayed as two-dimensional “slices” through the body in any plane or as three-dimensional reconstructed images.
Older single-slice CT scanners acquired single image slices through the body in an axial plane, usually with gaps between adjacent slices (for a more detailed description, see Chapter 8 ). Modern multislice CT scanners acquire three-dimensional volumes of data through helical acquisition. These volumes can be thought of as stacks of thin two-dimensional axial slices, with the thickness of each slice determined by the way that the CT scanner is programmed. Most CT scanners can acquire slices as thin as 0.625 mm, although these thin slices generally result in longer duration of scanning. For faster CT acquisition, some scanners are routinely programmed to acquire thicker slices (e.g., 3 to 5 mm), at the expense of some image resolution. The stack of CT images can be “resliced” for display in multiple planes. The quality of the reconstructed multiplanar CT images depends on the thickness of the original slices. A CT dataset acquired at 5-mm slice thickness results in significant stair-step artifact when the stack of thick slices is resliced to create a sagittal or coronal image. If the original slices are acquired at 0.625-mm thickness, the stack of thin slices can be resliced to yield multiplanar images with minimal artifact.
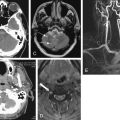
As with CT, some MRI pulse sequences acquire data as two-dimensional slices that can be “stacked” to create a three-dimensional volume. Gradient–echo MRI pulse sequences (described later) allow acquisition of a true three-dimensional volume of data, which can be resliced for display in any plane ( Figure 15-4 ) without artifact.

Technical Features of Computed Tomography and Magnetic Resonance Affecting Ability to Diagnose Fracture
CT and MR diagnoses of fracture rely on different imaging findings.
Modern CT scanners demonstrate the cortex of bone at very high spatial resolution. The cortex of bone is readily visible on CT because it consists of dense calcium, which attenuates the x-ray beam to a great extent, as described earlier. A fracture plane is a discontinuity in the cortex, usually filled with low-density hemorrhage, which attenuates the x-ray beam to a significantly lesser extent. A brief comparison with earlier CT scan technology highlights the mechanism for improved diagnostic accuracy of CT over time. Early CT scanners performed a series of single axial slices, with gaps between adjacent slices. A narrow fracture in the axial plane might fall between two adjacent slices and be missed. In addition, the thickness of the axial slices was as great as 5 mm with early scanners. Consequently, each displayed planar axial image represented the pooled data from several millimeters of anatomy in the z -axis. The low density of a fractured cortex might be obscured when it was “volume averaged” with data from the intact cortex in the adjacent several millimeters of anatomy. In comparison, modern multislice CT scanners perform helical acquisition of slices as thin as 0.625 mm, with no gaps between image slices ( Figure 15-5 ). These form a three-dimensional volume of image data that can be displayed in axial, coronal, or sagittal planes. The probability of missing even a narrow fracture plane is thus greatly reduced.

MRI demonstrates fractures through a different mechanism. The calcified bony cortex and trabecular bone are devoid of resonating protons, which are found predominantly in tissues containing fat or water. Consequently, the cortex and trabeculae produce essentially no signal and appear as black signal voids on all MRI pulse sequences. However, bone marrow contains fat, which produces high signal on some pulse sequences. In addition, in the presence of fracture, hemorrhage and edema in the marrow space provide resonating protons that produce a strong signal; this pathologic signal can be differentiated from normal marrow fat. Thus MRI provides an indirect diagnostic finding of fracture, rather than directly visualizing cortical fracture.
Magnetic Resonance Imaging Pulse Sequences
As we described in preceding basic outline, the MRI appearance of a tissue depends on the proton density of the tissue (protons per unit volume) and on the tissue type. The signal emitted by a proton is determined by its resonance (hence the term magnetic resonance ). The tissue type affects the resonance of protons within that tissue in response to a given applied magnetic field and radio signal, called a pulse sequence. Protons within fat resonate with different properties from protons in body fluids. Adjusting the pulse sequence is called “weighting” the image, and it results in the various image types available from MRI. MR pulse sequences are distinct magnetic field and radio frequency conditions applied as the image data is acquired; they differ from CT “windows,” which are variations in the manner in which the previously acquired image data is displayed.
Common pulse sequences with their clinical applications are listed in Table 15-3 . The tissue appearances using these pulse sequences were described in Table 15-2 .
| Sequence | Strength | Weakness |
|---|---|---|
| Spin–Echo | ||
| Proton density |
|
|
| T1 |
|
|
| T2 |
|
|
| Fast Spin–Echo | ||
| Proton density |
|
|
| T2 |
|
|
| Gradient–Echo | ||
| T2 * |
|
|
| STIR | ||
|
| |
Many pulse sequences have been developed, each with strengths and weaknesses for evaluating a given type of pathology. The pulse sequence should be selected based on its ability to depict the anticipated pathology, so the input of the emergency physician is essential. The emergency physician need not select the sequence but should inform the radiologist of the differential diagnosis or indication for the study to allow the radiologist and MRI technician to select appropriate sequences and imaging planes to maximize diagnostic accuracy. All available pulse sequences cannot be performed in a single patient, because each sequence takes time to perform, and the duration of an MRI examination with many pulse sequences would become prohibitive.
Frequently used musculoskeletal MRI pulse sequences include three spin–echo sequences: proton density images (which provide excellent anatomic detail but do not highlight soft-tissue contrast for pathologic processes), T1-weighted images (used to visualize fat-containing tissues), and T2-weighted images (used to highlight fluid, which is common resulting from edema in many pathologic processes). Fast spin–echo techniques have largely replaced standard spin–echo T2, allowing faster image acquisition with reduced patient movement, reduced motion artifact, additional time for more pulse sequences when necessary, and faster throughput. One important limitation of fast spin–echo T2 is blurring at tissue margins, which can hide pathology such as meniscal tears in an injured knee.
Fat saturation is an additional technique valuable in musculoskeletal applications. An administered magnetic pulse suppresses the signal from fat, rendering fat dark in appearance. This is necessary to discriminate fat from fluid on fast T2-weighted images, in which both tissue types appear bright without fat suppression. A clinical example of the use of this technique is MRI for occult fracture. Because cortical bone is devoid of protons and is invisible (black) on all MRI sequences, fractures are revealed not by cortical abnormalities but by the presence of bone marrow hemorrhage or edema at the site of fracture. Bone marrow is normally rich in fat and devoid of fluid, and it appears bright on fast T2-weighted images. However, pathologic fluid also appears bright on this pulse sequence. By suppressing fat signal with fat saturation, pathologic fluid within bone marrow is revealed. STIR (sometimes called inversion recovery) also causes suppression of signal from fat and can be used for similar clinical applications as those benefiting from fast T2 with fat saturation.
Gradient–echo pulse sequences are distinct from spin–echo techniques and have advantages in musculoskeletal imaging. Gradient–echo T2 images (sometimes called T2∗, pronounced “T2 star”) highlight fluid, are rapidly acquired and depict cartilage, ligaments, and fibrocartilaginous structures in detail, clear benefits for musculoskeletal evaluation. The evaluation of other soft-tissue contrast is limited with this technique. True three-dimensional “volume” imaging is possible with gradient–echo but requires longer periods for image acquisition.
Susceptibility effects are artifacts created by some pulse sequences at the interface between two tissue types with widely different magnetic properties. They result in loss of signal, with a black appearance on MR images. Susceptibility effects can sometimes be used strategically for diagnostic advantage but must be avoided in other cases because of impaired diagnostic ability. For example, gradient–echo T2 pulse sequences depict the increased susceptibility effects from hemoglobin breakdown products and are sensitive for detection of hemorrhage. However, susceptibility effects around metal hardware obscure adjacent soft tissues on this pulse sequence. Fast spin–echo T2 sequences have minimal susceptibility effects and are therefore ideal for imaging patients with metal hardware.
Magnetic Resonance Imaging and Gadolinium Contrast Agents
A variety of gadolinium-based medical contrast agents are available in the United States. These contrast agents complex the rare-earth metal gadolinium to larger structures, altering the tissue distribution in diagnostically useful ways. Gadolium contrast agents increase signal on T1-weighted images, causing soft-tissue enhancement nearly proportional to blood flow. Properties of the chelating molecule (linear or cyclic and ionic or nonionic) determine the tissue affinity and half-life. Most agents are renally excreted, with some agents also excreted partially in bile. Agents can be given intravenously or intraarticularly to produce an arthrogram, although this second route of administration is rarely used in the emergency department.
For most trauma-related emergency musculoskeletal MRI, including acute traumatic spinal cord injury, gadolinium contrast is not needed. Gadolinium contrast agents are most valuable for angiography, and identification of infectious or neoplastic processes. In the case of suspected soft-tissue infection, gadolinium can differentiate a discrete abscess from soft-tissue edema and phlegmon. Bone marrow enhancement after gadolinium is not specific for osteomyelitis, because reactive hyperemia has a similar appearance. Gadolinium is useful in evaluation of nontraumatic spine lesions, including tumor, demyelinating disease (multiple sclerosis), and intradural or extramedullary lesions such as metastatic disease. Following spinal surgery, gadolinium is useful for differentiation of enhancing scar tissue from nonenhancing disc material.
Gadolinium safety is discussed in detail later.
Magnetic Resonance Imaging Safety and Contraindications
Nephrogenic Systemic Fibrosis and Gadolinium Contrast
Although the risk for contrast nephropathy from iodinated contrast used in CT is familiar to emergency physicians, gadolinium-associated nephrogenic systemic fibrosis may be less recognized. Nephrogenic systemic fibrosis (NSF) is a potentially fatal condition first linked to gadolinium contrast exposure in 2006. The condition results in tissue fibrosis clinically similar to scleroderma—sometimes localized, but in other cases involving multiple internal organs and progressing to death.
Contrast nephropathy from iodinated contrast agents leads to worsened renal insufficiency in patients with baseline renal impairment but has no important consequences in patients already receiving hemodialysis for chronic renal failure. In stark comparison, gadolinium-associated nephrogenic systemic fibrosis appears to pose the greatest risk to patients with acute and chronic renal insufficiency, including patients receiving chronic hemodialysis. Because gadolinium contrast agents are largely renally excreted, with a half-life of approximately 90 minutes in patients with normal renal function, patients with low glomerular filtration rates (GFRs) are exposed to circulating gadolinium for longer periods. For one common agent, gadodiamide, the half-life in patients with end-stage renal disease but not yet receiving dialysis is more than 34 hours and in peritoneal dialysis patients is more than 52 hours. Gadolinium agents are removed by hemodialysis, with approximately 65% to 78% cleared during a first hemodialysis session, 96% following a second session, and 99% following a third session. Peritoneal dialysis is poor at removing these agents; after 22 days of continuous peritoneal dialysis, only 69% of gadolinium contrast is excreted.
Gadolinium-associated NSF is a grave but rare risk. Prince et al. retrospectively reviewed 74,124 patients receiving gadolinium-enhanced MRI over 10 years at two large medical centers and found no cases of biopsy-proven NSF after a standard gadolinium dose, 0.1 mmol/kg. Among patients receiving a high dose of gadolinium (between 0.2 and 0.4 mmol/kg), 15 of 8997 (0.17%) developed NSF, and all had an estimated GFR of less than 30 mL per minute. Of these patients, 11 had acute or acute-on-chronic renal insufficiency. Patients receiving chronic hemodialysis for end-stage renal disease and receiving high-dose gadolinium developed NSF at a rate of 0.4%. The highest incidence of NSF was observed in patients receiving high-dose gadolinium under two circumstances: 8.8% (10 of 114) in patients with a very low GFR (<15 mL/min) but not yet receiving hemodialysis and 19% (11 of 58) in those with acute renal failure and a creatinine increase of 0.5 mg/dL or greater in a 24-hour period. Hyperphosphatemia was also associated with increased NSF risk. No patient developed NSF if hemodialysis was performed within 24 hours of gadolinium exposure, and hemodialysis within 48 hours was associated with decreased risk. The risk of NSF appeared greatest in patients receiving Gadodiamide (GE Healthcare), while other gadolinium-based contrast agents were rarely associated with NSF.
For the emergency physician, several key points bear repeating. The risk for NSF is extremely low in patients receiving standard doses of gadolinium, regardless of renal function. The risk remains very small in those receiving high-dose gadolinium, except in patients with acute renal failure with an estimated GFR of less than 30 mL per minute. The risk is particularly high in patients with acute and worsening renal failure, and gadolinium should be avoided in this group whenever possible. Creatinine clearance, not measured serum creatinine, should be used to categorize renal function, and is calculated by a simple formula ( Box 15-1 ) incorporating serum creatinine, patient age, gender, and body mass. Creatinine clearance calculators are readily available online, and some clinical laboratories now report creatinine clearance in addition to measured creatinine. An example illustrates the importance of using calculated creatinine clearance rather than measured serum creatinine. A measured creatinine of 1.0 mg/dL is within normal limits for most clinical laboratories. In a 70-kg, 35-year-old male, this corresponds to a (normal) calculated creatinine clearance of 90 mL per minute. However, in a 50-kg, 85-year-old female, this corresponds to a calculated creatinine clearance of 32 mL per minute, representing significant renal dysfunction.
Creatinine clearance (eC cr ) is a more accurate measure of renal dysfunction and risk for gadolinium-related nephrogenic systemic fibrosis than is measured serum creatinine.
( 140 − age [ yrs ] ) × ( mass [ kg ] ) × [ 0.85 if female , 1.0 if male ] 72 × ( measured serum creatinine in mg / dL )
Stay updated, free articles. Join our Telegram channel

Full access? Get Clinical Tree


