34 Evaluation of Organ Transplants
Renal Transplantation
Renal transplantation has become the gold standard treatment for patients with end-stage renal disease.1 Improvements in surgical technique, coupled with advances in immunosuppressant therapy, careful imaging, and clinical graft surveillance have resulted in improved patient and graft survival as well as improved quality of life when compared to dialysis alone.1,2 It is currently estimated that deceased donor (DD) renal transplantation extends the average life expectancy of the recipient by 7 to 10 years and living related donor transplantation by 15 to 20 years.3 These benefits are reflected in a 31% increase in the number of renal transplants performed in the United States from 1998 through 2007 as well as an 86% rise in the number of candidates on the renal transplant waiting list.4 The United Organ Procurement and Transplant Network reported that 17,357 renal transplants were performed in the United States in 2008 and that 108,000 patients remain on the waiting list in 2010.5 Despite utilization of living related, living nonrelated, and deceased donors (DDs), organ shortage remains the major rate-limiting factor for renal transplantation in the United States.
Causes of allograft failure are numerous, ranging from rejection to drug toxicity, urinary tract obstruction, and vascular thrombosis or stenosis. However, the clinical presentations of these conditions overlap, and findings such as renal failure, low-grade fever, elevated white blood cell count, and pain are nonspecific. Hence, time course since transplantation, imaging, and ultimately renal biopsy play key roles in determining patient management by differentiating between underlying pathology that requires surgical or percutaneous intervention from conditions that can be managed medically. US has become the imaging modality of choice for the evaluation of both the immediate and long-term complications of renal transplants because US is noninvasive, radiation-free, and relatively inexpensive.6 In addition, US may be helpful in guiding interventional diagnostic and therapeutic procedures. Other imaging modalities that may be used to evaluate patients following renal transplantation include radionuclide scintigraphy, magnetic resonance angiography, and computed tomography (CT). These modalities are typically used to further delineate an abnormality first identified on US or to investigate a particular clinical question following a negative or equivocal sonogram.
Pretransplant Workup
Renal transplantation may be performed with HLA-matched DDs or HLA-matched living donors (LDs) that are either related or unrelated. Survival outcomes are best for LD renal transplants.5 In addition to the history, physical examination, and regular laboratory workup, pretransplant evaluation of the living renal transplant donor generally includes cross-sectional imaging to evaluate the renal anatomy for congenital anomalies and to exclude underlying pathology.1 The vascular anatomy of the donor kidney is particularly important, as preoperative knowledge of the number, length, location, and branching patterns of the renal arteries aid the surgeon in his/her surgical approach.7 In the past, conventional angiography was the procedure of choice, but technical advances have made CT angiography and magnetic resonance angiography viable alternatives, both showing good correlation with surgical findings.7,8 In general, the left kidney is preferred for harvesting as the renal vein is longer.
Surgical Technique
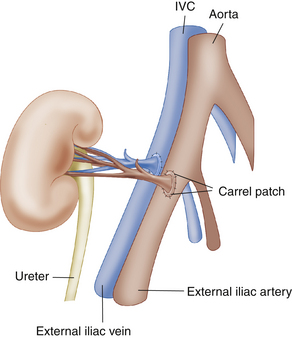
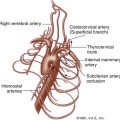
The renal transplant is preferentially placed in the extraperitoneal space in the right iliac fossa because the sigmoid colon limits space on the left. Intraperitoneal placement may occasionally be performed in children. For DD renal transplants, a small oval portion of the aortic wall surrounding the renal ostium, known as a Carrel patch, is often harvested along with the intact main renal artery and anastomosed in an end-to-side fashion with the external iliac artery (EIA; Figure 34-1). With LD renal transplants, the main renal artery is directly anastomosed either end to side with the EIA or less commonly end to end with the internal iliac artery. However, end-to-end anastomoses are more likely to stenose or thrombose.9 The main renal artery is implanted into a region of the recipient EIA without significant atherosclerotic burden as determined by palpation. In the case of multiple renal arteries, a variety of surgical approaches can be used, including multiple individual end-to-side anastomoses, harvest of a larger Carrel patch including the origins of all the main and accessory renal arteries, or the creation of a “Y-graft” of the smaller to the dominant renal artery. The main renal vein (MRV) is anastomosed end to side to the external iliac vein (Figure 34-2, E). Urinary drainage is created via a ureteroneocystostomy, whereby the ureter is tunneled into the dome of the bladder, resulting in an orifice superior to the native ureterovesicular junction (UVJ), although variations such as implantation of the ureter into an interposed bowel segment are also sometimes performed.2 A stent is commonly placed in the ureter (Figure 34-2, F) to reduce the incidence of ureteral stricture and extravasation of urine. Stents are usually removed after 2 weeks to 3 months. The placement of perinephric drains has been reported to decrease the incidence of lymphocele formation (personal communication, Yale Transplant Service).
Normal Ultrasound Findings
The renal transplant is evaluated with gray-scale and color and pulse Doppler imaging. Relatively high frequency transducers (5 MHz) can often be used owing to the more superficial location of the renal allograft in the pelvis in comparison to the native kidney. The renal length is measured in maximal sagittal dimension and may increase following transplantation because of compensatory hypertrophy. However, changes in size from one examination to the next may indicate underlying pathology. Corticomedullary differentiation is typically more pronounced with the renal cortex relatively echogenic and the medullary pyramids more hypoechoic in comparison to the native kidney.10,11 The renal pelvis is usually slightly dilated, which is thought to be secondary to multiple factors, including increased volume of urine production (one kidney doing the work of two), denervation of the autonomic nervous system, and perhaps minor dysfunction at the surgical UVJ.11 However, dilatation of the infundibulum and/or calyces should raise the suspicion for a distal ureteral obstruction.11
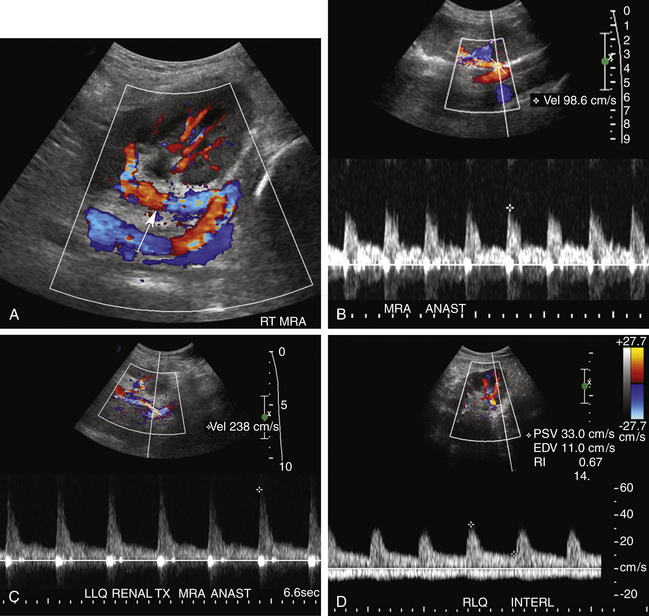
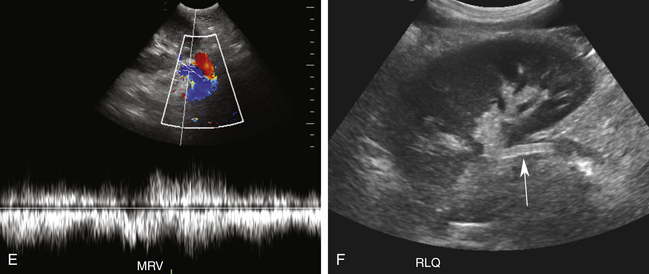
Color and spectral Doppler evaluation of the renal parenchyma, the main renal artery and vein, including their anastomoses, and the recipient iliac vessels are routinely obtained (Figure 34-2, A to E). On color or power Doppler interrogation, a normal transplant should demonstrate parenchymal blood flow arborizing out to the renal capsule without focal areas of decreased vascularity. Peak systolic velocity (PSV) in both the main renal artery and EIA is measured. PSV in the transplanted main renal artery may be elevated in comparison to the native main renal artery, with an upper limit of normal of approximately 200 to 250 cm/sec, likely due to acute angle of takeoff from the EIA and/or tortuosity of the main renal artery. The spectral tracing of the normal renal artery (Figure 34-2, B to D) in the transplanted kidney has a sharp systolic upstroke and continuous forward diastolic flow, reflecting the presence of a low-resistance peripheral vascular bed, and is similar in appearance to the spectral tracing of a normal native renal artery. The resistivity index (RI) of the intraparenchymal renal arteries is measured at the upper, mid, and lower poles in the segmental and interlobar vessels. The normal RI should be less than 0.7 (see Figure 34-2, D). An RI greater than 0.8 is considered abnormal. On the other hand, the recipient EIA should demonstrate a high-resistance waveform pattern with absent or reversed diastolic flow. The MRV is interrogated to demonstrate patency and exclude renal vein thrombosis. Flow may be slightly pulsatile due to close proximity to the adjacent main renal artery. At our institutions, a baseline examination is performed immediately following surgery and subsequently as clinically indicated.
Common Parenchymal Causes of Graft Dysfunction
The most common causes of renal transplant failure include acute tubular necrosis (ATN), rejection (hyperacute, acute, and chronic), and drug toxicity. Clinical presentation is typically nonspecific except in regard to time of onset. Hyperacute rejection, for example, typically presents in the recovery room, and ATN most commonly is noted 2 to 3 days after transplantation, whereas acute or chronic rejection and drug toxicity present later. Similarly, sonographic findings are also nonspecific and unpredictable. Both increased as well as decreased echogenicity of the renal parenchyma, indistinct but also increased or decreased corticomedullary differentiation, decreased visibility of the renal sinus, and allograft swelling with or without increased cortical thickness have all been described.6 Spectral Doppler findings may include an elevated RI greater than 0.80, which is a nonspecific finding of renal dysfunction likely reflecting increased peripheral vascular resistance from a myriad of factors, including anything that can cause interstitial edema.6 Conversely, a normal RI does not exclude underlying pathology. While serial measurements of RI may be helpful to determine progression or therapeutic efficacy of intervention, biopsy with serologic correlation remains the gold standard for diagnosis of the underlying cause of graft failure in most cases.11–20
ATN is the most common cause of graft dysfunction in the immediate postoperative period, occurring in up to 34% of DD renal transplants.14,15 Ischemic insult to the renal transplant parenchyma before revascularization is typically the primary cause of ATN. Risk factors include prolonged ischemic time (>24 hours), hypotension or excessive blood loss during surgery, prolonged illness or intensive care unit stay of the donor, a donor without spontaneous cardiac activity, and reperfusion injury. ATN is unusual in LD renal transplants unless problems, such as hypotension, occur during surgery. ATN typically begins 2 to 3 days postoperatively, but can be severe and develop immediately following the transplant procedure. While some degree of ATN may persist for up to 3 months, most cases resolve within 2 to 3 weeks, although 10% to 30% of patients may require temporary dialysis.16 Of note, it is believed that the process of tubular repair increases the risk for later development of acute rejection.13 While the surgeon knows preoperatively which donor kidneys are at risk and can recognize a lack of “pinking up” of the kidney once it is revascularized , the clinical presentation of renal failure and decreased urine output in patients with ATN is nonspecific. Nor are gray-scale US findings helpful in making the diagnosis. On Doppler US interrogation, decreased diastolic flow or increase in RI is typical of ATN (Figure 34-3) but is also a nonspecific finding seen in many causes of graft dysfunction. In general, the higher the RI, the worse the ATN, and actual reversal of diastolic flow may be observed in extreme cases.21 An RI greater than 0.73 30 minutes postoperatively has been described as strongly predictive of the development of ATN.22
Hyperacute rejection occurs in the immediate (<24 hours) postsurgical period, usually in the recovery room, and is extremely rare in today’s practice due to preoperative HLA matching. Doppler interrogation may not be able to detect parenchymal blood flow because of intense vasospasm and interstitial edema. Hence, findings may mimic renal artery thrombosis (RAT). If blood flow is seen, diastolic flow is typically absent or even reversed and the RI is markedly elevated.21
Acute rejection is estimated to occur in up to 20% to 40% of all renal transplants and usually develops within 1 to 3 weeks to months after transplantation.19 However, new immunosuppressant regimens have decreased the incidence of acute rejection in recent years.19 Most patients are asymptomatic, but flu-like symptoms, graft tenderness, and low-grade fever along with deteriorating renal function are occasionally reported. Patients may present with a rapid rise (>25%) of serum creatinine level over a 1- to 2-day period.17,18,20 Swelling of the graft, pruning of parenchymal blood flow, and increased RI are nonspecific findings in moderate to severe cases on Doppler US examination. However, these are nonspecific findings, and diagnosis requires biopsy. In most cases, acute rejection can be treated with steroids or by increasing immunosuppression. However, an episode of acute rejection is an indicator of future transplant failure.23
Chronic rejection manifests as a progressive decline in renal function beginning at least 3 months after surgery and may ultimately lead to renal failure.6 A prior episode of acute rejection is the most common predisposing risk factor. Gray-scale imaging may demonstrate a decrease in kidney length with a thinned and echogenic cortex. The RI may be increased on spectral Doppler interrogation.6
Cyclosporine and tacrolimus (calcineurin inhibitors) are extremely effective immunosuppressive agents. However, both are nephrotoxic, causing renovascular constriction and interstitial fibrosis. Reactivation of polyomavirus is associated with these drugs and is also reported to cause nephropathy. Since the clinical presentation, time course, and Doppler US findings of drug toxicity and chronic rejection are indistinguishable, differentiation between these two causes of renal failure requires biopsy and careful correlation with serum drug levels.11,19,20
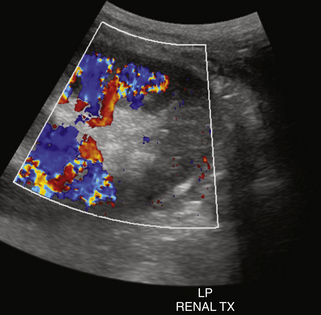
Pyelonephritis may cause diffuse or focal areas of either increased or decreased echogenicity. A segmental infarct may cause a similar focal appearance, although an infarct is often more sharply marginated and wedge shaped. A segmental infarct will also be avascular on color or power Doppler interrogation (Figure 34-4).
Vascular Complications
Doppler US is considered the primary screening modality for the diagnosis of vascular complications. Vascular complications occur in less than 10% of renal allograft recipients24 but are often treatable causes of graft dysfunction. Renal artery and renal vein thrombosis tend to occur in the immediate postoperative course, whereas stenoses of these vessels typically develop more than 5 to 6 months following transplantation. Postbiopsy complications include arteriovenous fistulas (AVFs) and pseudoaneurysms (PSAs).
RAT typically occurs very early in the postoperative period. Immediate diagnosis is critical so that thrombectomy or thrombolysis can be performed to prevent graft loss. RAT has a reported incidence of less than 1% and is more common in LD transplant recipients, in patients with complex arterial anastomoses, and in pediatric transplants due to the small size of the main renal artery.2,12,24 Acute and hyperacute rejection, underlying hypercoagulable states, arterial kinks, arterial dissections, vessel size mismatch, ATN, prolonged ischemic time, or faulty surgical technique have all been reported as underlying causes of RAT.2,12,19,20 Clinically, patients with RAT present with acute anuria and tenderness over the graft.2 On color, power, or spectral Doppler US, neither arterial nor venous flow will be seen distal to the site of occlusion2,10,12,19,24–26 (Figures 34-5 and 34-6). The kidney may appear relatively hypoechoic and enlarged on gray-scale imaging. Focal or segmental infarcts occur most commonly in the setting of embolus, acute rejection, cytomegalovirus (CMV) infection, vasculitis, separate anastomosis of a small polar artery, or scarring due to injury from the perfusion catheter. On US, focal infarcts typically manifest as well-defined wedge-shaped to round avascular masses or regions. Echogenicity is variable depending upon the time course and whether or not hemorrhage into the infarct has occurred (see Figure 34-4). Focal pyelonephritis may have a similar appearance.
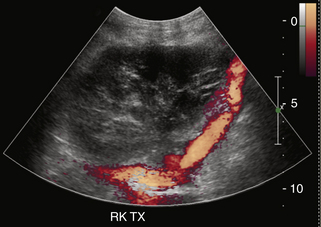
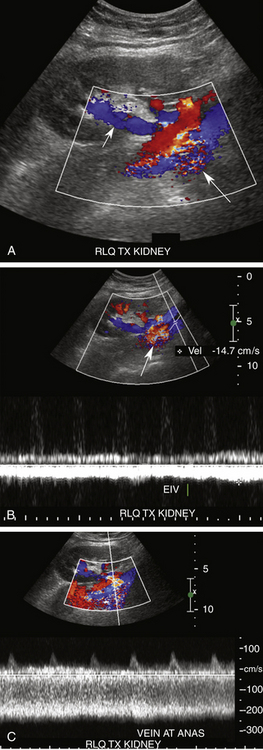
Renal vein thrombosis (RVT) has a reported incidence of approximately 5%.2 It usually occurs within the first postoperative week, and patients also present with abrupt onset of oliguria, graft swelling, and tenderness.12 If detected early, thrombectomy may prevent graft loss. However, nephrectomy and retransplantation are required if infarction has already occurred by the time of diagnosis.2 Predisposing risk factors include hypotension, hypercoagulable states, acute rejection, anastomotic stenosis, venous compression from perinephric fluid collections, and propagation of an underlying clot in the iliac vein2,12,19,20,24–26 (Figure 34-7). RVT occurs slightly more commonly in transplants placed in the left iliac fossa, possibly due to compression of the left iliac vein by the overlying artery and aorta. Gray-scale findings are nonspecific and include enlargement of the renal graft with decreased parenchymal echogenicity.12 The MRV may be enlarged and filled with hypoechoic thrombus, although acute thrombus can be anechoic. Doppler interrogation will demonstrate absence of venous flow associated with increased resistance in the renal arteries to the point of reversed diastolic flow (Figure 34-8).2,12,19,20,24–26 However, reversal of diastolic arterial flow alone (i.e., without demonstration of concomitant absence of venous flow) is a nonspecific finding and can be seen in patients with hyperacute rejection, severe ATN, and compression of the renal parenchyma by surrounding fluid collections, resulting in the Page kidney phenomenon (Figure 34-9).15,21
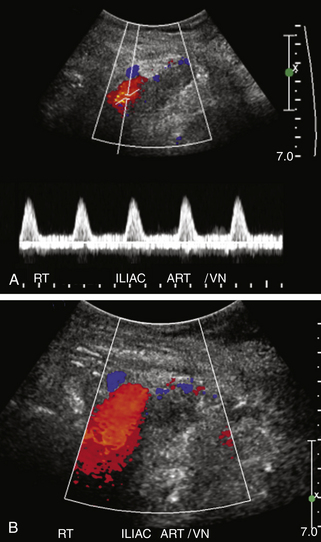
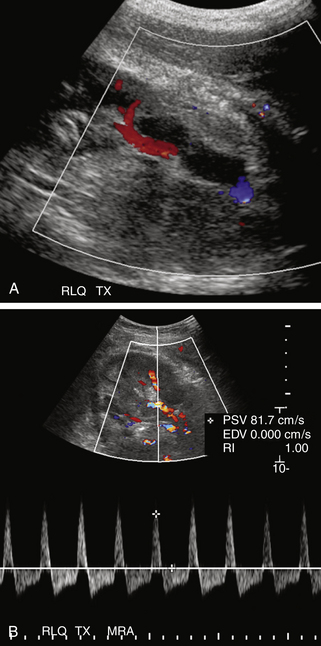
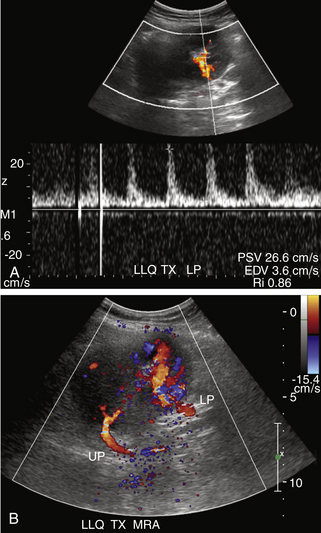
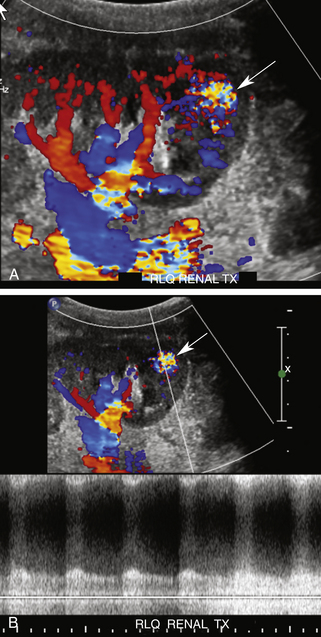
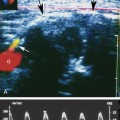
FIGURE 34-8 Renal vein thrombosis (RVT). A, Color Doppler image demonstrates no flow in the main renal vein anterior to the main renal artery (red) in a transplant (TX) in the right lower quadrant (RLQ). B, Duplex Doppler waveform demonstrates a high-resistance pattern in the main renal artery (MRA) with reversed diastolic flow. While RVT is the most common cause of such a waveform pattern in the immediate postoperative period, it is a nonspecific finding and may be seen in hyperacute rejection, severe acute tubular necrosis, and compression of the renal parenchyma by surrounding fluid collections (Page kidney; see Figure 34-9).
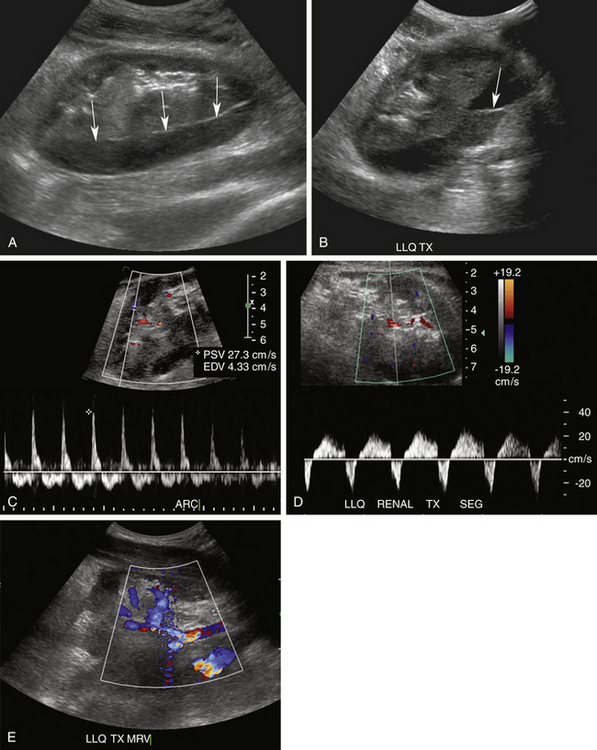
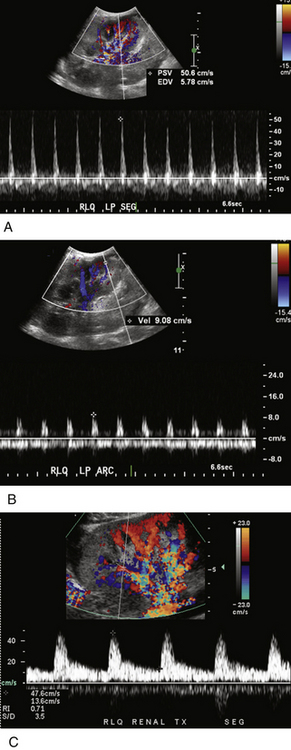
FIGURE 34-9 Page kidney. This patient presented with pain and decreased urine output 1 day following living related donor transplantation. Sagittal (A) and oblique transverse (B) gray-scale images demonstrate a complex fluid collection surrounding the kidney and distorting the renal parenchyma (arrows in A). A fluid/fluid level is noted (arrow in B). LLQ, left lower quadrant. Findings are consistent with a large subcapsular hematoma with hematocrit level compressing the renal parenchyma. Spectral Doppler tracings demonstrate reversed diastolic flow, similar to Figure 34-8, B, in the arcuate (ARC; C) and segmental (SEG; D) arteries. However, color Doppler image of the renal hilum (E) demonstrates venous flow (blue) in the main as well as parenchymal renal veins. In this case the reversed diastolic flow was caused by the Page kidney phenomenon (i.e., increased peripheral vascular resistance due to compression of the renal parenchyma from the surrounding hematoma). Unfortunately, despite surgical decompression, severe acute tubular necrosis developed, and the kidney never regained function and had to be removed.
Renal artery stenosis (RAS) is the most common vascular complication in renal transplants, with an incidence ranging from 1% to 12%.12,19,20,24 RAS is more common in LD than DD transplants because harvesting of the main renal artery with a Carrel patch likely protects the renal ostium in a DD transplant. End-to-end anastomoses have the highest risk for developing RAS.9 As with RAT, the incidence of RAS is higher in patients with complex arterial anastomoses and in pediatric transplants. Stenosis generally occurs after 3 months and within the first 3 years after transplantation. Patients present with new onset or worsening of severe, refractory hypertension.2,12,24,25 On physical examination, a bruit may be audible over the transplanted kidney.2 Causes of RAS are postulated to include intimal fibrosis/scarring, faulty surgical technique, vessel injury from the perfusion catheter, allergic reaction to the suture material, and rejection.2,12,19,20,24–26 Stenoses occur most commonly at the main renal artery anastomosis. Distal stenoses are infrequent and may be a sign of allograft rejection or prior dissection and/or endothelial damage from the perfusion catheter.2 In the early postoperative period, compression, kinking, or torquing of the renal artery may cause a functional RAS, particularly in patients with an excessively long or redundant vascular pedicle (see later). In such cases, stenosis of the MRV with or without elevated Doppler velocities is usually observed. Stenosis in the native EIA near the arterial anastomosis due to atherosclerosis or clamp injury can mimic RAS clinically as well as on Doppler US examination.2
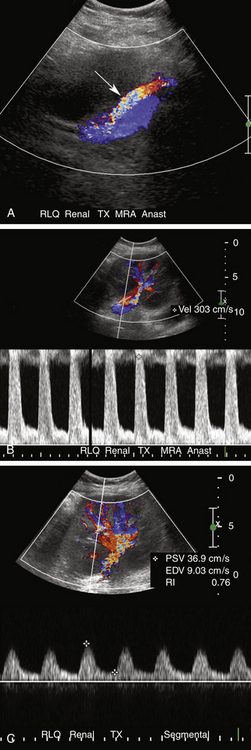
On color Doppler imaging, focal color aliasing indicates high-velocity flow and localizes the site of the stenosis.6,12 Pulsed Doppler criteria include (1) PSV greater than 200 to 250 cm/sec, (2) PSV velocity ratio of at least 2:1 between the PSV at the stenosis and the arterial segment proximal to the stenosis, (3) spectral broadening of the arterial waveform immediately distal to the stenosis, and (4) a tardus-parvus waveform in the distal intraparenchymal vessels2,12,19,20,25–32 (Figure 34-10). However, PSV at the main renal artery anastomosis is often much higher than the PSV at the origin of the native main renal artery due to tortuosity of a redundant artery, acute angle of takeoff from the EIA, or increased flow volume.26 Therefore, some authors advocate using a PSV of 300 cm/sec as a diagnostic threshold.27 Still, increased PSV is not as specific a finding of RAS in the transplanted kidney as it is in the native renal artery. Tardus-parvus waveforms, either identified subjectively or by measuring acceleration time greater than 70 to 100 msec, add specificity to the diagnosis,26,28 although the presence of this waveform pattern merely indicates a proximal stenosis somewhere—which also could be at the level of the EIA, aorta, or even aortic valve. The sensitivity of Doppler US for the detection of RAS has been reported to range from 87% to 94% with specificities of 86% to 100%, but these vary depending upon the specific Doppler criteria. Higher thresholds increase specificity at the expense of sensitivity.27–31 Therefore, due to the lack of specificity of Doppler US findings and the fact that most hypertensive renal transplant recipients do not have RAS, confirmatory imaging with non–contrast-enhanced magnetic resonance angiography is often suggested. Administration of gadolinium is generally avoided in renal transplant recipients, especially those with reduced renal function, due to the risk for nephrogenic systemic fibrosis. Similarly, iodinated intravenous contrast is also avoided due to the risk for renal failure. RAS may be treated via percutaneous transluminal angioplasty, arterial stenting, or less commonly, surgical revascularization.2
Renal vein stenosis (RVS) is an uncommon vascular complication and is usually caused by extrinsic compression from an adjacent perinephric fluid collection or perivascular fibrosis.6 Duplex Doppler US findings include narrowing of the vessel with focal color aliasing and high velocities in the region of stenosis (Figure 34-11).25 No specific Doppler or gray-scale criteria have been established to grade RVS, and the clinical significance of RVS is debatable, although a threefold to fourfold increase in velocity at the stenosis has been reported as possibly clinically significant in a patient with renal dysfunction.26,32 Stenting is the treatment of choice.
Biopsy of the renal cortex is frequently performed to establish the etiology of allograft dysfunction.2 Complications of this procedure include hematomas, AVFs, and PSAs. Most postbiopsy perinephric hematomas are small and do not require treatment unless they are expanding and/or compressing the renal parenchyma or vascular pedicle.33 Most AVFs and PSAs are also small, clinically insignificant, and will resolve spontaneously. PSAs greater than 2 cm in diameter and large AVFs resulting in renal ischemia, hematuria, or congestive heart failure will require percutaneous embolization.2,12,19,20,25 The incidence of clinically important AVFs and PSAs is significantly reduced if US guidance is used to ensure that the renal sinus containing the larger segmental arteries and veins is avoided. A tangential approach through the cortex is safest. Extrarenal AVFs and PSAs are usually due to faulty surgical technique, breakdown of the anastomosis, or infection and generally require intervention due to their large size and risk for rupture (Figure 34-12).
Damage to both the artery and vein may result in a fistulous connection (AVF) between these two structures.2,12,19,20,24–26 Color Doppler imaging may demonstrate disorganized color signals outside the normal borders of the vessels, termed a soft tissue bruit, a finding attributed to perifistula soft tissue vibration. Focal color aliasing will also be observed due to high-velocity flow within the feeding artery.2,12,32 Spectral Doppler interrogation demonstrates a characteristic high-velocity, low-resistance waveform within the feeding artery and pulsatile high-velocity flow in the draining vein (Figure 34-13).* Dilatation of the draining vein may mimic a cystic structure on gray-scale imaging.
Related posts:
 Normal Cerebrovascular Anatomy and Collateral Pathways
 Controversies in Venous Ultrasound
 Nonimaging Physiologic Tests for Assessment of Lower Extremity Arterial Disease
 Ultrasound Assessment of the Abdominal Aorta
 Extremity Venous Anatomy and Technique for Ultrasound Examination
Stay updated, free articles. Join our Telegram channel

Full access? Get Clinical Tree


