Prerenal
Reduced cardiac output
Dehydration
Hypovolemia
Hemorrhagic shock
Systemic vasodilatation
Anaphylactic shock
Intrarenal vasoconstriction
Sepsis
Liquid sequestration (e.g., acute pancreatitis)
Renal
Acute cortical necrosis
Glomerular diseases
Papillary necrosis
Renal vascular diseases
Postrenal
Urinary obstructive disease
1.1 Prerenal and Renal Acute Renal Failure
Morphological evaluation of the kidney is now more reliable by more recent US equipment and tissue harmonic techniques. Morphological alterations in renal parenchyma are observed in almost 10 % of ARF patients. Renal dimensions are usually normal in prerenal ARF, may be increased in acute renal disease, such as ATN, tubulointerstitial nephritis, and acute glomerulonephritis, and are reduced in renal failure complicating chronic nephropathy (Table 1). Most patients with ARF have normal renal echogenicity, even though acute and diffuse renal parenchymal diseases may show hyperechogenicity, increased parenchymal thickness, and increased corticomedullary differentiation (Table 2). A hypoechoic band surrounding the kidney is considered a typical feature of cortical necrosis.
Table 2
Differential diagnosis of renal failure based on US
Renal dimension | Renal echogenicity | Corticomedullary differentiation | Parenchyma thickness | Resistive indices | |
|---|---|---|---|---|---|
Prerenal acute renal failure | Normal | Normal | Normal | Normal | Normal |
Acute tubular necrosis | Increased | Increased | Increased | Increased | Increased |
Interstitial nephritis | Increased | Increased | Increased | Normal or increased | Increased |
Acute glomerulonephritis | Increased | Increased or normal | Increased or normal | Normal or increased | Normal |
Diabetic nephropathy | Increased | Increased | Increased | Increased | Increased |
Ischemic nephropathy | Reduced | Normal | Normal | Reduced | Normal |
Chronic renal failure | Reduced | Increased | Increased | Reduced | Increased |
There are no specific features regarding kidney size of patients with ARF (Table 2). However, the renal size is usually normal in prerenal ARF, and it may increase in acute renal diseases such as ATN, interstitial nephritis, and acute glomerulonephritis. The finding of large, smooth kidneys with nondilated calyces should indicate that ARF is probably due to primary acute renal disease and that the process is potentially reversible. On the other hand, detection of kidneys of reduced size suggests a complicated underlying chronic nephropathy and worse prognosis.
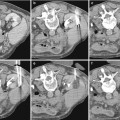
In prerenal ARF, RIs values lower than 0.7 are related to complete recovery after fluid restoration, whereas resistive indices (RIs) higher than 0.7 indicate a progression toward ischemic ATN and worse prognosis. In renal ARF, RIs values are usually higher than 0.7. An RI value of 0.75 is reported as optimal in attempting differential diagnosis between renal and prerenal ARF (Platt et al. 1991). Differential diagnosis between renal and prerenal ARF is difficult if ARF is determined by drug abuse or dehydration in elderly patients with hypertensive nephrosclerosis, since RIs are usually elevated for the preexisting renal parenchymal disease. Doppler US is unable to distinguish among various causes of renal ARF and ATN, since similar changes in renal RIs may be seen in septicemia, hypovolemia, rhabdomyolysis, nephrotoxic drug intake, and multiple-organ failure. On Doppler US evaluation, most patients with prerenal ARF have normal parenchymal flow, whereas patients with renal ARF reveal reduced renal parenchyma vascularity on color/power Doppler US (Fig. 1) with high RIs (Figs. 2 and 3). Renal parenchyma vascularity may appear even absent at the automatic color signal optimization (Fig. 1) due to slow arterial flow suppression from wall filters. The threshold values of renal RI for renal impairment and/or prognostic values of poor renal outcome range from 0.70 to 0.79 (Platt et al. 1994, 1997; Petersen et al. 1997; Radermacher et al. 2002). Anyway, the diastolic component of the Doppler trace may appear very much reduced or even inverted (Figs. 2 and 3).
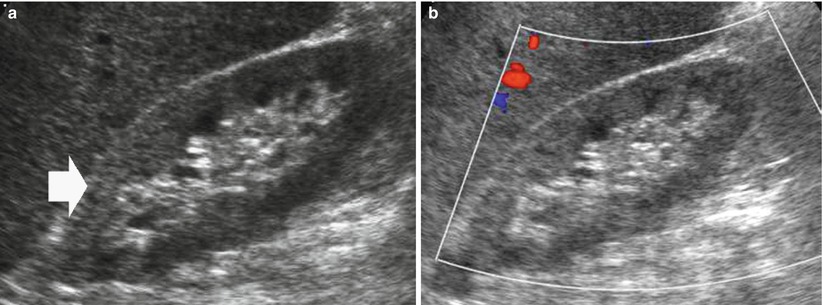
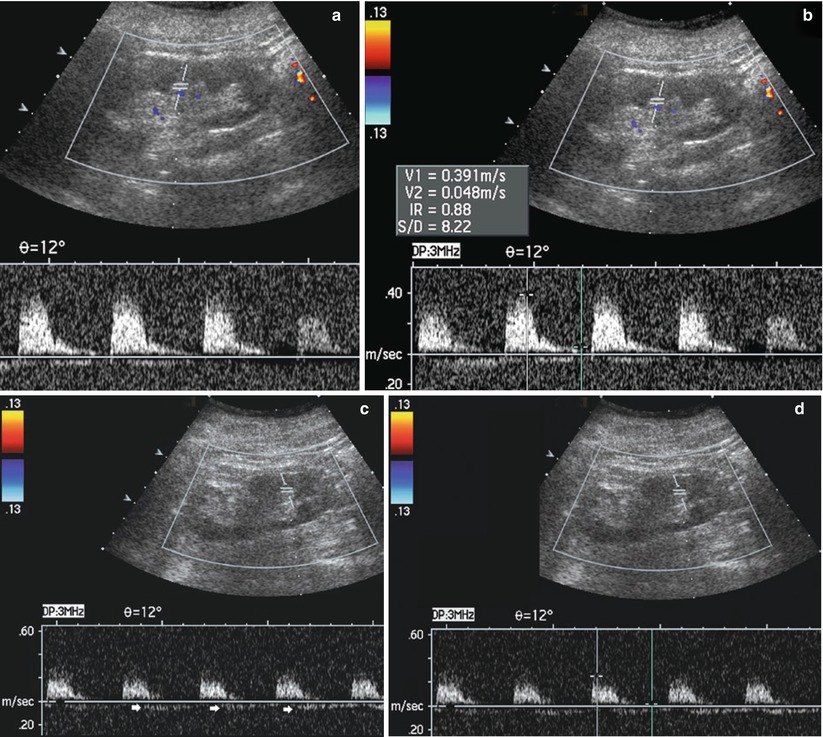
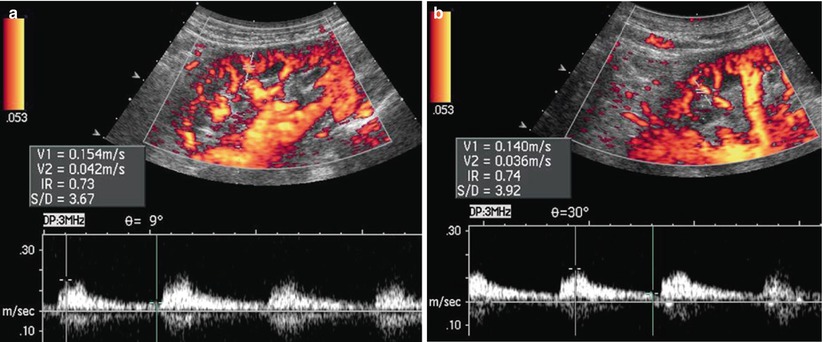
Fig. 1
(a, b) Acute renal failure in an 80-year-old patient with nephrosclerosis. (a) Grayscale US. Both kidneys present an increased cortical echogenicity (arrow) with increased corticomedullary differentiation. (b) Color Doppler. The renal parenchyma vascularity appears reduced on color Doppler analysis with no evidence of parenchymal arterial vessels
Fig. 2
(a–d) Acute renal failure with nephrotic syndrome in a 65-year-old man. Color Doppler US with pulsed Doppler interrogation of intrarenal arteries. Both kidneys present hyperechogenicity in the renal cortex with increased corticomedullary differentiation. (a, b) Right kidney; (c, d) left kidney. High resistive indices are registered in the intrarenal arteries even with inversion of the diastolic component (arrows) of the Doppler trace on the left kidney
Fig. 3
(a, b) ARF due to glomerulonephritis in a 55-year-old man. Power Doppler US with pulsed Doppler interrogation of intrarenal arteries. Both kidneys present hyperechogenicity in the renal cortex with increased corticomedullary differentiation. High RIs (from 0.75 to 0.8) are registered in the intrarenal arteries
On the other hand, Doppler US is a useful tool in the follow-up of prerenal and renal ARF during medical treatment, and normalization of renal RIs frequently advances recovery of renal function. Color and power Doppler US may identify a global reduction of intraparenchymal flow in diffuse renal parenchyma disease or focal reduction of renal perfusion in renal infarction, severe acute pyelonephritis, or embolic disease. Recently, contrast-enhanced US has been proposed as a potential technique to quantify the reduction of renal perfusion in ARF (Wei et al. 2001).
Prolonged or severe prerenal ARF may lead to ATN, which designates any form of ARF not due to obstruction, vascular disorders, or glomerular or interstitial disease (Finkel 2009). ATN is a reversible renal lesion and represents the most common presentation of ARF in hospitalized patients affecting 5–7 % of all hospitalized patients, and it may be determined by ischemia–reperfusion injury, nephrotoxic injury or rhabdomyolysis, nephrotoxic drugs (aminoglycosides, antibiotics, iodinated contrast agents, heavy metals, or myoglobin), inflammation, or sepsis. In a significant number of patients, ATN is multifactorial. The mortality rate in intensive care unit patients with ATN approaches 60 % when renal replacement therapy is required. Chronic dialysis therapy is needed by 5–30 % of surviving patients. ATN is characterized histologically by destruction of tubular cells with rupture of basement membrane and tubular occlusion by casts. US is usually employed to rule out postrenal ARF due to urinary tract obstruction from renal and prerenal ARF usually due to ATN. ATN may not determine any morphological renal alteration.
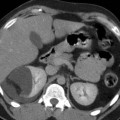
In renal ARF, both kidneys frequently appear enlarged and with increased cortical echogenicity and corticomedullary differentiation (Fig. 4) and with increased values of RIs. The clinical course of the parenchymal disease determining the ARF may be monitored with Doppler US by using serial measurements of renal RIs with a progressive decrease of RIs (Fig. 5), which can precede the recovery of renal function, or with an increase of RIs in case of complications leading to a further deterioration of Doppler waveforms (Platt et al. 1991).
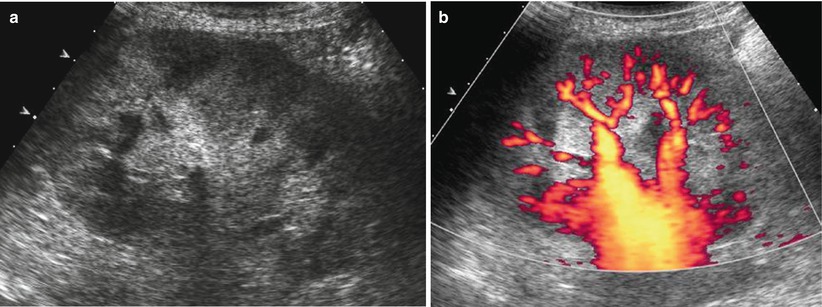
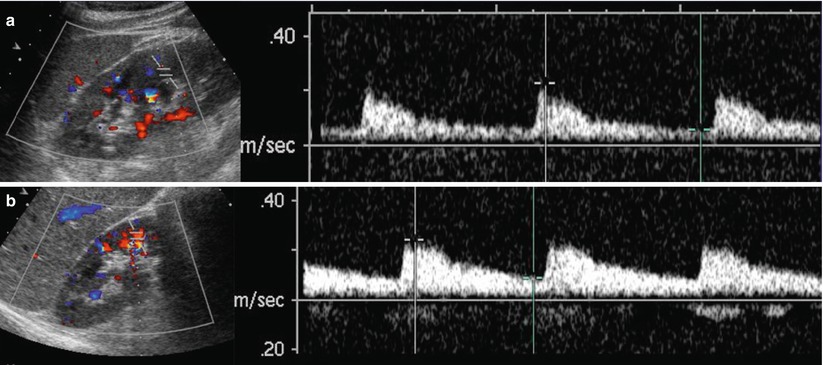
Fig. 4
(a, b) ARF due to acute tubular necrosis in a 60-year-old man with a progressive increase in the creatinine levels. (a) On grayscale US, kidneys appear enlarged and reveal increased cortical echogenicity and corticomedullary differentiation. (b) Power Doppler US revealed reduced renal cortical perfusion
Fig. 5
(a, b) ARF due to glomerulonephritis in a 66-year-old woman. (a) Color Doppler US with Doppler interrogation of the intrarenal arterial vessels. Both kidneys appear enlarged with increased RIs. (b) The clinical course of glomerulonephritis is monitored with Doppler US 7 days after the beginning of the corticosteroid therapy. There is a progressive decrease of the RIs due to a progressive increase of the diastolic component of the arterial Doppler trace
1.2 Postrenal Acute Renal Failure
In postrenal ARF urinary tract obstruction must be bilateral or unilateral in patients with a solitary kidney as in patients with renal agenesis or with renal transplantation or with preexisting impaired renal function. It may be due to various pathological conditions such as pelvic malignancies or prostatic disease (Fig. 6). In clinical practice, this condition accounts for approximately 5–25 % of cases of ARF. US is accurate in detecting hydronephrosis, even though it may reveal false-negative results, such as obstructive ARF with nondilated urinary tract, or false-positive results such as dilation of the urinary tract in nonobstructed patients (Quaia and Bertolotto 2002). The employing of tissue harmonic imaging modality has improved the detection of dilated urinary tract and of small perirenal urinomas due to the increased signal-to-noise ratio and spatial and contrast resolution, and reduction of artifacts. The clinically important distinction of renal obstruction from nonobstructive dilatation cannot in general be resolved by grayscale US. The accuracy of US to rule out obstruction increases in patients with an high pretest probability of urinary tract obstruction such as patients with a history suggestive for obstruction like pelvic malignancy, palpable abdominal or pelvic mass, suspected renal colic, and recent pelvic surgery.
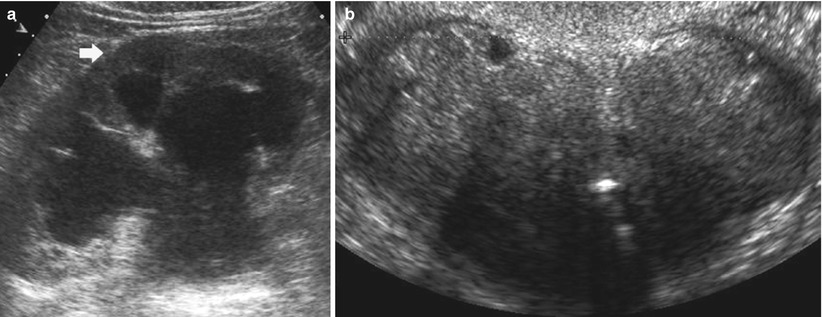
Fig. 6
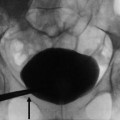
(a, b) Acute postrenal renal failure. Grayscale US shows upper urinary tract dilatation in a 70-year-old man with benign prostatic hyperplasia. (a) Grayscale US reveals third-grade hydronephrosis on both kidneys with clear reduction of the renal cortical thickness (arrow). (b) Benign prostatic hyperplasia with urethral obstruction was the cause of the whole urinary tract obstruction
Doppler US may provide unique data not available from conventional US in postrenal ARF. Renal vasoconstriction is the key factor in the pathophysiological course of acute and chronic obstruction and increased RIs values result. A mean RI >0.7 and a difference of >0.06–0.08 between the average RI of the two kidneys are considered diagnostic of obstruction. Demonstration of high RI in patients with ARF and hydronephrosis increases the diagnostic confidence for a diagnosis of obstruction. RIs elevation occurs by 6 h of clinical acute renal obstruction and may precede pyelocaliectasis. A significant fall in RIs values appears after the removal of the urinary obstruction (Fig. 7) or after nephrostomy. In general, there should be a rapid return to normal RIs if obstruction is relieved within 5 h, whereas RIs may take days or even weeks to return to baseline levels if obstruction is present for at least 18–24 h.
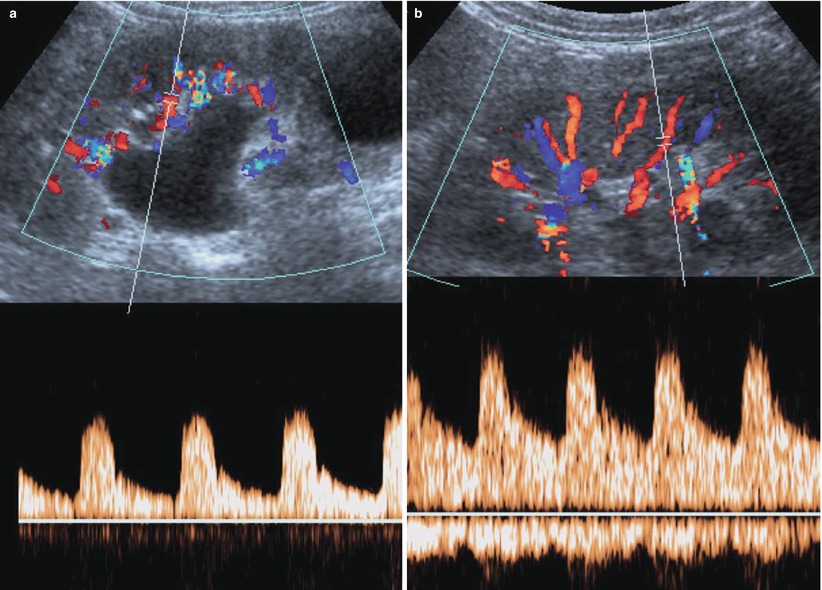
Fig. 7
(a, b) Acute postrenal failure due to ureteral obstruction from a urinary stone. Grayscale US with Doppler interrogation of the intrarenal arterial vessels. (a) Dilatation of the renal urinary tract with increased RIs measured on renal arteries. (b) Dilatation of the urinary tract is reduced with normalization of the RIs due to the increase of diastolic component of the renal blood flow after removal
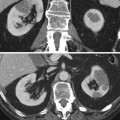
CT urography is effective in demonstrating urinary tract dilatation or obstruction (Fig. 8). The static-fluid MR urography is also an effective technique to show urinary tract obstruction. On the heavily T2-weighted images, the urinary tract is hyperintense because of its long relaxation time, independent of the excretory renal function. This technique is ideally suited for patients with dilated or obstructed collecting system.
Get Clinical Tree app for offline access
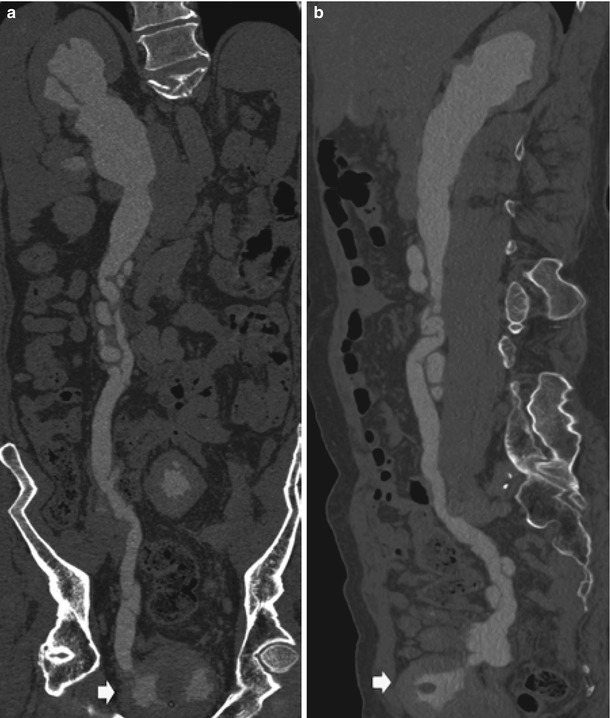
Fig. 8
Urinary tract obstruction due to benign prostatic hypertrophy in a patient with a previous left nephrectomy. CT urography, curved planar reformations on the coronal (a) and sagittal plane (b


Related posts:

Stay updated, free articles. Join our Telegram channel
Full access? Get Clinical Tree
