Fair Game
ANSWERS – CASE 74
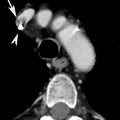
Porcelain Gallbladder
2. A clean shadow favors porcelain gallbladder, and a dirty shadow favors emphysematous cholecystitis.
3. An abdominal radiograph or a CT scan could help to distinguish gallbladder wall calcification from gas.
4. It would not be possible to see the back wall of the gallbladder if the lumen were full of stones.
ANSWERS – CASE 75
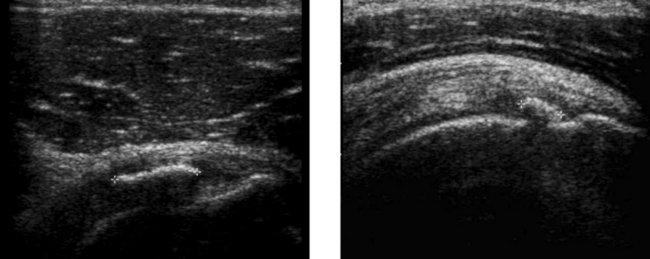
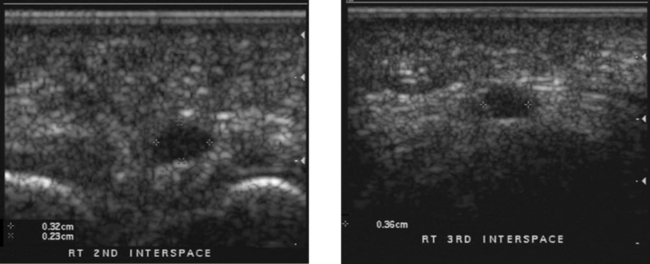
Calcific Tendinitis of the Rotator Cuff
1. Radiographs may show a focal area of soft tissue calcification in the region of the rotator cuff. The calcification may be difficult to see if it is projected over bone on all views.
2. MRI would show a signal void on all sequences. For this reason, calcific tendinitis is often missed on MRI.
3. Ultrasound is the best way to identify, quantitate, and localize calcific tendinitis of the rotator cuff.
4. As with other musculoskeletal examinations, shoulders should be scanned with a linear array transducer with a center frequency of 7 to 12 MHz.
ANSWERS – CASE 76
ANSWERS – CASE 77
ANSWERS – CASE 78
ANSWERS – CASE 79
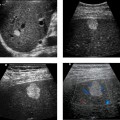
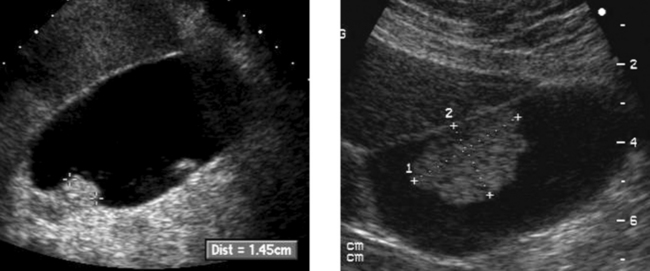
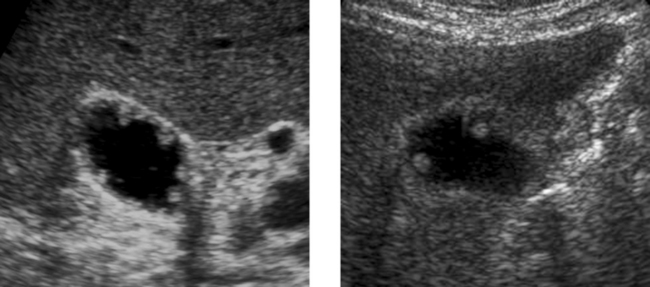
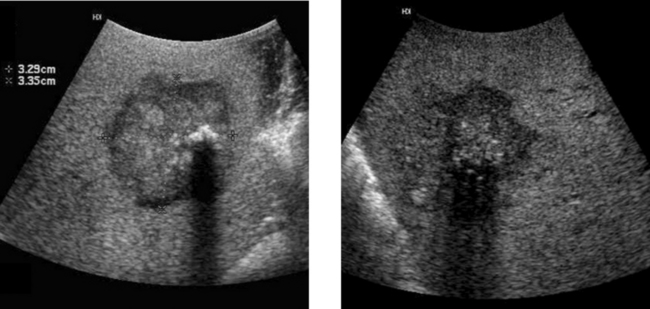
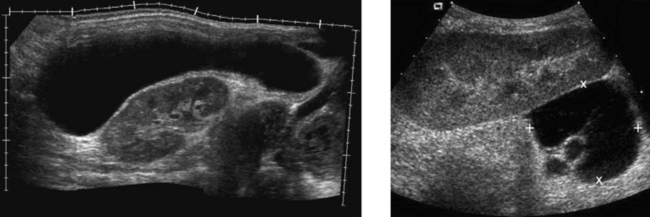
Gallbladder Cancer
1. The second image, which shows a hypoechoic mass encasing a gallstone and invading the liver, is most typical of gallbladder cancer.
3. Gallstones, chronic wall inflammation, and gallbladder wall calcification predispose to gallbladder cancer.
4. The differential includes benign polyps, complicated cholecystitis, hepatocellular cancer, and cancer of RUQ bowel structures.
ANSWERS – CASE 80
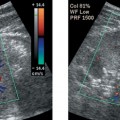
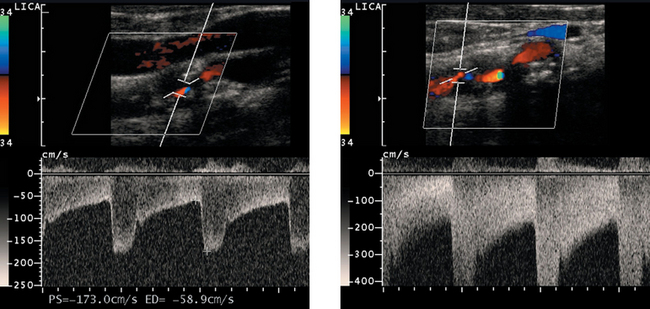
High-Grade Carotid Stenosis
1. Peak systolic velocity, end diastolic velocity, the ratio of internal carotid artery (ICA) to common carotid artery (CCA) peak systolic velocity, and the ratio of ICA to CCA end diastolic velocity.
3. The second waveform, with a velocity of greater than 400 cm/s, indicates the high-grade stenosis.
4. A very tight stenosis may rarely be associated with normal velocities if the flow volume has dropped almost to zero.
ANSWERS – CASE 81
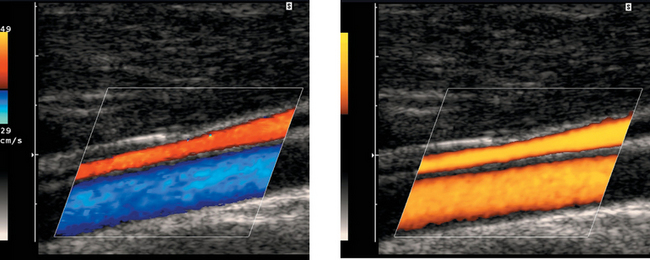
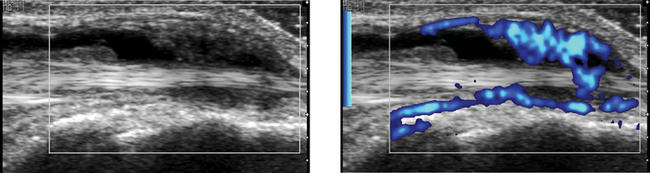
Comparison of Color Doppler with Power Doppler
2. The advantage of color Doppler is its capability to determine flow direction and its relative lack of sensitivity to tissue and transducer motion.
3. The advantage of power Doppler is its increased sensitivity to slow flow and decreased dependence on the Doppler angle.
4. Color Doppler codes based on mean frequency shift, which is dependent on flow velocity. Power Doppler gives no velocity information.

ANSWERS – CASE 82
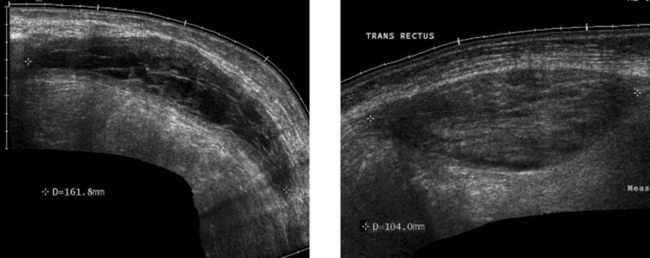
Rectus Sheath Hematoma
2. The more solid-appearing hematoma (the second image) is more acute, and the more complex, partially liquefied hematoma is older.
3. Most rectus sheath hematomas are due to anticoagulation or to severe contraction of the rectus muscles from coughing, sneezing, defecation, and other activities.
ANSWERS – CASE 83
ANSWERS – CASE 84
ANSWERS – CASE 85
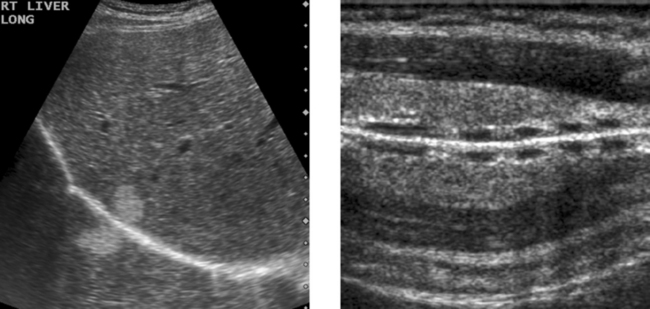
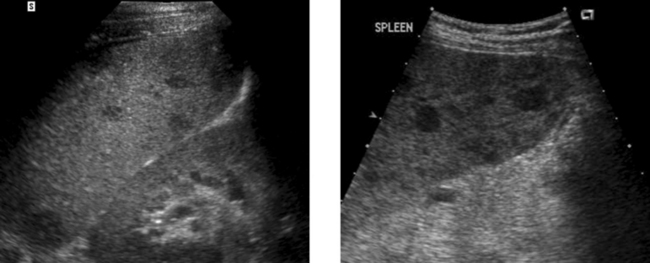
Focal Splenic Lesions
2. The differential diagnosis primarily includes metastasis, lymphoma, sarcoidosis, and abscess. Infarcts can also produce an appearance similar to this but usually a peripheral location can be documented.
3. In general, it is preferable to avoid the spleen because it is very vascular. In most patients, other sites exist that can be biopsied with less risk of bleeding. However, when necessary, splenic lesions can be biopsied with ultrasound guidance. With the use of fine needle aspiration (22- to 25-gauge needles) and cytologic analysis, the risk is very low.
4. CT could help to define a primary tumor or lymphadenopathy elsewhere in the chest or abdomen. With contrast enhancement, it might help to further characterize the splenic lesions.
ANSWERS – CASE 86
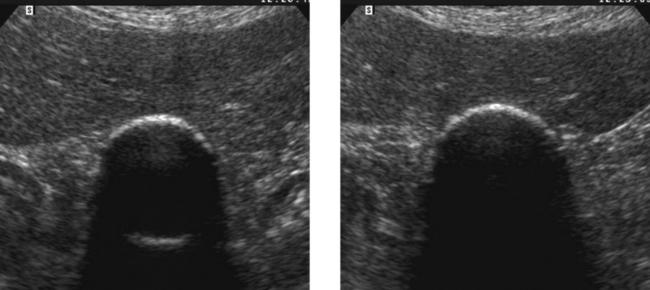
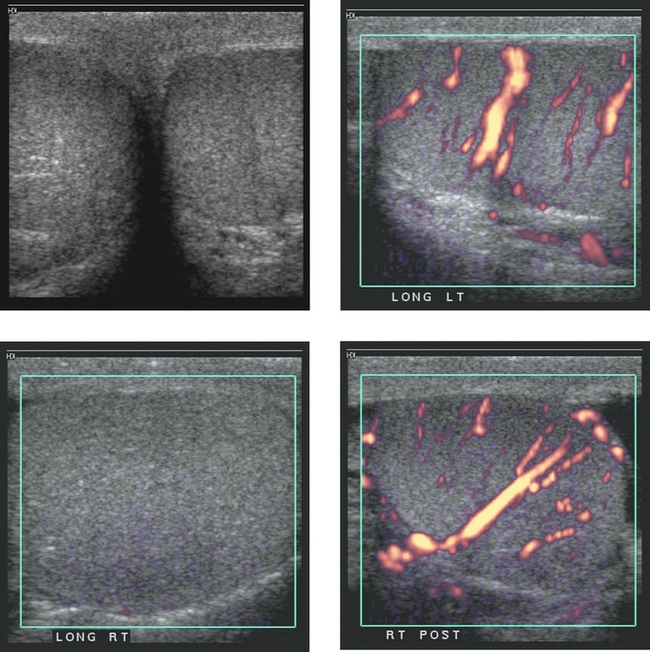
Testicular Torsion
1. The gray-scale view shows testes that are symmetric in echogenicity and normal in appearance. The power Doppler view of the left testis shows normal distribution of flow in multiple intratesticular vessels. The first power Doppler view of the right testis shows no detectable blood flow. The second power Doppler view shows normal intratesticular flow. The first three views are typical of acute right testicular torsion. The lower right image was taken after manual detorsion.
3. The gray-scale appearance of the right testis is normal. This is very good evidence that the testis is still viable. Therefore, it is very likely that the patient has been symptomatic for less than 24 hours.
4. The patient was manually detorsed between the first and second power Doppler views of the right testis. The repeat view of the testis confirmed the success of the maneuver.
ANSWERS – CASE 87
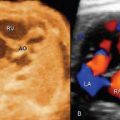
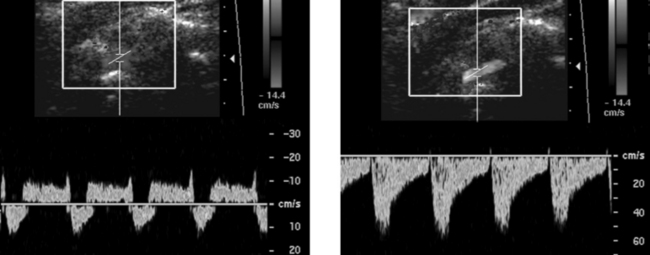
Subclavian Steal
1. This abnormality is caused by stenosis of the subclavian artery prior to the origin of the vertebral artery.
2. The first waveform was obtained at rest when there was a partial steal and retrograde flow only during peak systole. The second image was obtained after left arm exercise when there was complete steal and retrograde flow throughout the cardiac cycle.
3. A vertebral vein can be confused with an artery on color Doppler. Pulsed Doppler waveforms are needed to show that flow is arterial and not venous.
ANSWERS – CASE 88
ANSWERS – CASE 89
ANSWERS – CASE 90
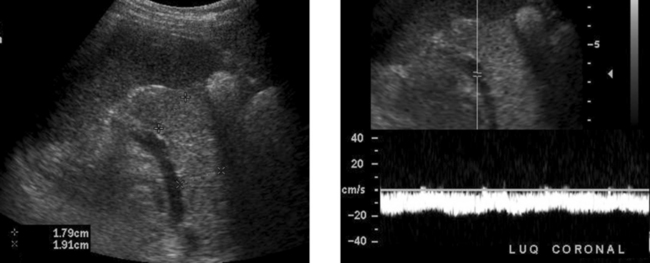
Renal Transplant Lymphocele
3. Like all other imaging tests, ultrasound is not good enough at diagnosing rejection to guide patient management. That is why biopsies are still necessary.
4. The leak usually occurs at the anastomosis of the ureter to the bladder. Therefore, the fluid collection usually is between the lower pole of the transplant and the bladder.
ANSWERS – CASE 91
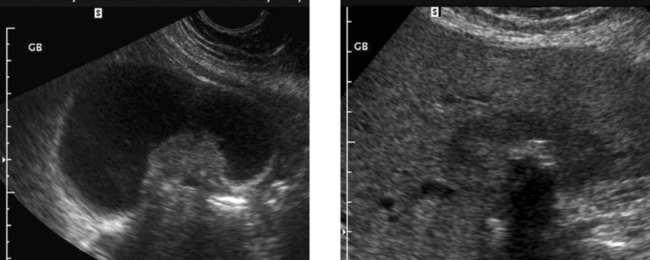
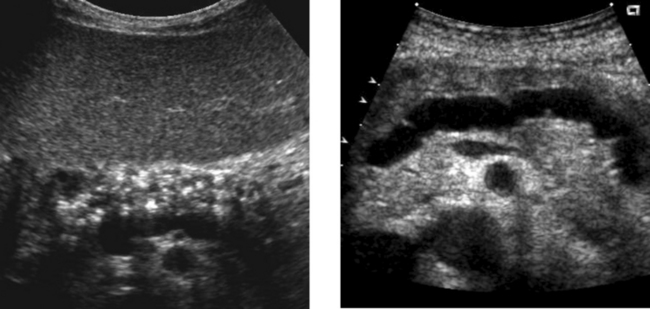
Chronic Pancreatitis
1. The first image shows diffuse punctate calcifications in the pancreas. The second image shows irregular dilatation of the pancreatic duct. These abnormalities are all consistent with chronic pancreatitis.
2. ERCP would show irregular dilatation and short strictures of the pancreatic duct, with ectatic side branches and possibly filling defects due to intraductal concretions.
4. A pseudocyst. Approximately 25% to 40% of patients with chronic pancreatitis develop pseudocysts.